. 2022 Jul 11;57(13):1582-1597.e6.
doi: 10.1016/j.devcel.2022.05.016. Epub 2022 Jun 15.

The cellular architecture and molecular determinants of the zebrafish fusogenic synapse

Affiliations

The cellular architecture and molecular determinants of the zebrafish fusogenic synapse

Zhou Luo et al. Dev Cell. .

Abstract

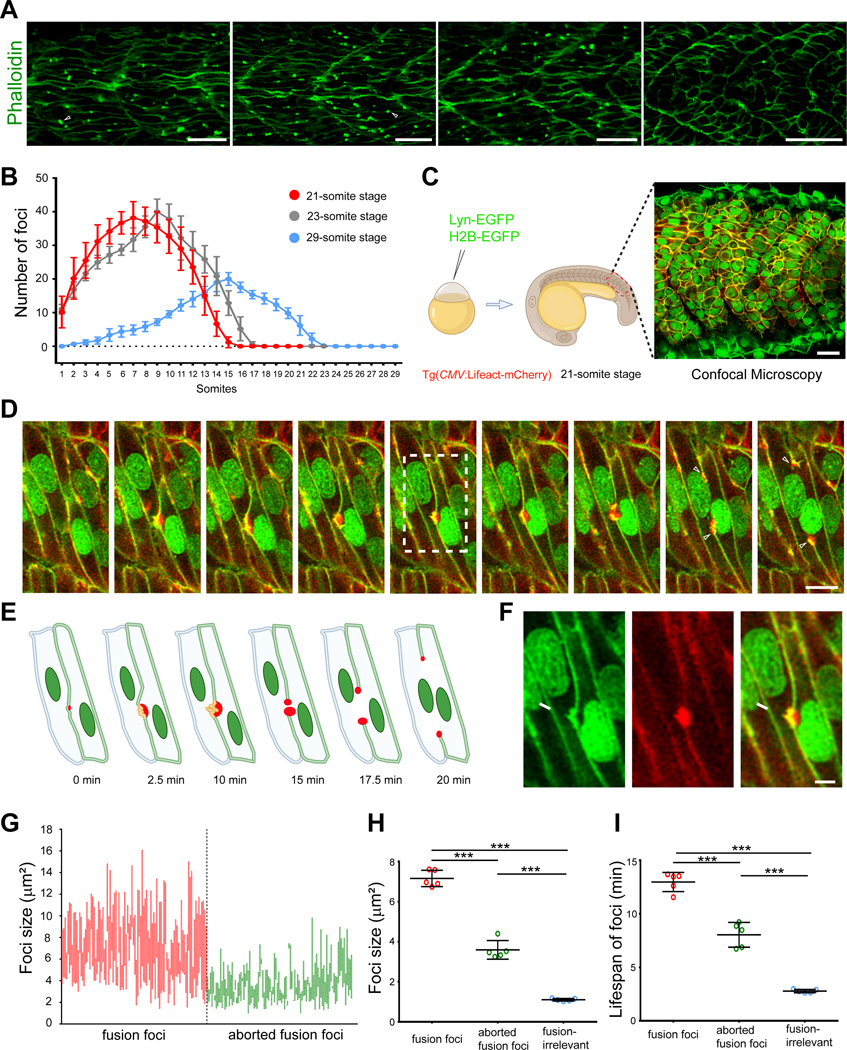
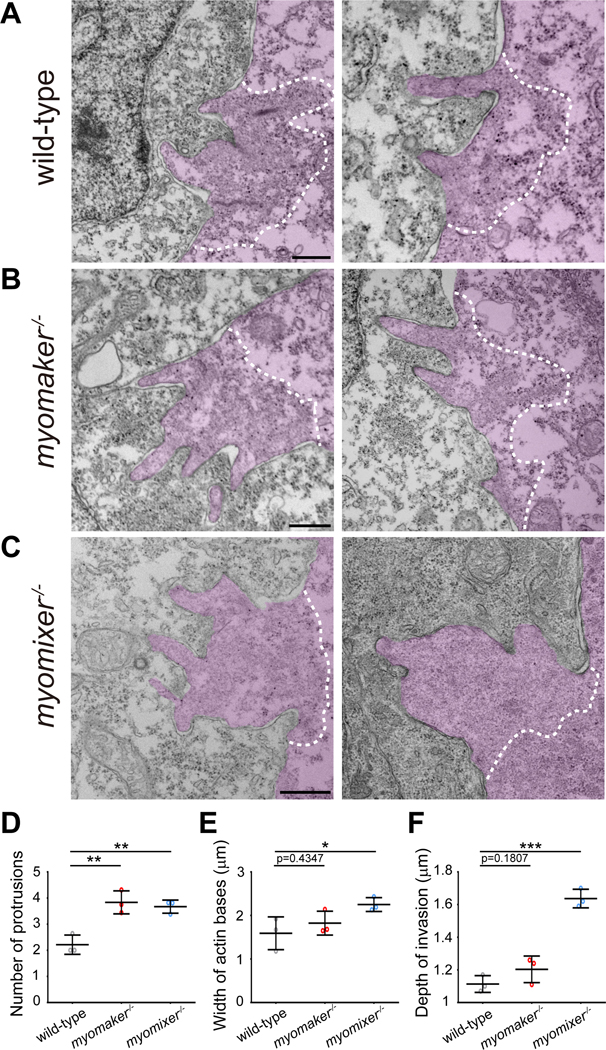
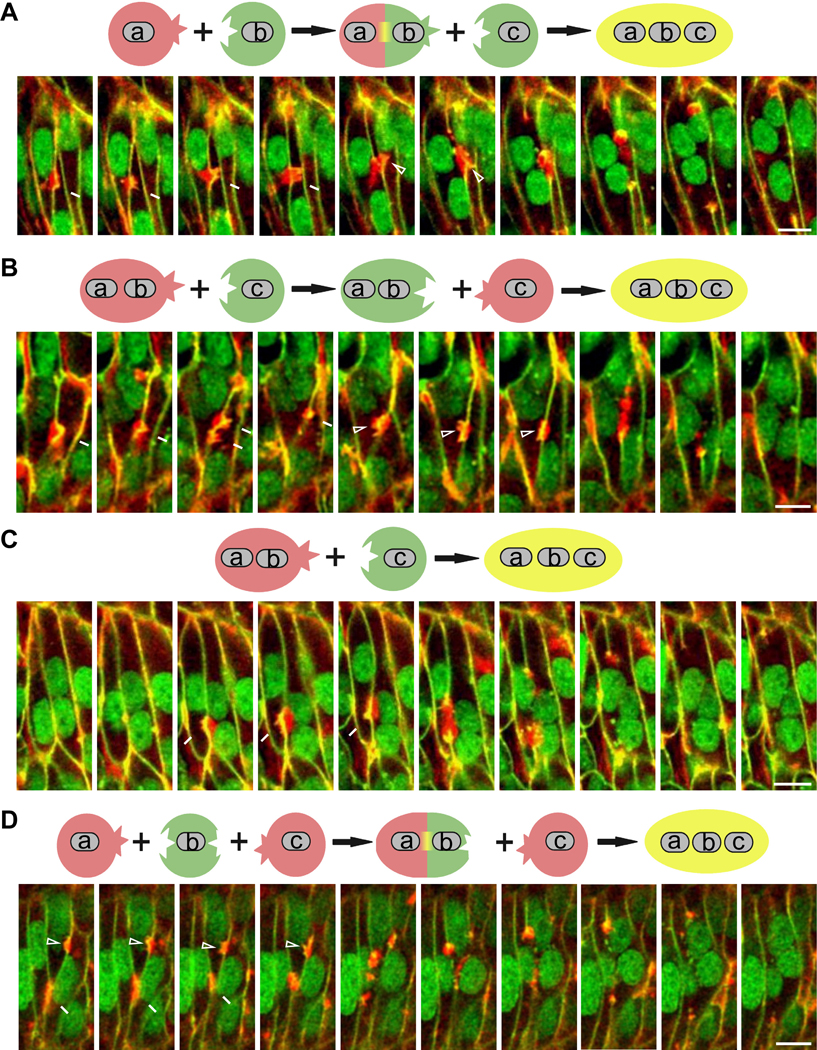
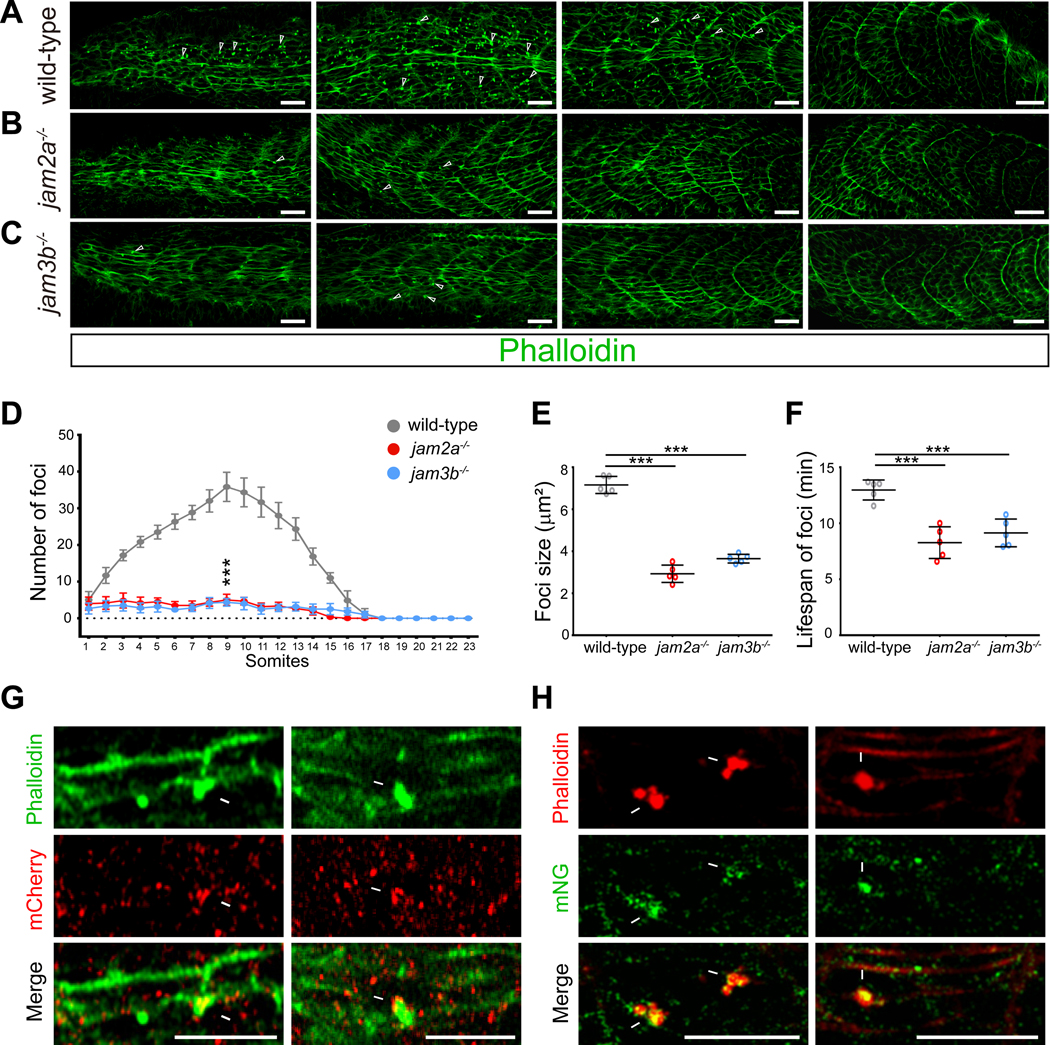
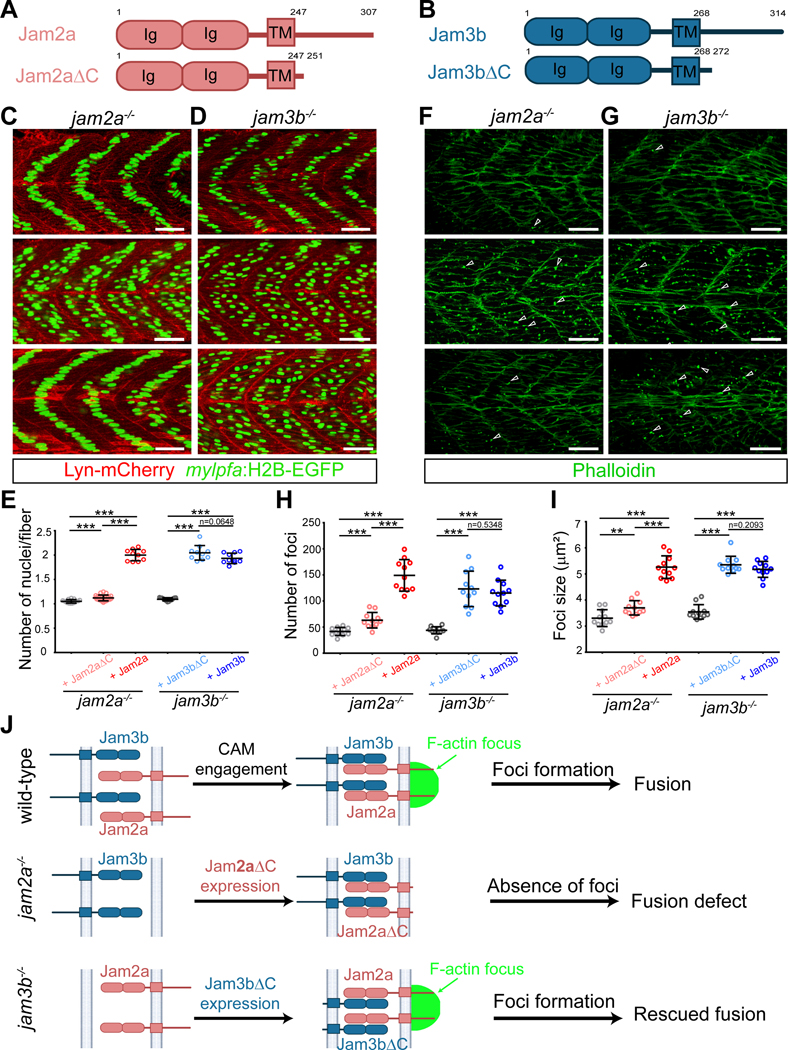
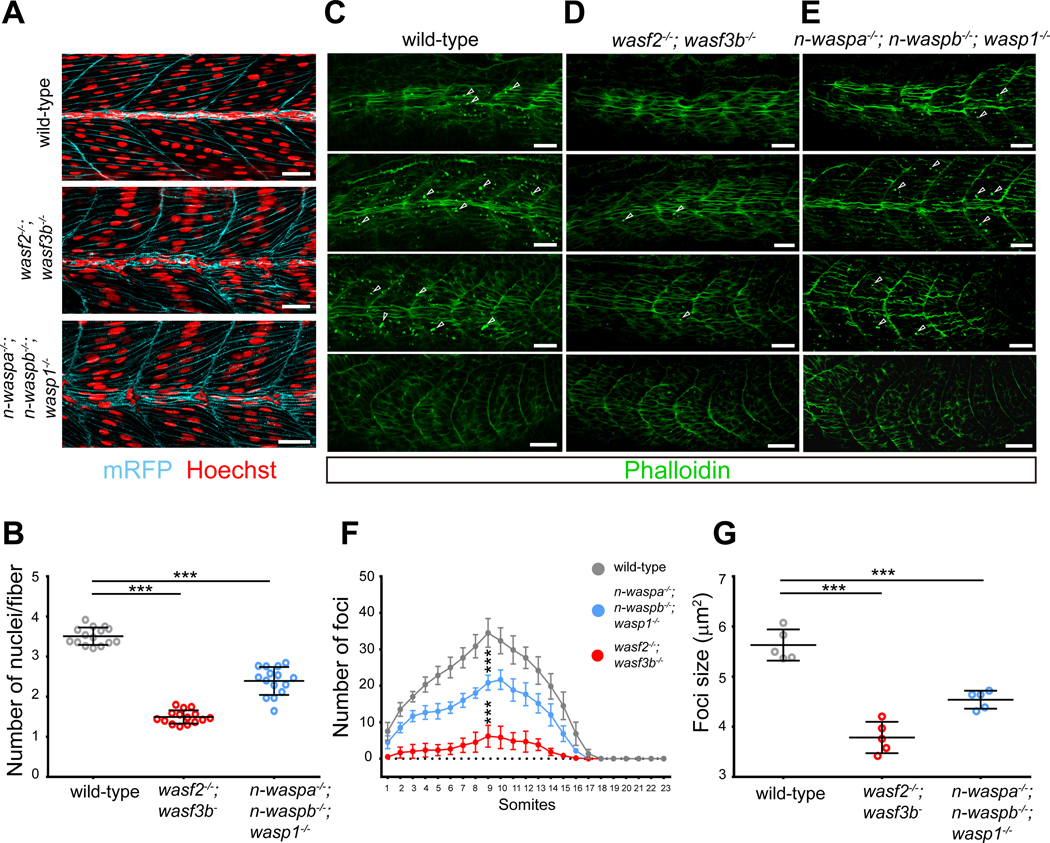
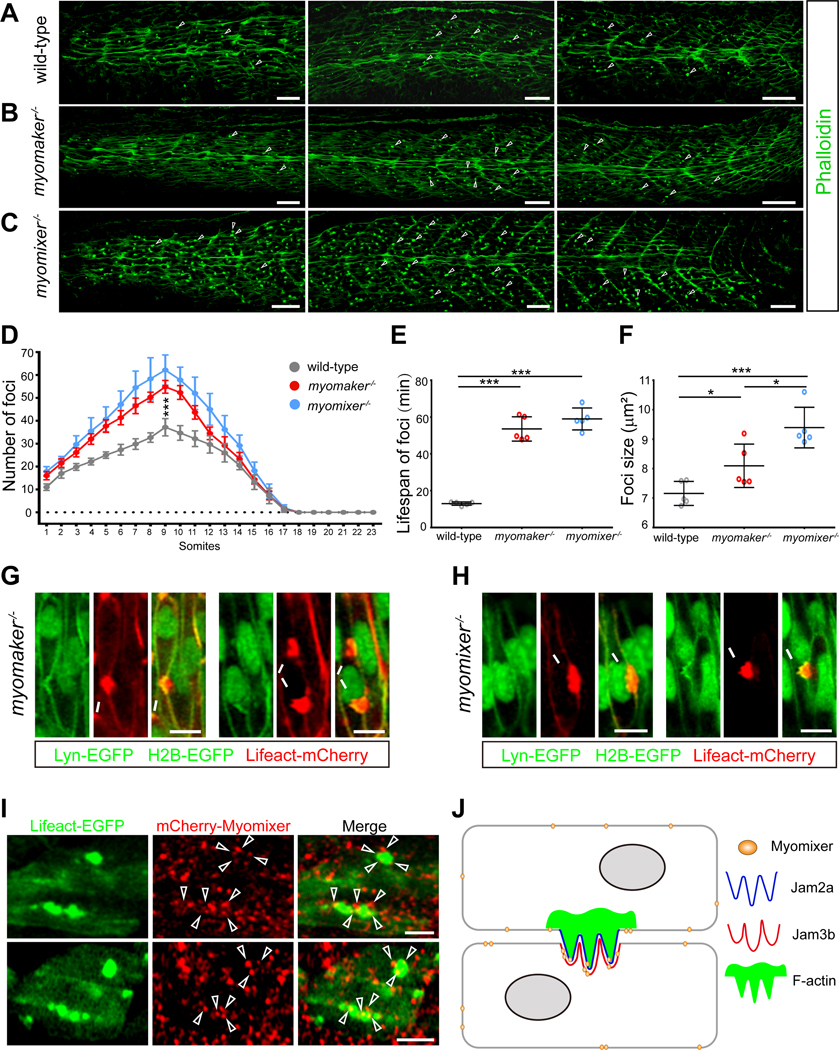
Myoblast fusion is an indispensable process in skeletal muscle development and regeneration. Studies in Drosophila led to the discovery of the asymmetric fusogenic synapse, in which one cell invades its fusion partner with actin-propelled membrane protrusions to promote fusion. However, the timing and sites of vertebrate myoblast fusion remain elusive. Here, we show that fusion between zebrafish fast muscle cells is mediated by an F-actin-enriched invasive structure. Two cell adhesion molecules, Jam2a and Jam3b, are associated with the actin structure, with Jam2a being the major organizer. The Arp2/3 actin nucleation-promoting factors, WAVE and WASP-but not the bipartite fusogenic proteins, Myomaker or Myomixer-promote the formation of the invasive structure. Moreover, the convergence of fusogen-containing microdomains and the invasive protrusions is a prerequisite for cell membrane fusion. Thus, our study provides unprecedented insights into the cellular architecture and molecular determinants of the asymmetric fusogenic synapse in an intact vertebrate animal.

Keywords: Jam2a/Jamb; Jam3b/Jamc; Myomaker; Myomixer; WASP and WAVE; actin cytoskeleton; cell-cell fusion; invasive membrane protrusions; myoblast fusion; zebrafish muscle development.


Conflict of interest statement

Declaration of interests The authors declare no competing interests.

Figures

Figure 1.
Figure 1.. Zebrafish myoblast fusion is mediated by F-actin foci.
(A) F-actin foci are present in 20 hpf zebrafish myotome. Arrowheads indicate a few randomly selected foci. Scale bars, 25 μm. (B) A graph showing the average F-actin foci number in each somite along the A-P axis of 19.5 hpf (21-somite stage, red), 20 hpf (23-somite stage, grey) and 24 hpf (29-somite stage, blue) embryos, respectively. Six embryos were analyzed for each stage. The error bars represent standard deviation. (C) Schematic diagram of live embryo imaging. Plasma membrane (green) and nuclei (green) were labelled by Lyn-EGFP and H2B-EGFP, respectively. F-actin (red) was labelled by the transgene Tg(CMV:Lifeact-mCherry). (D) Still images of a myoblast fusion event between two mononucleated muscle cells. The nuclei of the two fusing myoblasts are indicated with a and b. The fusion pore formed at ~t=15 min followed by the merging of the two cells. Arrowheads indicate the split actin focus that remained at the rim of the expanding fusion pore. Scale bar, 10 μm. (E) Schematic drawings of the fusion event at several representative time points displayed in (D). (F) Enlarged image from boxed area at t=10 min in (D) showing the inward curvatures on the plasma membrane (arrow) caused by invasive protrusions. Scale bar, 5 μm. (G) The range of F-actin foci size during myoblast fusion. Red lines and green lines represent the size range of individual fusion foci and aborted fusion foci during their lifespans, respectively. (H) Dot plot of the average size of fusion foci, aborted fusion foci, and fusion-irrelevant foci. Each data point represents the average value per embryo, instead of the actual value of each focus, to reflect the differences between embryos in this and all the subsequent dot plots. (I) Dot plot of the average lifespan of fusion foci, aborted fusion foci, and fusion-irrelevant foci. In (B), (H) and (I), mean ± s.d. values are shown, and significance was determined by the unpaired parametric t test. *** p < 0.001. See also Figure S1, Video S1 and S2.
Figure 2.
Figure 2.. The invasive F-actin structure consists of fingerlike protrusions.
(A-C) EM micrographs of fast muscle cells in 21-somite stage wild-type (A), myomaker−/− (B) and myomixer−/− (C) embryos. The invading cells are pseudo-colored in light magenta. Note the invasive membrane protrusions projected from an F-actin base (gray coloration) devoid of intracellular organelles. The boundary of the F-actin-enriched area is delineated by a white dashed line. Scale bar, 500 nm. (D-F) Dot plots showing the number of invasive protrusions (D), width of the actin base (E) and the maximal depth of invasion (F) in wild-type, myomaker−/− and myomixer−/− embryos. The width of the actin base was measured as the distance between the base of the outermost invasive protrusions. Mean ± s.d. values are shown in dot plots, and statistical analysis was performed for each parameter in n=3 embryos using the unpaired parametric t test. * p < 0.05, ** p < 0.01, and *** p < 0.001.
Figure 3.
Figure 3.. Cellular plasticity in zebrafish myoblast fusion.
In all panels, plasma membrane (green) and nuclei (green) were labelled by Lyn-EGFP and H2B-EGFP, respectively. F-actin (red) was labelled by the transgene Tg(CMV:Lifeact-mCherry). A schematic representation of the fusion event is shown above each panel. (A) Still images of two sequential myoblast fusion events in which the same myoblast (b) was an invader and a receiver. The nuclei of three fusing myoblasts are marked as a, b and c. Invasive protrusions (arrows) projected from cell a into cell b resulted in a-b fusion (~t=17.5 min), generating the binucleated cell ab. Subsequently, invasive protrusions (arrowheads) projected from cell b (17.5 min) and cell ab (after 17.5 min) into cell c resulted in ab-c fusion (~t=22.5 min), generating the tri-nucleated cell abc. Scale bar, 10 μm. See also Video S3. (B) Still images of a myoblast fusion event in which the identities of invading and receiving cells were reversed. The nuclei of two fusing muscle cells are marked as ab and c. Invasive protrusions (arrows) projected from the bi-nucleated cell ab into the mononucleated cell c did not result in fusion. However, invasive protrusions projected from cell c into ab at a later time point (~t=22.5 min) led to ab-c fusion, generating the tri-nucleated cell abc. Scale bar, 10 μm. See also Video S4. (C) Still images of a myoblast fusion event in which a bi-nucleated muscle cell invaded a mononucleated myoblast. The nuclei of the two fusing muscle cells are marked with ab and c. Invasive protrusions (arrows) projected from the bi-nucleated cell ab into the mononucleated cell c resulted in ab-c fusion (~t=12.5 min), generating the tri-nucleated cell abc. Scale bar, 10 μm. See also Video S5. (D) Still images of two fusion events in which two myoblasts invaded the same receiving cell. The nuclei of the three fusing myoblasts are marked as a, b and c. Invasive protrusions (arrows) projected from cell a into b resulted in the formation of the bi-nucleated cell ab (~t=7.5 min). Invasive protrusions (arrowheads) projected from cell c into b and later ab resulted in the formation of the tri-nucleated cell abc at ~t=10 min. Scale bar, 10 μm. See also Video S6.
Figure 4.
Figure 4.. Jam2a and Jam3b organize actin foci formation and are localized at the fusogenic synapse.
(A-D) Reduction of F-actin foci number in jam2a−/− and jam3b−/− mutant embryos. Confocal images of 23-somite stage wild-type (A), jam2a−/− (B), and jam3b−/− (C) mutant embryos. Arrowheads indicate a few randomly selected actin foci. Scale bar, 25 μm. (D) A graph showing the number of average foci number in each somite of fixed wild-type, jam2a−/−, and jam3b−/− mutant embryos. F-actin foci of >2 μm2 (including the fusion foci and aborted fusion foci) were counted. Data are represented as mean ± s.d. Statistical analysis was performed for foci number in somite 9 of n=6 embryos using the unpaired parametric t test. *** p < 0.001. (E) Reduction of F-actin foci size in jam2a−/− and jam3b−/− mutant embryos. Dot plot showing the average size of the F-actin foci during their lifespan in live embryos. (F) Reduced lifespan of F-actin foci in jam2a−/− and jam3b−/− mutant embryos. In (E) and (F), each data point represents the mean value of an embryo. Mean ± s.d. values are shown in the dot plot, and significance was determined by the unpaired parametric t test. *** p < 0.001. (G and H) Subcellular localization of mCherry-tagged Jam2a and Jam3b (G) or mNeonGreen-tagged Jam2a and Jam3b (H) in 23-somite stage embryos. The F-actin foci (arrows) were visualized by phalloidin staining. Scale bar, 25 μm.
Figure 5.
Figure 5.. Differential activities of Jam2a and Jam3b in organizing the F-actin foci.
(A and B) Schematic diagrams of Jam2a and Jam2aΔC (A), and Jam3b and Jam3bΔC (B). (C) Confocal images of 48 hpf jam2a−/− mutant embryos either un-injected or injected with Jam2a-mCherry or Jam2aΔC-mCherry mRNA. Note that Jam2a-mCherry, but not Jam2aΔC-mCherry, significantly rescued the fusion defect in jam2a−/− mutant embryos. (D) Confocal images of 48 hpf jam3b−/− mutant embryos either un-injected or injected with Jam3b-mCherry or Jam3bΔC-mCherry mRNA. Note that both Jam3b-mCherry and Jam3bΔC-mCherry rescued the fusion defect in jam3b−/− mutant embryos. In (C) and (D), nuclei were labelled with Tg(mylpfa:H2B-EGFP) (green) and membranes with Lyn-mCherry (red). Scale bar, 25 μm. (E) Quantification of the rescue experiments in (C) and (D). Dot plot showing the nuclei number per myofiber (in somites 10–12) of jam2a−/− (un-injected or injected with Jam2aΔC-mCherry or Jam2a-mCherry mRNA) and jam3b−/− mutant (un-injected or injected with Jam3bΔC-mCherry or Jam3b-mCherry mRNA) embryos at 48 hpf. (F) Confocal images of 23-somite stage jam2a−/− mutant embryos un-injected or injected with Jam2a-mCherry or Jam2aΔC-mCherry mRNA. Note that the F-actin foci number was significantly rescued by Jam2a-mCherry, but not by Jam2aΔC-mCherry, expression in jam2a−/− mutant embryos. (G) Confocal images of 23-somite stage jam3b−/− mutant embryos either un-injected or injected with Jam3b-mCherry or Jam3bΔC-mCherry mRNA. Note that the F-actin foci number was rescued by either Jam3b-mCherry or Jam3bΔC-mCherry expression in jam3b−/− mutant embryos. In (F) and (G), the F-actin foci were visualized by phalloidin staining (arrowheads). Scale bar, 25 μm. (H) Quantification of the F-actin foci numbers in jam2a−/− and jam3b−/− mutant embryos in (F) and (G). Dot plot showing the foci number in jam2a−/− embryos un-injected (41.55 ± 7.75), injected with Jam2aΔC-mCherry (63.09 ± 14.87) or Jam2a-mCherry mRNA (149.00 ± 30.24), and in jam3b−/− embryos un-injected (43.82 ± 6.84), injected with Jam3bΔC-mCherry (123.10 ± 33.98) or Jam3b-mCherry mRNA (115.10 ± 24.69) at 23-somite stage. In each experiment, the foci numbers in somite 9–16 of n=11 embryos were quantified. (I) Quantification of the F-actin foci sizes in jam2a−/− and jam3b−/− mutant embryos in (F) and (G). Dot plot showing the foci size in jam2a−/− embryos un-injected (3.31 ± 0.32 μm2), injected with Jam2aΔC-mCherry (3.70 ± 0.27 μm2) or Jam2a-mCherry mRNA (5.26 ± 0.43 μm2), and in jam3b−/− embryos un-injected (3.55 ± 0.28 μm2), injected with Jam3bΔC-mCherry (5.35 ± 0.33 μm2) or Jam3b-mCherry mRNA (5.18 ± 0.31μm2) at 23-somite stage. In each experiment, the foci sizes in somite 9–16 of n=11 embryos were quantified. In (E), (H) and (I), each data point represents the mean value of an embryo. Mean ± s.d. values are shown in the dot plot, and significance was determined by the unpaired parametric t test. ** p < 0.01; *** p < 0.001. (J) Schematic drawing summarizing the results of the rescue experiments in jam2a−/− and jam3b−/− mutants. Note that Jam2a, but not Jam3b, is the major organizer of the actin focus.
Figure 6.
Figure 6.. WAVE and WASP proteins promote myoblast fusion and F-actin foci formation.
(A) Myoblast fusion defect in wave and wasp mutant embryos. Confocal images of 48 hpf wild-type, wasf2−/−; wasf3b−/− double mutant, and n-waspa−/−; n-waspb−/−; wasp1−/− triple mutant embryos expressing a membrane-localized mRFP (cyan). Embryos were stained with Hoechst to visualize the nuclei (red). Scale bar, 25 μm. (B) Quantification of the myoblast fusion defect in wave and wasp mutant embryos in (A). Dot plot showing the nuclei number per myofiber per embryo. The nuclei number in somites 10–12 from n=15 embryos were quantified for each genotype. The same wild-type dataset was used in Figures S5B and S5C. (C-E) Reduced F-actin foci number in wave and wasp mutant embryos. Confocal images of 23-somite stage wild-type (C), wasf2−/−; wasf3b−/− double mutant (D), and n-waspa−/−; n-waspb−/−; wasp1−/− triple mutant (E) embryos. Arrowheads indicate a few randomly selected foci. Scale bar, 25 μm. (F) Quantification of the F-actin foci number in wave and wasp mutant embryos. A graph showing the average foci number in each somite of fixed wild-type, wasf2−/−; wasf3b−/− double mutant and n-waspa−/−; n-waspb−/−; wasp1−/− triple mutant embryos. Data are represented as mean ± s.d. Statistical analyses were performed for the foci number in somite 9 of n=6 embryos using the unpaired parametric t test. *** p < 0.001. (G) Quantification of the F-actin foci size in wave and wasp mutant embryos. Dot plot showing the F-actin foci size per embryo. The foci size in n=5 embryos were quantified for each genotype. In (B) and (G), each data point represents the mean value of an embryo. Mean ± s.d. values are shown in the dot plot, and significance was determined by the unpaired parametric t test. *** p < 0.001. See also Figures S3, S4, and S5.
Figure 7.
Figure 7.. Myomaker and Myomixer are not required for F-actin foci formation but converge with the F-actin foci to induce myoblast fusion.
(A-C) F-actin foci were present in myomaker−/− and myomixer−/− mutant embryos. Confocal images of 23-somite stage wild-type (A), myomaker−/− (B), and myomixer−/− (C) mutant embryos. Arrowheads indicate a few randomly selected foci. Scale bar, 25 μm. (D) A graph showing the average F-actin foci number in each somite of fixed wild-type, myomaker−/− and myomixer−/− mutant embryos. Data are represented as mean ± s.d. Statistical analysis was performed for the foci number in somite 9 of n=6 embryos using the unpaired parametric t test. *** p < 0.001. (E and F) Quantification of lifespan (E) and size (F) of the F-actin foci in myomaker−/− and myomixer−/− mutant embryos. The lifespan and size of the foci were recorded by live imaging. Each data point represents the mean value of an embryo. Mean ± s.d. values are shown in the dot plot, and significance was determined by the unpaired parametric t test. * p < 0.05; *** p < 0.001. (G and H) Confocal images showing two examples of invasive F-actin foci (arrows) in myomaker−/− (G) and myomixer−/− (H) mutant embryos, respectively. Plasma membrane (green) and nuclei (green) were labelled by Lyn-EGFP and H2B-EGFP, respectively. F-actin (red) was labelled by the transgene Tg(CMV:Lifeact-mCherry). Scale bar, 10 μm. (I) Confocal images of subcellular localization of mCherry-Myomixer in a 23-somite stage wild-type embryo. Two areas containing F-actin foci are shown. F-actin was visualized by Tg(CMV:Lifeact-EGFP), although not all muscle cells expressed Lifeact-EGFP. Arrowheads point to a few Myomixer punctae associated with the F-actin foci. Scale bar, 10 μm. (J) A model describing the molecular and cellular events at the zebrafish fusogenic synapse. The heterophilic interactions between Jam2a and Jam3b lead to the formation of an F-actin-enriched structure organized by Jam2a. The F-actin structure propels invasive membrane protrusions into the neighboring cell to promote close plasma membrane juxtaposition, whereas the fusogenic proteins (e.g. Myomixer) form microclusters throughout the plasma membrane and in the cytosol (the latter is not depicted). The convergence between the fusogen microclusters and the invasive protrusions will lead to fusion pore formation and membrane merger. See also Video S7 and S8.

Similar articles

Cited by

References

    1. Abmayr SM, Balagopalan L, Galletta BJ, and Hong SJ (2003). Cell and molecular biology of myoblast fusion. Int. Rev. Cytol 225, 33–89. - PubMed
    1. Aguilar PS, Baylies MK, Fleissner A, Helming L, Inoue N, Podbilewicz B, Wang H, and Wong M. (2013). Genetic basis of cell-cell fusion mechanisms. Trends Genet. 29, 427–437. - PMC - PubMed
    1. Artero RD, Castanon I, and Baylies MK (2001). The immunoglobulin-like protein Hibris functions as a dose-dependent regulator of myoblast fusion and is differentially controlled by Ras and Notch signaling. Development 128, 4251–4264. - PubMed
    1. Baas D., Caussanel-Boude S., Guiraud A., Calhabeu F., Delaune E., Pilot F., Chopin E., Machuca-Gayet I., Vernay A., Bertrand S., et al.. (2012). CKIP-1 regulates mammalian and zebrafish myoblast fusion. J. Cell Sci 125, 3790–3800. - PubMed
    1. Bi P, Ramirez-Martinez A, Li H, Cannavino J, McAnally JR, Shelton JM, Sanchez-Ortiz E, Bassel-Duby R, and Olson EN (2017). Control of muscle formation by the fusogenic micropeptide myomixer. Science 356, 323–327. - PMC - PubMed

Publication types

LinkOut - more resources