. 2022 Jun 1;36(11-12):664-683.
doi: 10.1101/gad.348982.121. Epub 2022 Jun 16.

Recurrent chromosomal translocations in sarcomas create a megacomplex that mislocalizes NuA4/TIP60 to Polycomb target loci

Affiliations

Recurrent chromosomal translocations in sarcomas create a megacomplex that mislocalizes NuA4/TIP60 to Polycomb target loci

Deepthi Sudarshan et al. Genes Dev. .

Abstract

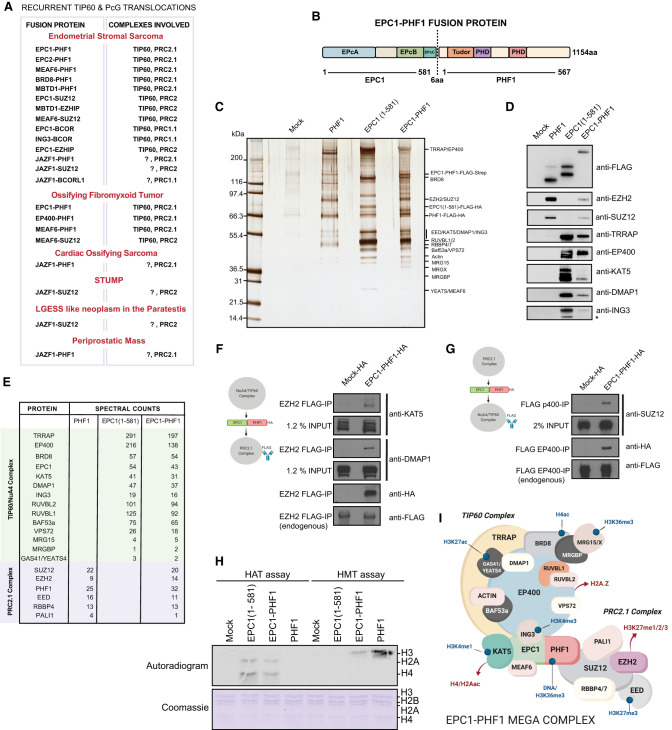
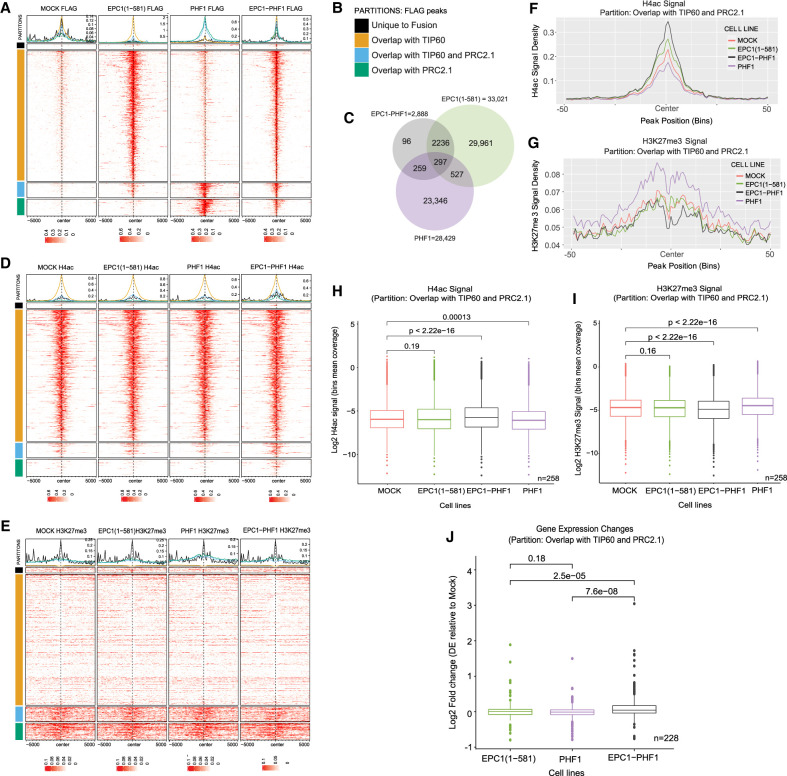
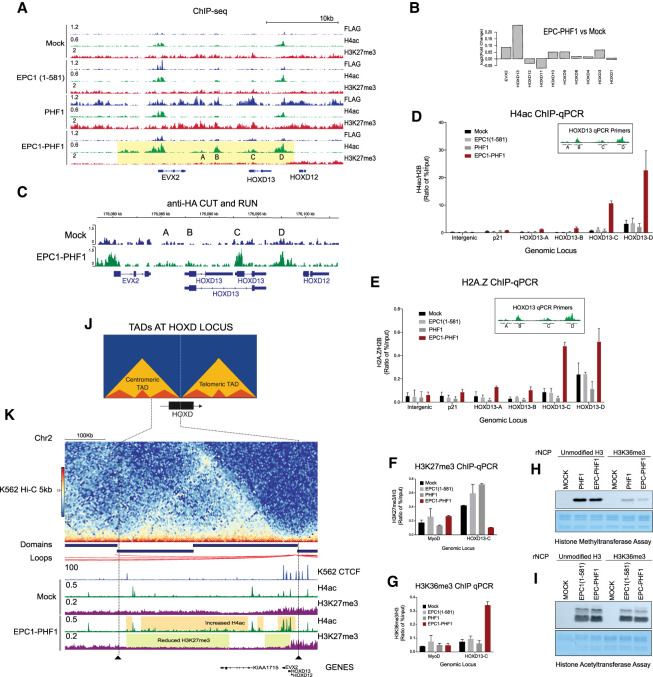
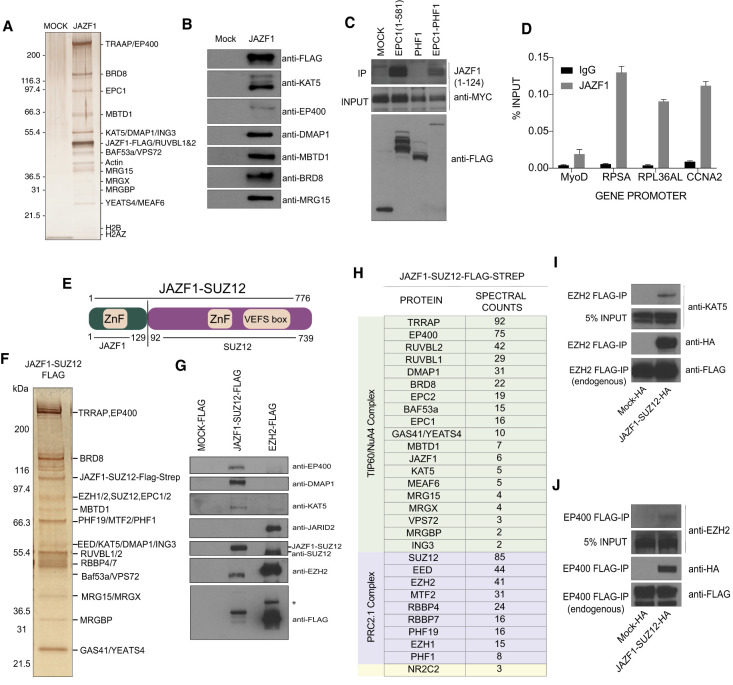
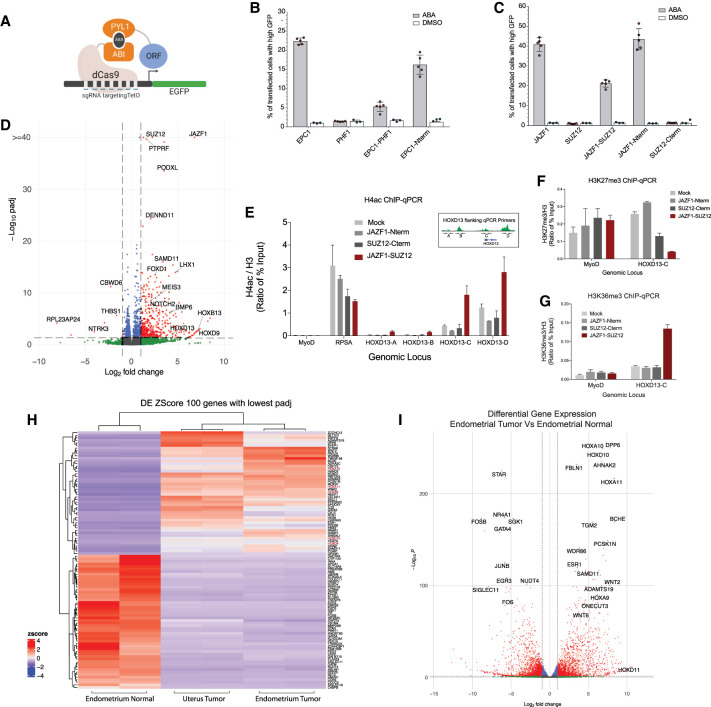
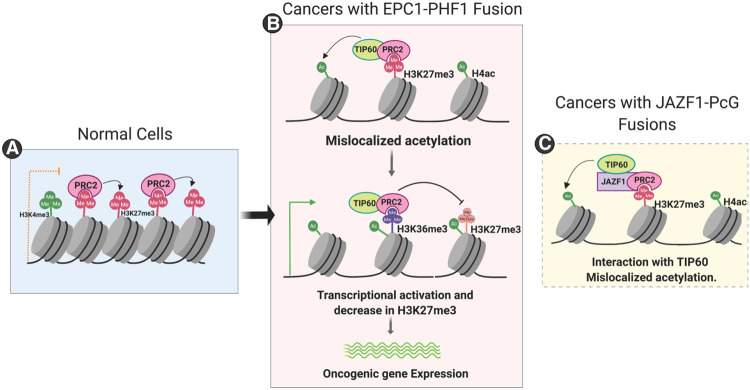
Chromosomal translocations frequently promote carcinogenesis by producing gain-of-function fusion proteins. Recent studies have identified highly recurrent chromosomal translocations in patients with endometrial stromal sarcomas (ESSs) and ossifying fibromyxoid tumors (OFMTs), leading to an in-frame fusion of PHF1 (PCL1) to six different subunits of the NuA4/TIP60 complex. While NuA4/TIP60 is a coactivator that acetylates chromatin and loads the H2A.Z histone variant, PHF1 is part of the Polycomb repressive complex 2 (PRC2) linked to transcriptional repression of key developmental genes through methylation of histone H3 on lysine 27. In this study, we characterize the fusion protein produced by the EPC1-PHF1 translocation. The chimeric protein assembles a megacomplex harboring both NuA4/TIP60 and PRC2 activities and leads to mislocalization of chromatin marks in the genome, in particular over an entire topologically associating domain including part of the HOXD cluster. This is linked to aberrant gene expression-most notably increased expression of PRC2 target genes. Furthermore, we show that JAZF1-implicated with a PRC2 component in the most frequent translocation in ESSs, JAZF1-SUZ12-is a potent transcription activator that physically associates with NuA4/TIP60, its fusion creating outcomes similar to those of EPC1-PHF1 Importantly, the specific increased expression of PRC2 targets/HOX genes was also confirmed with ESS patient samples. Altogether, these results indicate that most chromosomal translocations linked to these sarcomas use the same molecular oncogenic mechanism through a physical merge of NuA4/TIP60 and PRC2 complexes, leading to mislocalization of histone marks and aberrant Polycomb target gene expression.

Keywords: EPC1; H3K27 methylation; H4 acetylation; HOXD; JAZF1; NuA4; PHF1; PRC2; SUZ12; TIP60.


Figures

Figure 1.
Figure 1.
The EPC1-PHF1 fusion protein assembles a megacomplex merging NuA4/TIP60 and PRC2 complexes and their activities. (A) Table summarizing recurrent translocations found in soft tissue sarcomas that fuse NuA4/TIP60 complex proteins and Polycomb group proteins. (B) Schematic representation of the EPC1-PHF1 fusion protein. The numbers indicated are amino acids; protein domains retained in the fusion are indicated. (C) Silver-stained SDS-PAGE showing affinity-purified complexes. Labels at the right are proteins that were identified based on Western blotting and predicted molecular weights. (D) Western blots of selected NuA4/TIP60 and PRC2 complex subunits on the affinity-purified complexes shown in C. (E) Mass spectrometry analysis of the affinity-purified complexes shown in C. See also Supplemental Figure S2, A and B. (F,G) Affinity purification of endogenous PRC2 complex (EZH2 subunit) (F) and NuA4/TIP60 (EP400 subunit) (G), confirming formation of a merged megacomplex by EPC1-PHF1. (H) In vitro histone acetyltransferase (HAT) assay and histone methyltransferase (HMT) assay. (Top panel, lanes 2,3) KAT5 purified through EPC1(1–581) as well as EPC1-PHF1 fusion show HAT activity toward H2A and H4 on chromatin. (Top panel, lanes 7,8) EZH2 purified through PHF1 as well as EPC1-PHF1 fusion show HMT activity toward H3 on chromatin. Coomassie-stained SDS-PAGE gel was the loading control for nucleosomal histones. See also Supplemental Figure S2, C and D. (I) Schematic representation of the chimeric megacomplex assembled by the EPC1-PHF1 fusion protein.
Figure 2.
Figure 2.
The EPC1-PHF1 fusion complex induces global changes in histone marks and gene expression. (A) Enrichment of FLAG ChIP-seq signal in K562 cell lines. The heat maps show regions bound by EPC1-PHF1 (± 5000 bp to peak center), partitioned based on overlap with EPC1(1–581) and/or PHF1 FLAG peaks. (B) Partitions used for heat maps in A, D, and E. (TIP60) EPC1(1–581), (PRC2.1) PHF1. (C) Venn diagram showing the number FLAG ChIP-seq peaks and overlap between EPC1(1–581)-, PHF1-, and EPC1-PHF1-expressing K562 cell lines. (D) Enrichment of H4-penta-acetyl ChIP-seq signal at regions bound by EPC1-PHF1, partitioned based on overlap with EPC1(1–581) and/or PHF1 FLAG peaks. (E) Enrichment of H3K27me3 ChIP-seq signal in K562 cell lines at regions bound by EPC1-PHF1, partitioned based on overlap with EPC1(1–581) and/or PHF1 FLAG peaks. (F) Density plot of H4ac enrichment in K562 cell lines in a particular partition (EPC1-PHF1-bound regions and overlap with TIP60 and PRC2.1). Each bin corresponds to 100 bp. See Supplemental Figure S3 for other partitions. (G) Density plot of H3K27me3 enrichment in K562 cell lines in a particular partition (EPC1-PHF1-bound regions and overlap with TIP60 and PRC2.1). See Supplemental Figure S3 for other partitions. (H) Box plots showing H4ac enrichment level in K562 cell lines in a particular partition (EPC1-PHF1-bound regions and overlap with TIP60 and PRC2.1). See Supplemental Figure S3 for other partitions. Statistics were computed using bins; n = number of regions analyzed, where one region is 100 bins and the mean coverage over these 100 bins was used. P-value was calculated by Wilcoxon testing. (I) Box plots showing H3K27me3 enrichment level in K562 cell lines in a particular partition (EPC1-PHF1-bound regions and overlap with TIP60 and PRC2.1). See Supplemental Figure S3 for other partitions. Statistics were computed using bins; n = number of regions analyzed, where one region is 100 bins and the mean coverage over these 100 bins was used. P-value was calculated by Wilcoxon testing. (J) Gene expression changes at genes bound by EPC1-PHF1 in a particular partition (EPC1-PHF1-bound regions and overlap with TIP60 and PRC2.1). See Supplemental Figure S4 for other partitions. P-value was calculated by Wilcoxon testing.
Figure 3.
Figure 3.
EPC1-PHF1 induces changes in the chromatin landscape at the HOX gene clusters. (A) Representative ChIP-seq peaks at the HOXD gene cluster; the highlighted region in yellow shows H4 acetylation mislocalization (at regions labeled HOXD13-A, HOXD13-B, HOXD13-C, and HOXD13-D) and a reduction in H3K27me3 in the EPC1-PHF1-expressing K562 cell line. See Supplemental Figure S7 for similar effects at the other HOX clusters and Supplemental Figure S6D for similar effects in other genes. (B) Gene expression changes at the HOXD cluster in K562 cells expressing EPC1-PHF1 compared with cells expressing tag only (mock). See Supplemental Figure S4A for genome-wide gene expression changes. (C) Confirmation of EPC1-PHF1 localization at HOXD13 by anti-HA CUT&RUN sequencing. Representative peaks at the HOXD13 gene. See Supplemental Figure S5 for in-depth analysis. (D) Mislocalization of H4 acetylation determined by ChIP-qPCR. The EPC1-PHF1-expressing K562 cell line (bar graph colored maroon) shows increased H4 acetylation compared with control cell lines at HOXD13-A, HOXD13-B, HOXD13-C, and HOXD13-D regions, validating the results of ChIP-seq in A. Values are a ratio of percentage input of H4ac and H2B (n = 2). Error bars are range of the values. Intergenic (chromosome 12: 65,815,182–65,815,318) and p21 promoter are negative controls. (E) Mislocalization of variant histone H2A.Z determined by ChIP-qPCR. The EPC1-PHF1-expressing K562 cell line (bar graph colored maroon) shows increased H2A.Z occupancy compared with control cell lines at regions of H4 acetylation mislocalization (HOXD13-A, HOXD13-B, HOXD13-C, and HOXD13-D) shown in A. Values are a ratio of percentage input of H4ac and H2B. (n = 2). Error bars are range of the values. Intergenic (chroromosome12: 65,815,182–65,815,318) and p21 promoter are negative controls. (F,G) A decrease in H3K27me3 levels correlates with an increase in H3K36me3. (F) ChIP-qPCR with H3K27me3 antibody shows decreased level at the HOXD13-C region (gene body) only in the EPC1-PHF1-expressing K562 cell line (bar graph colored maroon), validating our ChIP-seq results in A. (G) ChIP-qPCR with H3K36me3 antibody shows increased level at the HOXD13-C region (gene body) only in the EPC1-PHF1-expressing K562 cell line (bar graph colored maroon). MyoD promoter is used as a negative control. Values are a ratio of percentage input of H4ac and H2B (n = 2). Error bars are range of the values. See also Supplemental Figure S6, B and C. (H,I) The H3K27me3 activity of EPC1-PHF1 is inhibited by the presence of H3K36me3. In vitro histone methyltransferase assay and histone acetyltransferase assay on recombinant nucleosomes (rNCP) with or without H3K36me3. Purified complexes were normalized using Western blotting for EZH2 and KAT5 (Supplemental Fig. S6E,F). Coomassie-stained SDS-PAGE gel is the loading control for recombinant nucleosomes. (J) Schematic representation of the topologically associated domains (TADs) and subdomains at the HOXD locus in mammalian cells. (K) Alignment of Hi-C data in K562 cells (Rao et al. 2014) with CTCF ChIP-seq in K562 cells (ENCODE group/Broad Institute histone marks) and ChIP-seq from this study (Fig. 4A). Highlighted regions indicate histone modification changes confined to a topological domain in the EPC1-PHF1-expressing cell line compared with the tag-only-expressing cell line (mock). See also Supplemental Figure S7.
Figure 4.
Figure 4.
The JAZF1 protein stably associates with the NuA4/TIP60 complex. (A) Silver-stained SDS-PAGE showing tandem affinity-purified JAZF1. Labels at the right are proteins that were identified based on Western blotting and predicted molecular weights. The JAZF1 fraction shows all subunits of the NuA4/TIP60 complex. See also Supplemental Figure S8, C and D, for mass spectrometry analysis of JAZF1 purification from HEK293 and K562 cells, respectively. (B) Western blots of selected NuA4/TIP60 subunits on the affinity-purified fraction shown in A. (C) Immunoprecipitation of JAZF1 with the EPC1-PHF1 fusion. JAZF1(1–124) corresponding to the portion in the JAZF1-SUZ12 fusion protein that interacts with EPC1(1–581) and EPC1-PHF1. See Supplemental Figure S8E for data with full-length JAZF1 construct. (D) FLAG-JAZF1 ChIP-qPCR. Anti-FLAG ChIP-qPCR in HEK293 cells stably expressing FLAG-tagged JAZF1. Enrichment of JAZF1 can be seen at ribosomal protein gene promoters (RPSA and RPL36AL) regulated by NuA4/TIP60. CCNA2 is a positive control for JAZF1. Values are represented as percentage IP/input chromatin (n = 2). Error bars represent range of the values. (E) Schematic representation of the JAZF1-SUZ12 fusion protein. The numbers indicate are amino acids; protein domains retained in the fusion are indicated. (F) Silver-stained SDS-PAGE showing tandem affinity-purified JAZF1-SUZ12. Labels at the right are proteins that were identified based on Western blotting and predicted molecular weights. (G) Western blots of selected NuA4/TIP60 and PRC2 subunits on the affinity-purified fraction shown in F. Note the absence of JARID2 in the JAZF1-SUZ12 complex. (H) Mass spectrometry analysis of the affinity-purified JAZF1-SUZ12 complex shown in F. Note the absence of JARID2 and the presence of the three Polycomb-like paralogs PHF1, MTF2, and PHF19, identifying PRC2.1. (I,J) Formation of a TIP60-PRC2 megacomplex by JAZF1-SUZ12. (I) Immunoprecipitation of endogenously tagged EZH2. Tip60 can be detected only in the JAZF1-SUZ12-expressing cells. (J) Immunoprecipitation of endogenously tagged EP400. EZH2 can be detected only in the JAZF1-SUZ12-expressing cells.
Figure 5.
Figure 5.
The JAZF1-SUZ12 fusion protein has molecular impacts like EPC1-PHF1. (A) Model for the dCas9-based inducible reporter gene activation assay in B and C. (B,C) The transcription activation assay was quantified by flow cytometry analysis. (B) The percentage of cells transfected with EPC1, PHF1, EPC1-PHF1, or EPC1(1–581) expressing high GFP upon ABA treatment. EPC1-PHF1 is a transcriptional activator like EPC1 and EPC1 N terminus, whereas PHF1 is not. (C) The percentage of cells expressing high GFP when transfected with JAZF1, SUZ12, JAZF1-SUZ12, JAZF1(1–129), and SUZ12(93–740) and treated with ABA. JAZF1 (full length and N terminus) and JAZF1-SUZ12 act as transcriptional activators, whereas SUZ12 does not. At least 25,000 cells were analyzed for each replicate. Error bars represent SEM of five independent repeats. DMSO is used as a negative control. (D) Volcano plot of differential gene expression analysis of K562 cell line expressing JAZF1-SUZ12 fusion compared with an empty vector K562 cell line. (E) Mislocalization of H4 acetylation determined by ChIP-qPCR. The JAZF1-SUZ12-expressing K562 cell line (bar graph colored maroon) shows increased H4 acetylation compared with control cell lines at HOXD13-A, HOXD13-B, HOXD13-C, and HOXD13-D regions, like EPC1-PHF1 in Figure 4C. Values are represented as ratio of percentage of input chromatin of H4ac and H3 (n = 2). Error bars represent range of the values. RPSA promoter is a positive control for H4 acetylation, and MYOD promoter is a negative control. (F,G) A decrease in H3K27me3 levels at the HOXD locus correlates with increased H3K36me3 in JAZF1-SUZ12-expressing cells. (F) ChIP-qPCR with H3K27me3 antibody shows decreased level at the HOXD13-C region (gene body) in the JAZF1-SUZ12-expressing K562 cell line (bar graph colored maroon). MyoD promoter is a negative control. (G) ChIP-qPCR with H3K36me3 antibody shows increased level at the HOXD13-C region (gene body) only in the JAZF1-SUZ12-expressing K562 cell line (bar graph colored maroon). MyoD promoter is a negative control. Values are represented as ratio of percentage of input chromatin of H3K27me3 or H3K36me3 and H3 (n = 2). Error bars represent range of the values. See also Supplemental Figure S9, D and E. (H,I) RNA sequencing followed by differential gene expression analysis of two low-grade endometrial stromal sarcoma patient tissue samples with the presence of JAZF1-SUZ12 fusion. Pair-wise comparison was performed versus endometrial normal patient tissue (paired normal of endometrial tumor sample). (H) Heat map showing hierarchical clustering of the top 100 differentially expressed genes. (I) Volcano plot of differential gene expression analysis of endometrial tumor with JAZF1-SUZ12 fusion compared with adjacent normal endometrial tissue. See also Supplemental Figures S11 and S12.
Figure 6.
Figure 6.
Model for the oncogenic mechanism of EPC1-PHF1 fusion protein in soft tissue sarcomas. (A) In normal cells, the PRC2 complex occupies repressed or poised chromatin. (B) When EPC1-PHF1 fusion protein is expressed, it assembles a megacomplex combining NuA4/TIP60 and PRC2 complexes. The megacomplex occupies regions that have activating and repressive histone marks (such as the HOX clusters in K562) and mislocalizes NuA4/TIP60 activities (H4, H2A acetylation, and H2A.Z exchange). This tips the balance toward transcriptional activation. Levels of the transcription elongation-associated histone mark H3K36me3 increase and inhibit the deposition of the repressive H3K27me3 histone mark. Thus, the changes in chromatin landscape potentiate the expression of oncogenes. (C) Sarcomas with fusions of JAZF1 and PcG proteins also use a similar mechanism, since JAZF1 strongly interacts with the NuA4/TIP60 complex and mislocalizes its activities.

Similar articles

Cited by

References

    1. Alerasool N, Leng H, Lin ZY, Gingras AC, Taipale M. 2022. Identification and functional characterization of transcriptional activators in human cells. Mol Cell 82: 677–695.e7. 10.1016/j.molcel.2021.12.008 - DOI - PubMed
    1. Allen AJ, Ali SM, Gowen K, Elvin JA, Pejovic T. 2017. A recurrent endometrial stromal sarcoma harbors the novel fusion JAZF1-BCORL1. Gynecol Oncol Rep 20: 51–53. 10.1016/j.gore.2017.03.002 - DOI - PMC - PubMed
    1. Andrews S. 2010. FastQC: a quality control tool for high throughput sequence data.
    1. Andrey G, Montavon T, Mascrez B, Gonzalez F, Noordermeer D, Leleu M, Trono D, Spitz F, Duboule D. 2013. A switch between topological domains underlies HoxD genes collinearity in mouse limbs. Science 340: 1234167. 10.1126/science.1234167 - DOI - PubMed
    1. Antonescu CR, Sung YS, Chen CL, Zhang L, Chen HW, Singer S, Agaram NP, Sboner A, Fletcher CD. 2014. Novel ZC3H7B-BCOR, MEAF6-PHF1, and EPC1-PHF1 fusions in ossifying fibromyxoid tumors—molecular characterization shows genetic overlap with endometrial stromal sarcoma. Genes Chromosomes Cancer 53: 183–193. 10.1002/gcc.22132 - DOI - PMC - PubMed

Publication types

MeSH terms

Grants and funding