

Salivary, serological, and cellular immune response to the CoronaVac vaccine in health care workers with or without previous COVID-19
- PMID: 35710573
- PMCID: PMC9202665
- DOI: 10.1038/s41598-022-14283-x
Salivary, serological, and cellular immune response to the CoronaVac vaccine in health care workers with or without previous COVID-19
Abstract
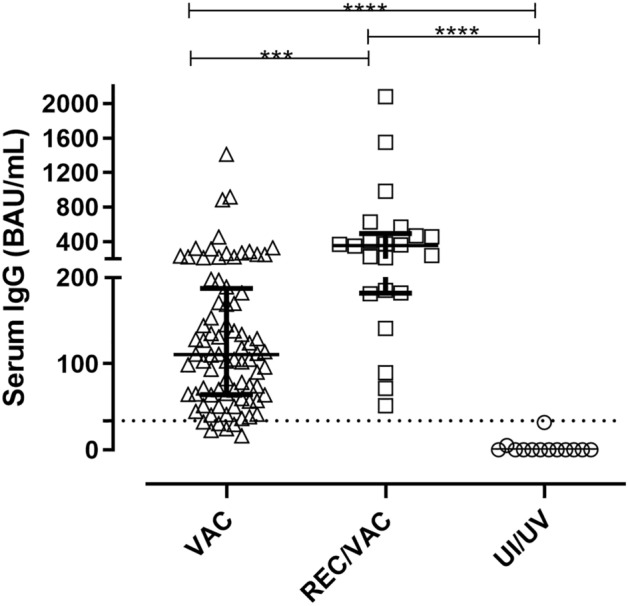
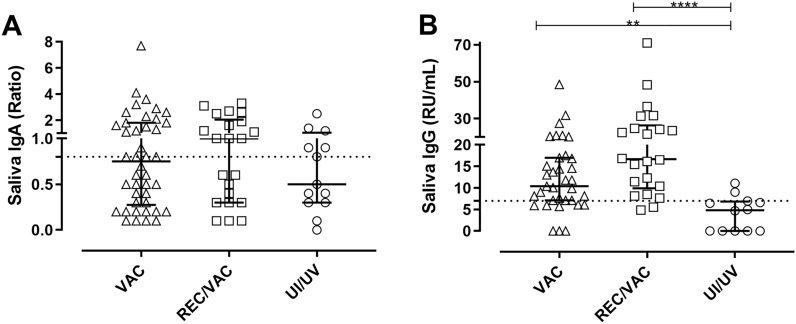
We investigated the anti-SARS-CoV-2 post-vaccine response through serum and salivary antibodies, serum antibody neutralizing activity and cellular immune response in samples from health care workers who were immunized with two doses of an inactivated virus-based vaccine (CoronaVac) who had or did not have COVID-19 previously. IgA and IgG antibodies directed at the spike protein were analysed in samples of saliva and/or serum by ELISA and/or chemiluminescence assays; the neutralizing activity of serum antibodies against reference strain B, Gamma and Delta SARS-CoV-2 variants were evaluated using a virus neutralization test and SARS-CoV-2 reactive interferon-gamma T-cell were analysed by flow cytometry. CoronaVac was able to induce serum and salivary IgG anti-spike antibodies and IFN-γ producing T cells in most individuals who had recovered from COVID-19 and/or were vaccinated. Virus neutralizing activity was observed against the ancestral strain, with a reduced response against the variants. Vaccinated individuals who had previous COVID-19 presented higher responses than vaccinated individuals for all variables analysed. Our study provides evidence that the CoronaVac vaccine was able to induce the production of specific serum and saliva antibodies, serum virus neutralizing activity and cellular immune response, which were increased in previously COVID-19-infected individuals compared to uninfected individuals.
© 2022. The Author(s).
Conflict of interest statement
The authors declare no competing interests.
Figures


Similar articles
-
Recognition of Variants of Concern by Antibodies and T Cells Induced by a SARS-CoV-2 Inactivated Vaccine.Front Immunol. 2021 Nov 9;12:747830. doi: 10.3389/fimmu.2021.747830. eCollection 2021. Front Immunol. 2021. PMID: 34858404 Free PMC article. Clinical Trial.
-
[Investigation of SARS-CoV-2-Specific Humoral and Cellular Immunity Values in Health Care Workers with COVID-19 Disease and Administered with COVID-19 Vaccine].Mikrobiyol Bul. 2022 Jul;56(3):480-492. doi: 10.5578/mb.20229708. Mikrobiyol Bul. 2022. PMID: 35960239 Turkish.
-
Inactivated Vaccine-Induced SARS-CoV-2 Variant-Specific Immunity in Children.mBio. 2022 Dec 20;13(6):e0131122. doi: 10.1128/mbio.01311-22. Epub 2022 Nov 16. mBio. 2022. PMID: 36383021 Free PMC article.
-
The kinetics of IgG subclasses and contributions to neutralizing activity against SARS-CoV-2 wild-type strain and variants in healthy adults immunized with inactivated vaccine.Immunology. 2022 Oct;167(2):221-232. doi: 10.1111/imm.13531. Epub 2022 Jul 6. Immunology. 2022. PMID: 35751471 Free PMC article.
-
Status of Humoral and Cellular Immune Responses within 12 Months following CoronaVac Vaccination against COVID-19.mBio. 2022 Jun 28;13(3):e0018122. doi: 10.1128/mbio.00181-22. Epub 2022 Apr 27. mBio. 2022. PMID: 35475648 Free PMC article.
Cited by
-
Self-collection of capillary blood and saliva to determine COVID-19 vaccine immunogenicity in patients with immune-mediated inflammatory diseases and health professionals.Front Public Health. 2022 Oct 14;10:994770. doi: 10.3389/fpubh.2022.994770. eCollection 2022. Front Public Health. 2022. PMID: 36311633 Free PMC article.
-
Methodological approaches to optimize multiplex oral fluid SARS-CoV-2 IgG assay performance and correlation with serologic and neutralizing antibody responses.medRxiv [Preprint]. 2022 Dec 26:2022.12.22.22283858. doi: 10.1101/2022.12.22.22283858. medRxiv. 2022. Update in: J Immunol Methods. 2023 Mar;514:113440. doi: 10.1016/j.jim.2023.113440. PMID: 36597525 Free PMC article. Updated. Preprint.
-
The impact of vaccine type and booster dose on the magnitude and breadth of SARS-CoV-2-specific systemic and mucosal antibodies among COVID-19 vaccine recipients.Heliyon. 2024 Jul 26;10(15):e35334. doi: 10.1016/j.heliyon.2024.e35334. eCollection 2024 Aug 15. Heliyon. 2024. PMID: 39166006 Free PMC article.
-
Humoral immunity against SARS-CoV-2 evoked by heterologous vaccination groups using the CoronaVac (Sinovac) and BNT162b2 (Pfizer/BioNTech) vaccines in Chile.Front Public Health. 2023 Aug 24;11:1229045. doi: 10.3389/fpubh.2023.1229045. eCollection 2023. Front Public Health. 2023. PMID: 37693706 Free PMC article.
-
Human memory T cell dynamics after aluminum-adjuvanted inactivated whole-virion SARS-CoV-2 vaccination.Sci Rep. 2023 Mar 21;13(1):4610. doi: 10.1038/s41598-023-31347-8. Sci Rep. 2023. PMID: 36944716 Free PMC article. Clinical Trial.
References
-
- Centre for Health Protection of the Hong Kong Special Administrative Region Government. CHP Closely Monitors Cluster of Pneumonia Cases on Mainland (2019). https://www.info.gov.hk/gia/general/201912/31/P2019123100667.htm (Accessed 03 January 2022).
Publication types
MeSH terms
Substances
Supplementary concepts
LinkOut - more resources
Full Text Sources
Medical
Miscellaneous
