. 2022 Jun 16;12(1):10080.
doi: 10.1038/s41598-022-14268-w.

Ketone body 3-hydroxybutyrate enhances adipocyte function

Affiliations

Ketone body 3-hydroxybutyrate enhances adipocyte function

Shigeki Nishitani et al. Sci Rep. .

Abstract

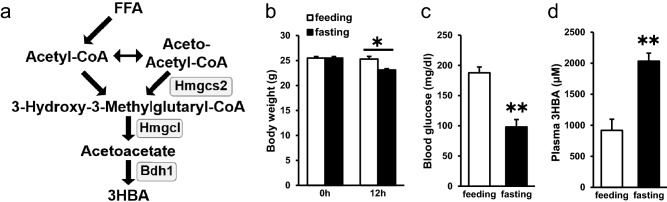
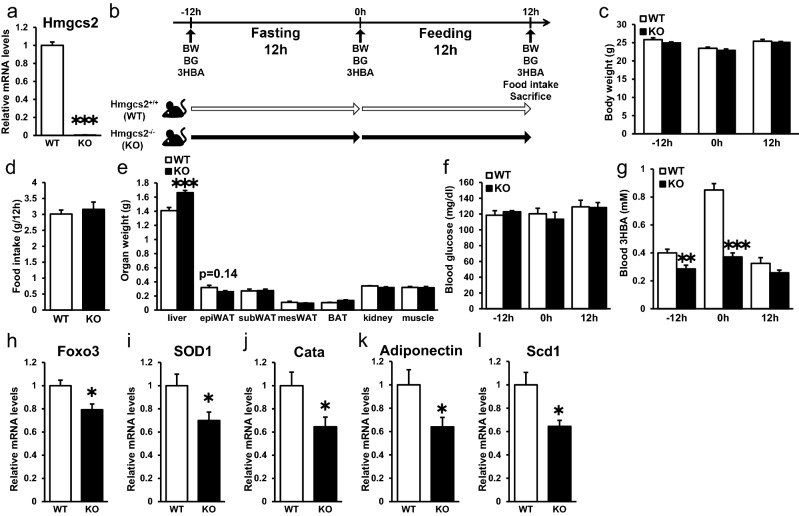
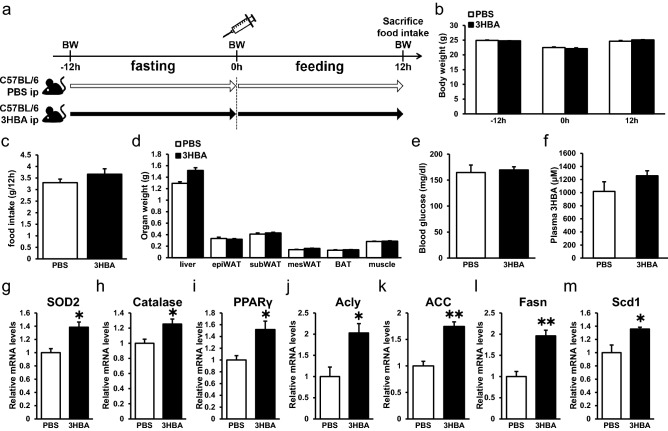
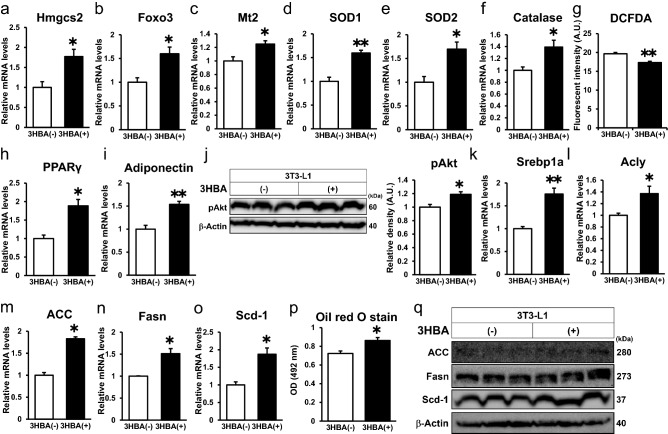
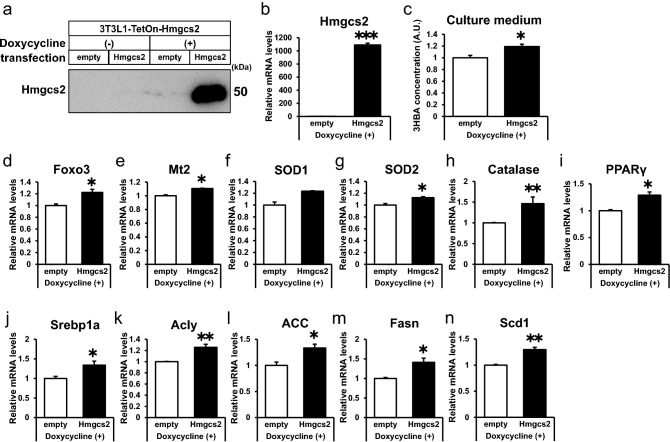
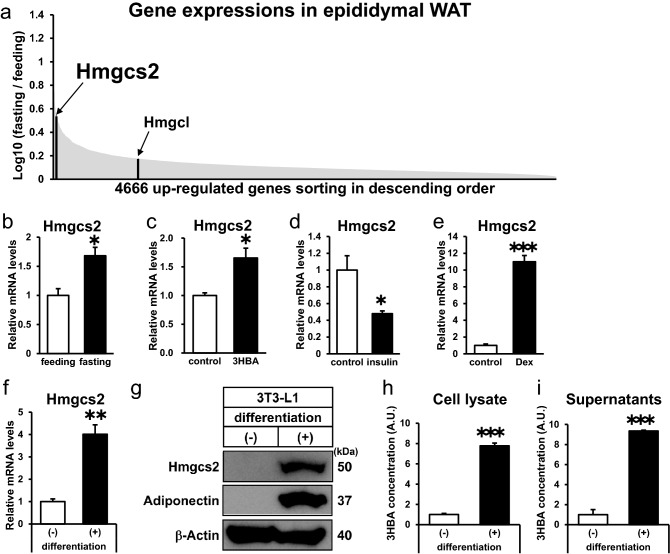
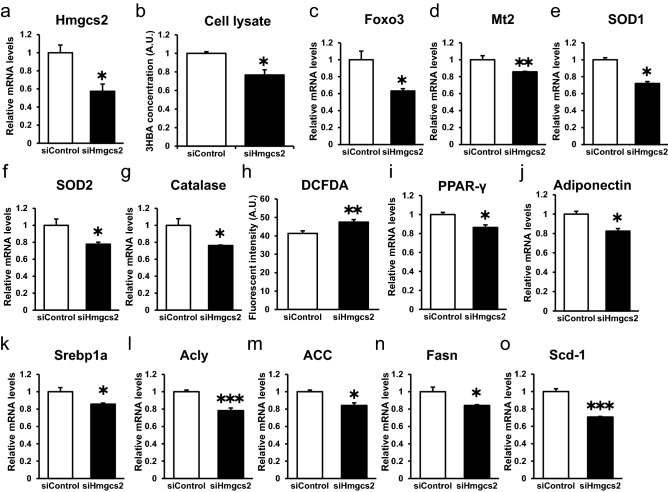
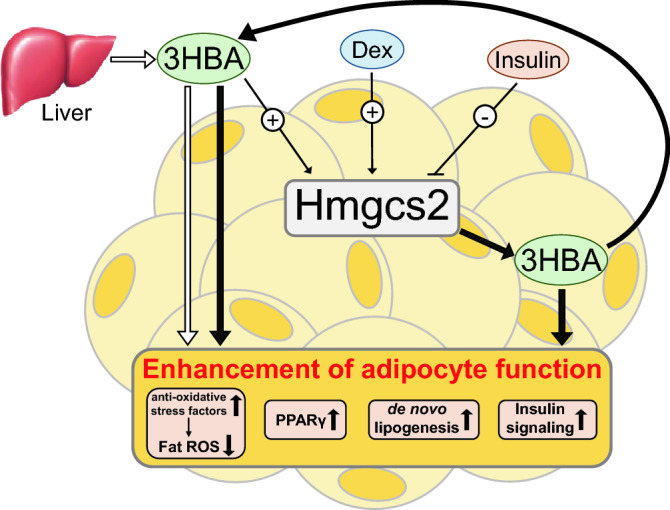
Ketone bodies, including 3HBA, are endogenous products of fatty acid oxidation, and Hmgcs2 is the first rate-limiting enzyme of ketogenesis. From database analysis and in vivo and in vitro experiments, we found that adipose tissue and adipocytes express Hmgcs2, and that adipocytes produce and secrete 3HBA. Treatment with 3HBA enhanced the gene expression levels of the antioxidative stress factors, PPARγ, and lipogenic factors in adipose tissue in vivo and in adipocytes in vitro, accompanied by reduced ROS levels. Knockdown of endogenous Hmgcs2 in adipocytes markedly decreased 3HBA levels in adipocytes and decreased the gene expression levels of the antioxidative stress factors, PPARγ, and lipogenic factors with increased ROS levels. Conversely, overexpression of Hmgcs2 in adipocytes increased 3HBA secretion from adipocytes and enhanced the gene expression levels of the antioxidative stress factors, PPARγ, and lipogenic factors. These results demonstrate that 3HBA plays significant roles in enhancing the physiological function of adipocytes.


Conflict of interest statement

S.N. belongs to the endowed department by KUBARA HONKE Co., Ltd., and A.F. belongs to the endowed department by Takeda Pharmaceutical Company, Rohto Pharmaceutical Co., Ltd., Sanwa Kagaku Kenkyusho Co., Ltd., FUJI OIL HOLDINGS INC., and Kobayashi Pharmaceutical Co., Ltd. The funders had no role in the study design, data collection and analysis, decision to publish, or preparation of the manuscript. All other authors have no conflicts to declare.

Figures

Figure 1
Figure 1
Ketone body 3HBA was physiologically regulated. (a) Schematic representation of ketone body metabolism. FFA, free fatty acid; Hmgcs2, 3-hydroxy-3-methylglutaryl-CoA synthetase; Hmgcl, 3-hydroxy-3-methylglutaryl-CoA lyase; Bdh1, β-hydroxybutyrate dehydrogenase; 3HBA, 3-hydroxybutyric acid. (b) Body weight of C57BL/6 J mice in the feeding and fasting groups at the beginning (0 h) and end (12 h) of the experiment. n = 3. (c and d) Blood glucose (c) and plasma 3HBA concentrations (d) of C57BL/6 J mice after 12 h of feeding and fasting. n = 3. Data are mean ± SEM. *p < 0.05, **p < 0.01.
Figure 2
Figure 2
Systemic Hmgcs2 knockout mice showed decreased circulating 3HBA and gene expression levels of Foxo3, SOD1, Cata, Adiponectin, and Scd1 in adipose tissue. (a) qRT–PCR of Hmgcs2 in epididymal adipose tissue from Hmgcs2+/+ (WT) and Hmgcs2−/− (KO) mice at 12 h postfeeding. WT = 8, KO = 7. (b) Schematic diagram of fasting and feeding subjected to WT and KO mice, including timeline for measurement of body weight, blood glucose, blood 3HBA, food intake, and sacrifice. (c) Body weight of WT and KO mice prefasting (− 12 h), postfasting (0 h), and postfeeding (12 h). WT = 8, KO = 7. (d and e) Food intake (d) and organ weight (e) of WT and KO mice at 12 h postfeeding. WT = 8, KO = 7. (f and g) Blood glucose (f) and blood 3HBA concentration (g) of WT and KO mice prefasting (− 12 h), postfasting (0 h), and postfeeding (12 h). WT = 8, KO = 7. (hl) qRT–PCR of antioxidative stress factors, such as Foxo (h), SOD1 (i), and Catalase (j), adiponectin (k), and lipogenic factors, such as Scd1 (l), in epididymal adipose tissue from WT and KO mice at 12 h postfeeding. WT = 8, KO = 7. Data are mean ± SEM. *p < 0.05, **p < 0.01, ***p < 0.001.
Figure 3
Figure 3
3HBA enhances the gene expression levels of antioxidative stress factors, PPARγ, and lipogenic factors in vivo. (a) Schematic diagram of injection of 3HBA into C57BL/6 J male mice, including timeline for measurement of body weight and food intake, intraperitoneal injection of PBS or 3HBA, and sacrifice. (b) Body weight of PBS- and 3HBA-injected mice prefasting (− 12 h), postfasting (0 h), and postfeeding (12 h). n = 3. (cf) Food intake (c), organ weight (d), blood glucose (e), and plasma 3HBA concentration (f) of PBS- and 3HBA-injected mice at 12 h postfeeding. n = 3. (gm) qRT–PCR of antioxidative stress factors, such as SOD2 (g) and Catalase (h), PPARγ (i), and lipogenic factors, such as Acly (j), ACC (k), Fasn (l), and Scd1 (m), in epididymal adipose tissue from PBS- and 3HBA-injected mice at 12 h postfeeding. n = 3. Data are mean ± SEM. *p < 0.05, **p < 0.01.
Figure 4
Figure 4
3HBA exerts beneficial effects on adipocytes by reducing ROS levels via augmentation of antioxidative stress factors and inducing PPARγ, insulin signaling, and lipogenic factors in vitro. On day 7 after 3T3-L1 adipocytes were differentiated, the 3T3-L1 adipocytes were maintained in serum-free DMEM composed of 2.5 mM glucose and 0 mM or 10 mM 3HBA for 24 h. On day 8 after differentiation, the 3T3-L1 adipocytes were additively stimulated with 1 nM insulin for 24 h, followed by harvesting on day 9 after differentiation. (af) qRT–PCR of Hmgcs2 and antioxidative stress factors. n = 3. (g) Cellular ROS detected by 2’,7’-dichlorofluorescein diacetate (DCFDA) assay. n = 3. (h and i) qRT–PCR of PPARγ (h) and adiponectin (i). n = 3. (j) Western blot of pAkt and β-Actin. Left panel; Representative western blot analysis. Right panel; Quantitative analysis of pAkt in the left panel. n = 3. (ko) qRT–PCR of lipogenic factors. n = 3. (p) Oil red O stain (OD = 492 nm). n = 3. (q) Western blot of lipogenic factors and β-Actin. n = 3. Here cropped blots were displayed and all full-length blots are included in the Supplementary Figure S4. Data are mean ± SEM. *p < 0.05, **p < 0.01. A.U., Arbitrary Unit.
Figure 5
Figure 5
Overexpression of Hmgcs2 is sufficient to induce 3HBA production, antioxidative stress factors, PPARγ, and lipogenic factors in adipocytes. On day 5 after 3T3-L1-TetON-empty and 3T3-L1-TetON-Hmgcs2 adipocytes were differentiated, the adipocytes were treated with 2 µg/mL doxycycline for 48 h. On day 7 after differentiation, these adipocytes were maintained in serum-free DMEM composed of 25 mM glucose and 1 nM insulin for 24 h, followed by harvesting on day 8 after differentiation. (a) Western blot of Hmgcs2. n = 1. (b) qRT–PCR of Hmgcs2. n = 3. (c) 3HBA concentration in culture supernate. n = 3. (dh) qRT–PCR of antioxidative stress factors. n = 3. (i) qRT–PCR of PPARγ. n = 3. (jn) qRT–PCR of lipogenic factors. n = 3. Data are mean ± SEM. *p < 0.05, **p < 0.01, ***p < 0.001. A.U., Arbitrary Unit.
Figure 6
Figure 6
Hmgcs2 is expressed in adipose tissue in vivo and in vitro, and adipocytes produce and secrete 3HBA. (a) Schematic diagram of microarray analysis to identify fasting-inducing genes expressed in adipose tissue. The genes upregulated by fasting are sorted in descending order. The following Gene Expression Omnibus DataSet was used for the analysis: GSE46495 (fold-change > 2.0, p < 0.05; 4666 genes). (b) qRT–PCR of Hmgcs2 in epididymal adipose tissue from C57BL/6 J mice after 12 h of feeding and fasting. n = 3. (ce) qRT–PCR of Hmgcs2 in differentiaed 3T3-L1 adipocytes after 24 h of treatment with 10 mM 3HBA (c), 1 nM insulin (d), and 1 µM dexamethasone (e). n = 3. (f) qRT–PCR of Hmgcs2. n = 3. (g) Intracellular protein of Hmgcs2. n = 1. (h and i) 3HBA concentrations in cell lysate (h) and cell culture supernatant (i) of differentiated and undifferentiated 3T3-L1 adipocytes. n = 3. For measurement of 3HBA, cell lysate was normalized per well of a 6 well plate, and culture supernatant was normalized per 2 mL media for a well of 6 well plate. Here cropped blots were displayed and all full-length blots are included in the supplemental Fig. S2. Data are mean ± SEM. *p < 0.05, **p < 0.01, ***p < 0.001. A.U., Arbitrary Unit.
Figure 7
Figure 7
Hmgcs2 regulates antioxidative stress factors and ROS, PPARγ, and lipogenic factors in an autocrine manner by endogenous 3HBA production in adipocytes. On day 3 after 3T3-L1 adipocytes were differentiated, siRNA was introduced by reverse transfection for 48 h, and forward transfection was performed for 48 h. On day 7 after differentiation, the 3T3-L1 adipocytes were maintained in serum-free DMEM composed of 25 mM glucose and 1 nM insulin for 24 h, followed by harvest on day 8 after differentiation. (a) qRT–PCR of Hmgcs2. (b) 3HBA concentration in cell lysate. n = 3. (cg) qRT–PCR of antioxidative stress factors. n = 3. (h) Cellular ROS detected by 2′,7′-dichlorofluorescein diacetate (DCFDA) assay. n = 3. (i,j) qRT–PCR of PPARγ and Adiponectin. n = 3. (ko) qRT–PCR of lipogenic factors. n = 3. Data are mean ± SEM. *p < 0.05, **p < 0.01, ***p < 0.001. A.U., Arbitrary Unit.
Figure 8
Figure 8
A working hypothesis illustrating how 3HBA contributes to the enhanced function of adipocytes. Circulating 3HBA is primarily synthesized in the liver and secreted. In adipocytes, Hmgcs2 is upregulated by 3HBA and dexamethasone (Dex) but downregulated by insulin. 3HBA enhances the function of adipocytes by reducing fat ROS by inducing antioxidative stress factors and intensifying PPARγ, de novo lipogenesis, and insulin signaling in an endocrine (thick white arrow) and autocrine/paracrine manner through endogenous Hmgcs2 expression followed by the synthesis of 3HBA in adipocytes (thick black arrow).

References

    1. Puchalska P, Crawford PA. Multi-dimensional roles of ketone bodies in fuel metabolism, signaling, and therapeutics. Cell Metab. 2017;25:262–284. doi: 10.1016/j.cmet.2016.12.022. - DOI - PMC - PubMed
    1. McGarry JD, Foster DW. Regulation of hepatic fatty acid oxidation and ketone body production. Annu. Rev. Biochem. 1980;49:395–420. doi: 10.1146/annurev.bi.49.070180.002143. - DOI - PubMed
    1. Cotter DG, Schugar RC, Crawford PA. Ketone body metabolism and cardiovascular disease. Am. J. Physiol. Heart Circ. Physiol. 2013;304:H1060–1076. doi: 10.1152/ajpheart.00646.2012. - DOI - PMC - PubMed
    1. Adijanto J, et al. The retinal pigment epithelium utilizes fatty acids for ketogenesis. J. Biol. Chem. 2014;289:20570–20582. doi: 10.1074/jbc.M114.565457. - DOI - PMC - PubMed
    1. Nonaka Y, et al. Lauric acid stimulates ketone body production in the KT-5 astrocyte cell line. J. Oleo Sci. 2016;65:693–699. doi: 10.5650/jos.ess16069. - DOI - PubMed

Publication types

MeSH terms

LinkOut - more resources