. 2022 Sep;6(9):1292-1309.
doi: 10.1038/s41562-022-01359-x. Epub 2022 Jun 16.

Genome-wide association study of musical beat synchronization demonstrates high polygenicity

Collaborators, Affiliations

Genome-wide association study of musical beat synchronization demonstrates high polygenicity

Maria Niarchou et al. Nat Hum Behav. 2022 Sep.

Abstract

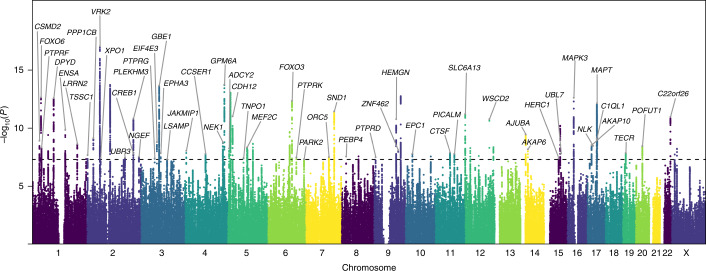
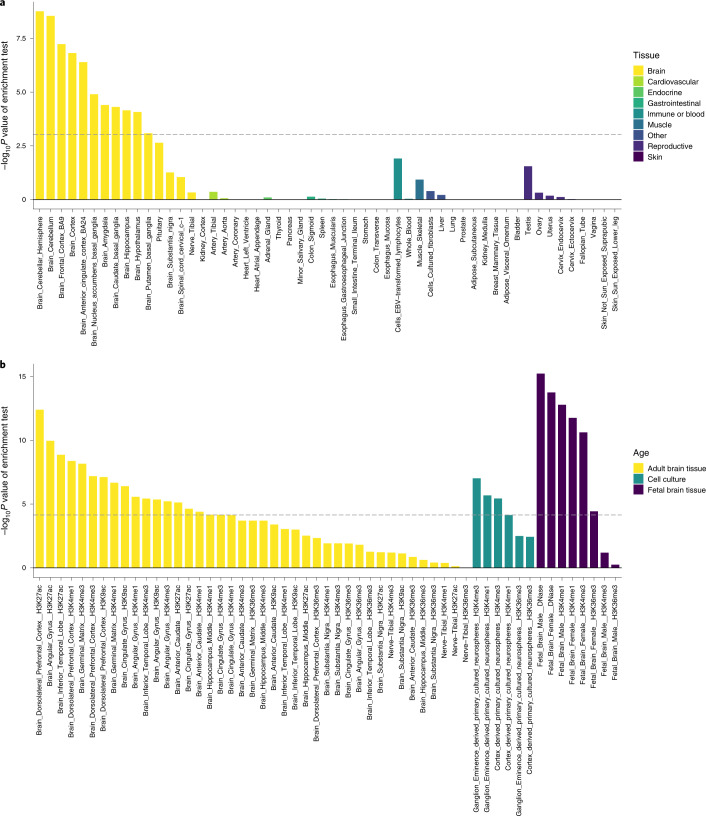
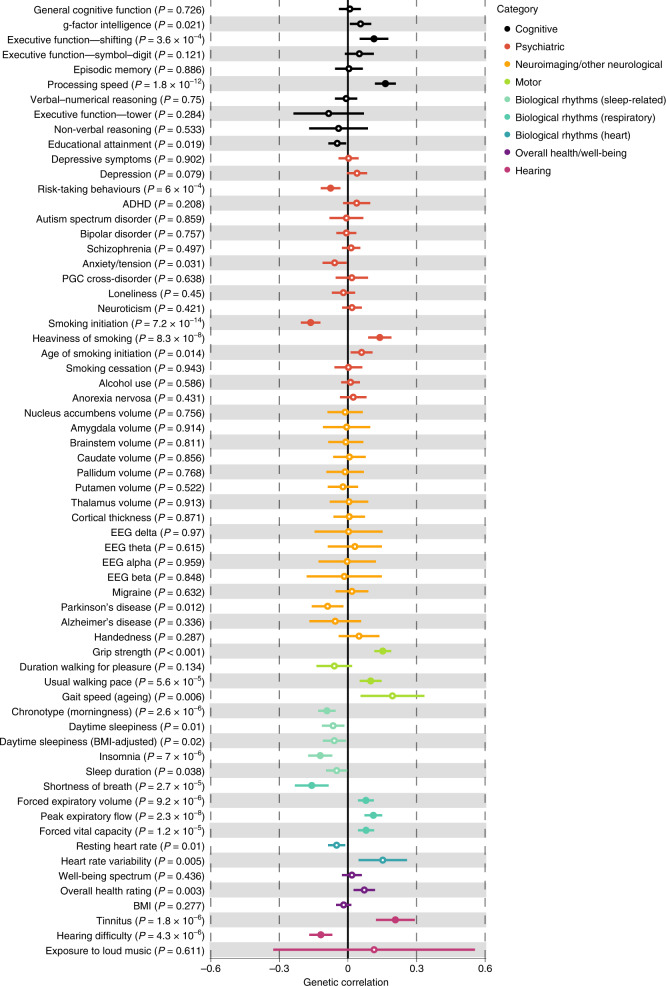
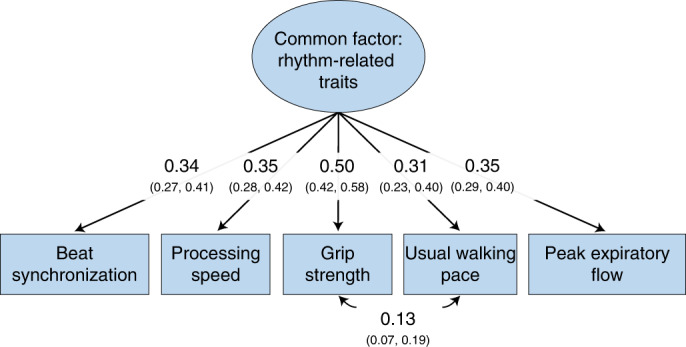
Moving in synchrony to the beat is a fundamental component of musicality. Here we conducted a genome-wide association study to identify common genetic variants associated with beat synchronization in 606,825 individuals. Beat synchronization exhibited a highly polygenic architecture, with 69 loci reaching genome-wide significance (P < 5 × 10⁻⁸) and single-nucleotide-polymorphism-based heritability (on the liability scale) of 13%-16%. Heritability was enriched for genes expressed in brain tissues and for fetal and adult brain-specific gene regulatory elements, underscoring the role of central-nervous-system-expressed genes linked to the genetic basis of the trait. We performed validations of the self-report phenotype (through separate experiments) and of the genome-wide association study (polygenic scores for beat synchronization were associated with patients algorithmically classified as musicians in medical records of a separate biobank). Genetic correlations with breathing function, motor function, processing speed and chronotype suggest shared genetic architecture with beat synchronization and provide avenues for new phenotypic and genetic explorations.


Conflict of interest statement

J.F.S., D.A.H. and members of the 23andMe Research Team are employees of 23andMe, Inc., and hold stock or stock options in 23andMe. All other authors declare no competing interests.

Figures

Fig. 1
Fig. 1. Overview and results of the phenotype validation studies.
a, Schema of internet-based phenotype validation studies. In Phenotype Experiment 1, the participants performed a musical rhythm perception test and provided a self-report of the same target question in the GWAS study (‘Can you clap in time with a musical beat?’). In Phenotype Experiment 2, the participants performed beat synchronization tasks (which involved tapping to the beat of musical excerpts) as well as responding to the same target question, in addition to a series of other questionnaires about their musical engagement/ability and health traits. Illustration: Navya Thakkar. b, Phenotype Experiment 1 results (N = 724) show that rhythm perception task performance is correlated with Yes versus No responses to the GWAS target question (OR = 1.92, McFadden’s R2 = 0.06, P = 0.002). ch, Phenotype Experiment 2 results. Beat synchronization task performance (N = 542) is highly correlated with Yes versus No responses to the target question (OR = 0.28, McFadden’s R2 = 0.24, P < 0.001); note that lower values of s.d. of the asynchrony correspond to more accurate tapping in time to the musical beat (c). Beat synchronization task performance is correlated with responses to a similar self-report question asked on a Likert scale (N = 542, r = –0.40, P < 0.001) (d). The self-reported rhythm questionnaire (seven-item scale, N = 1,412) is correlated with responses to the target question (McFadden’s R2 = 0.34, P < 0.001) (e). Beat synchronization task performance is correlated with the self-reported rhythm questionnaire (N = 542, r = 0.41, P < 0.001) (f). Goldsmiths Musical Sophistication Index (Gold-MSI) (a self-reported musical sophistication questionnaire) is correlated with responses to the target question (N = 1,412, OR = 4.16, McFadden’s R2 = 0.18, P < 0.001) (g). Beat synchronization task performance is correlated with Gold-MSI (N = 542, r = −0.36, P < 0.001) (h). Within each plot for b, c, e and g, distributions are displayed using violin plots (mirrored density plots showing probability density on the left), jittered individual data plots (right) and box plots in the centre (the horizontal line is at the median, the lower and upper edges correspond to the first and third quartiles, and the upper and lower whiskers extend from the edges to the value no further than 1.5× the interquartile range from the edge; data beyond the ends of the whiskers are called ‘outlying’ points and are plotted individually). In d, f and h, scatterplots are shown with dots coloured by density to illustrate distribution; the diagonal lines in the scatterplots represent regression lines with 95% CIs (shaded grey areas). All tests are two-tailed. Taken together, these results show that self-reported beat synchronization is a reasonable proxy of the trait. Source data
Fig. 2
Fig. 2. Manhattan plot of GWAS results of beat synchronization.
Results of GWAS in N = 606,825 participants with 23andMe. The GWAS phenotype is the participants’ responses of Yes (N = 555,660) versus No (N = 51,165) to the question ‘Can you clap in time with a musical beat?’. The GWAS was performed with logistic regression, controlling for age, sex, the top five principal components for ancestry and genotype platform. The x axis shows chromosomal positions, and the y axis shows −log10 P values of the association between the alleles and the phenotype. Sixty-nine loci (70 sentinel SNPs, with one locus containing two independent sentinel SNPs) surpassed the threshold for genome-wide significance of P < 5 × 10−8 (dashed horizontal line). For illustration purposes, all SNPs with P < 5 × 107 are shown, and SNPs between P = 5 × 107 and 1 were downsampled to an evenly distributed draw of 30,880 SNPs; gene symbols for sentinel SNPs are notated when FUMA provided a gene mapped to the nearest sentinel SNP.
Fig. 3
Fig. 3. Genetic architecture of beat synchronization is enriched for brain-related expression.
a, Genes associated with beat synchronization are enriched for expression in brain tissue. The results of MAGMA gene-property analysis are based on gene expression levels from GTEx v.8, in 54 tissues, conditioned on average expression across tissues. Associations with beat synchronization were significantly enriched in brain-expressed genes (−log10 P values are on the y axis, with tissue types on the x axis). The dashed line shows the P value threshold for significant enrichment after Bonferroni correction. b, Partitioned heritability shows enrichment in brain-specific regulatory regions of the genome. Partitioned heritability analysis was performed with LDSC–SEG. Tissue-specific regulatory elements are marked by histone 3 acetylation or DNase hypersensitivity (for open chromatin) and H3K4me1 (for enhancers). Regulatory regions in adult brain tissues are shown in yellow, regulatory elements in cell cultures are shown in teal and regulatory elements in fetal brain tissue are shown in dark purple. The graph shows −log10 P values on the y axis, with tissue and marker types on the x axis. The dashed line shows the P value threshold for significant enrichment after Bonferroni correction for the number of gene sets tested. Source data
Fig. 4
Fig. 4. Cross-trait genetic correlations with beat synchronization.
Results of exploratory genetic correlation analyses between beat synchronization and 64 traits from seven domains, conducted with LDSC. The x axis is magnitude of genetic correlation (rg) with standard error visualized, and the (uncorrected) P values for each trait’s correlation with beat synchronization are shown next to each trait label. Significant genetic correlations (two-tailed test; the significance threshold was set by adjusting for 64 comparisons with a threshold of P < 7.8 × 10−4) are shown with filled-in circles; empty circles are results that did not pass this threshold. See Supplementary Methods and Results: section G for details on the source studies. There are significant positive associations between beat synchronization and two of the cognitive domain GWASs, associations with smoking and risk-taking, two associations with hearing traits, two positive associations with motor function, and multiple associations with other biological rhythms (morning/evening chronotype, insomnia and four breathing-related traits). Source data
Fig. 5
Fig. 5. Genomic SEM model of beat synchronization and rhythm-related traits.
The best-fitting genomic structural equation model of beat synchronization with GWASs of processing speed, grip strength, usual walking pace and peak expiratory flow. The 95% CIs of factor loadings and correlations are displayed in parentheses. The results suggest that beat synchronization was associated with the other traits through a set of common genetic influences. Model fit: χ2 (4) = 10.85, P = 0.028, comparative fit index (CFI) = 0.983, standardized root mean squared residual (SRMR) = 0.017. Source data

References

    1. Savage PE, Brown S, Sakai E, Currie TE. Statistical universals reveal the structures and functions of human music. Proc. Natl Acad. Sci. USA. 2015;112:8987–8992. doi: 10.1073/pnas.1414495112. - DOI - PMC - PubMed
    1. Ravignani, A., Delgado, T. & Kirby, S. Musical evolution in the lab exhibits rhythmic universals. Nat. Hum. Behav.10.1038/s41562-016-0007 (2017).
    1. Mehr, S. A. et al. Universality and diversity in human song. Science10.1126/science.aax0868 (2019). - PMC - PubMed
    1. Kotz, S. A., Ravignani, A. & Fitch, W. T. The evolution of rhythm processing. Trends Cogn. Sci.10.1016/j.tics.2018.08.002 (2018). - PubMed
    1. Pouw, W., Paxton, A., Harrison, S. J. & Dixon, J. A. Acoustic information about upper limb movement in voicing. Proc. Natl Acad. Sci. USA10.1073/pnas.2004163117 (2020). - PMC - PubMed

Publication types