. 2022 Jun 16;13(1):3228.
doi: 10.1038/s41467-022-30849-9.

Disentangling the genetic basis of rhizosphere microbiome assembly in tomato

Affiliations

Disentangling the genetic basis of rhizosphere microbiome assembly in tomato

Ben O Oyserman et al. Nat Commun. .

Abstract

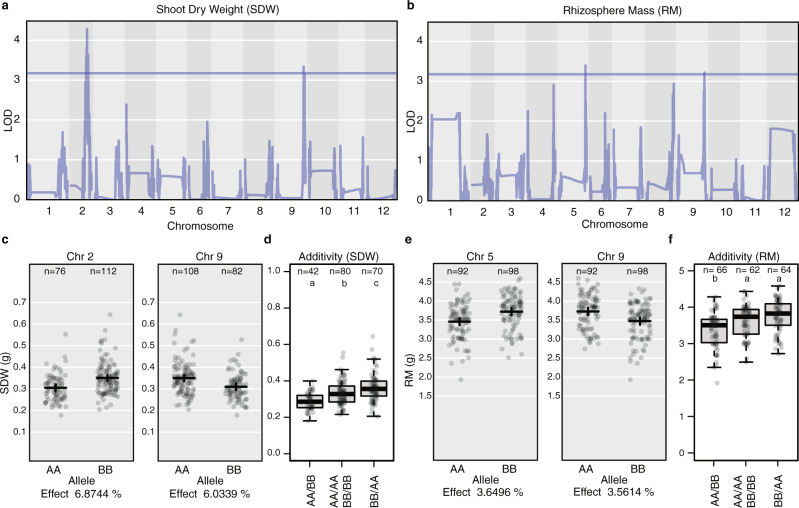
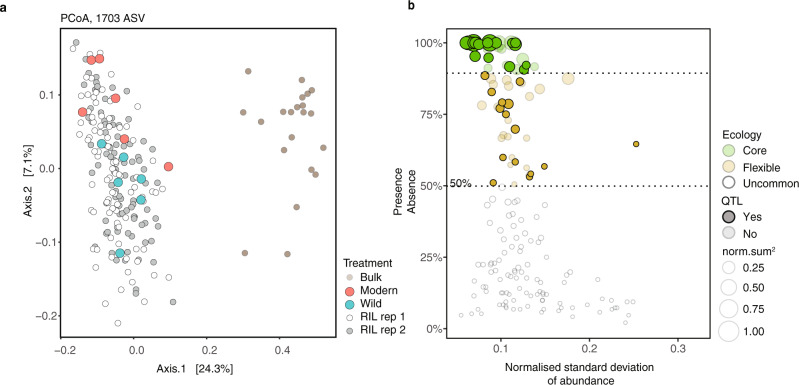
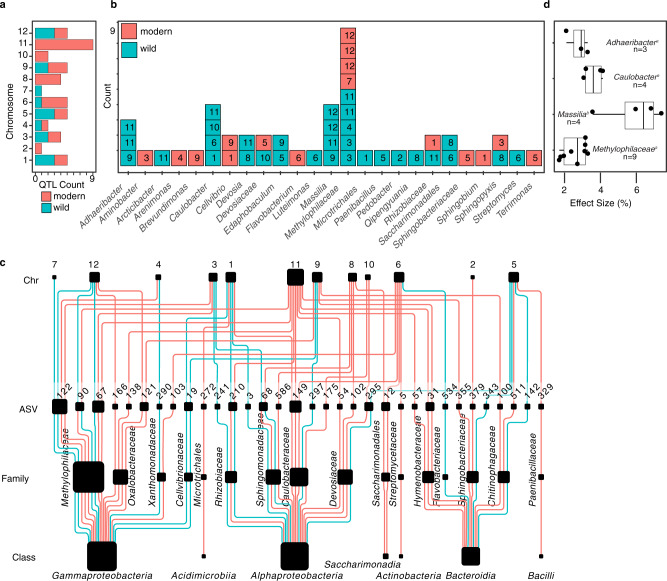
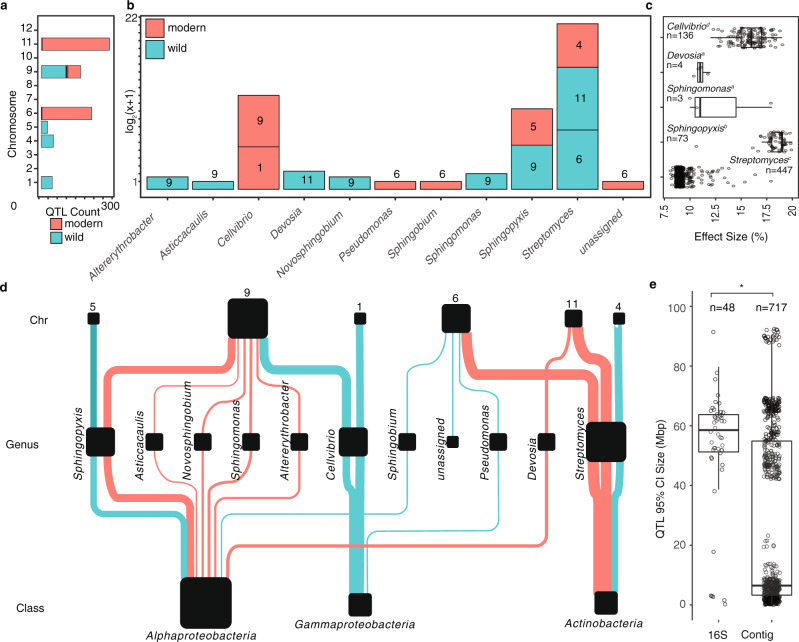
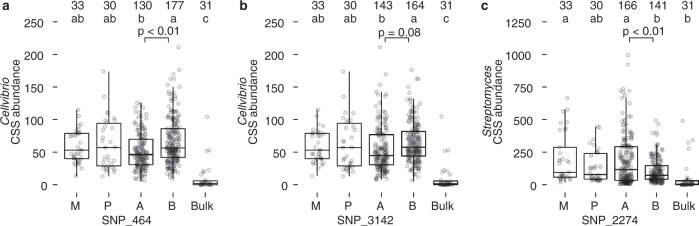
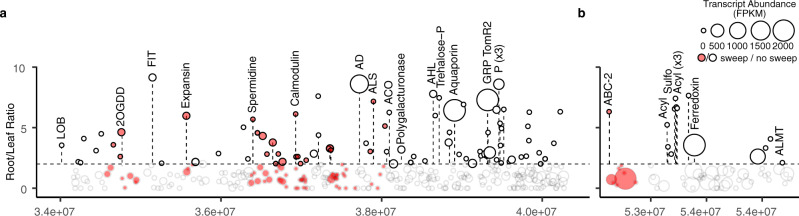
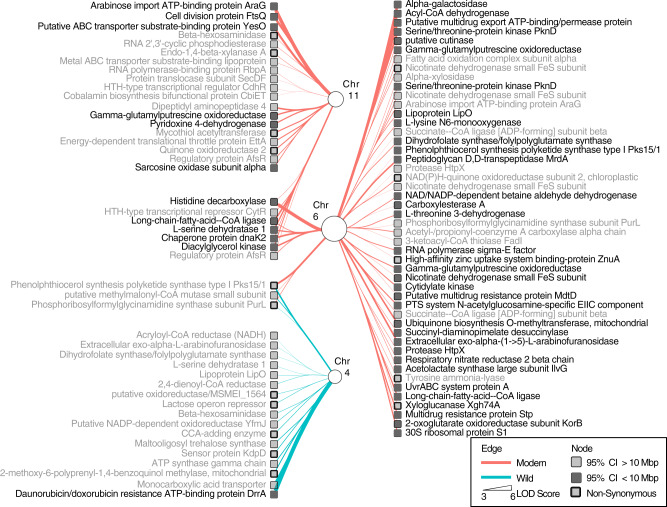
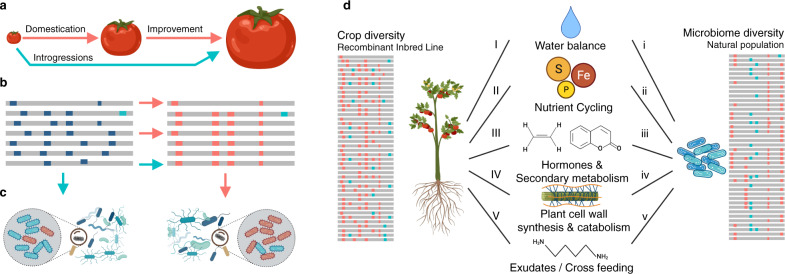
Microbiomes play a pivotal role in plant growth and health, but the genetic factors involved in microbiome assembly remain largely elusive. Here, we map the molecular features of the rhizosphere microbiome as quantitative traits of a diverse hybrid population of wild and domesticated tomato. Gene content analysis of prioritized tomato quantitative trait loci suggests a genetic basis for differential recruitment of various rhizobacterial lineages, including a Streptomyces-associated 6.31 Mbp region harboring tomato domestication sweeps and encoding, among others, the iron regulator FIT and the water channel aquaporin SlTIP2.3. Within metagenome-assembled genomes of root-associated Streptomyces and Cellvibrio, we identify bacterial genes involved in metabolism of plant polysaccharides, iron, sulfur, trehalose, and vitamins, whose genetic variation associates with specific tomato QTLs. By integrating 'microbiomics' and quantitative plant genetics, we pinpoint putative plant and reciprocal rhizobacterial traits underlying microbiome assembly, thereby providing a first step towards plant-microbiome breeding programs.


Conflict of interest statement

The authors declare no competing interests.

Figures

Fig. 1
Fig. 1. Replication of shoot dry weight and rhizosphere mass QTLs from previous studies.
a QTLs identified for SDW on chromosome 9 position 63.63719184 and chromosome 2 position 42.7291229, coinciding with a QTL identified previously (chromosome 9 position 62.897108) by Khan et al 2012. b QTL of RM on chromosome 5 position 62.00574891, and chromosome 9 position 62.71397636, which coincide with root trait QTLs previously identified for lateral root number chromosome 5 position 53.4–86.1, and several on chromosome 9, including fresh and dry shoot weight, (chromosome 9 position 81.3–95.3), lateral root density per branched zone (chromosome 9 position 33.8–88.7), and total root size (chromosome 9 position 39.4–75.1) from Khan et al 2021. c Scatter plots showing the distribution of SDW measurements on chromosome 2 position 42.7291229 and chromosome 9 position 63.63719184 for both modern (AA) and wild (BB) alleles. For the QTL on Chromosome 2, n = 76 and 112 biologically independent samples for AA and BB respectively. For the QTL on Chromosome 9, n = 106 and 82 biologically independent samples for AA and BB respectively. In addition to the scatter plot, data are presented as mean values +/− two times the SEM. d Significant additivity of alleles for SDW (p < 0.05); n of 42, 80, and 70 for biologically independent plants containing neither allele (AA/BB), either BB allele on chromosome 2, or AA on chromosome 9 (AA/AA or BB/BB), or both AA and BB alleles (BB/AA) respectively. In addition to the scatter plot, data are presented with boxplots representing the median value, the interquartile range, and whiskers representing the minimal and maximal values excluding points greater than 1.5 times the interquartile range. e Scatter plots showing the distribution of RM measurements on chromosome 5 (pos 62.00574891), and chromosome 9 (pos 62.71397636) for both modern (AA) and wild (BB) alleles. For the QTL on Chromosome 5, n = 92 and 98 biologically independent samples for AA and BB respectively. For the QTL on Chromosome 9, n = 92 and 98 biologically independent samples for AA and BB respectively. In addition to the scatter plot, data are presented as mean values +/− two times the SEM. f No additivity of alleles was observed for RM. In addition to the scatter plot, data are presented with boxplots representing the median value, the interquartile range, and whiskers representing the minimal and maximal values excluding points greater than 1.5 times the interquartile range. Source data are provided as a Source Data file.
Fig. 2
Fig. 2. The 16S rRNA microbiomes of the bulk soils, modern and wild tomatoes, and RIL population.
a A PCoA analysis of ASVs demonstrating a separation between the bulk soil and rhizosphere microbiomes. The rhizosphere of RIL accessions distribute around the wild and modern rhizospheres. Separation between the two replicate RIL populations was not observed. b To limit multiple testing, a QTL analysis was conducted only on ASV that were observed in over 50% of accessions. The 33 ASV that are subsequently found with QTLs are shown with full opacity. All other ASV are partially transparent. Source data are provided as a Source Data file.
Fig. 3
Fig. 3. The 16S rRNA QTLs.
a A color coded summary of the number of 16S rRNA QTLs identified per chromosome to wild and modern alleles. b A summary of the number of 16S rRNA QTLs found by taxonomies, with the chromosome of each QTL represented within each square. The presence and absence of dark borders around each square are used to indicate a QTL linked to higher abundance for a wild allele and modern allele respectively. c A hierarchically structured network depicting the 16S rRNA QTLs identified in this study. From the top to bottom: the nodes in the first row represent tomato chromosomes, which are linked to specific ASV in the next row, which are linked to different families and classes of bacteria in subsequent rows. The size of the chromosome nodes is weighted by the number of outbound edges. The ASV, family, and class node sizes are weighted by the number of in-bound edges. The edges are color coded based on negative effect relative to the modern reference (e.g., wild allele), and positive effect relative to the modern reference (e.g., modern allele). The abundance of individual ASV, and at different taxonomic levels, is determined through a complex interaction of multiple alleles from both modern and wild origin. d A statistical analysis of the four lineages with 3 or greater QTLs shows that the absolute value of effect size for different lineages is different. Specifically, we find that the effect size for ASV within Massila (n = 4) was significantly larger than for the other lineages (Adhaeribacter, n = 3; Caulobacter, n = 4; Methylophylaceae, n = 9). The effect size was calculated as the percent change relative to the mean CSS abundance for each ASV. In addition to the scatter plot, data are presented with boxplots representing the median value, the interquartile range, and whiskers representing the minimal and maximal values excluding points greater than 1.5 times the interquartile range. Source data are provided as a Source Data file.
Fig. 4
Fig. 4. The contig QTLs.
a A color coded summary of the number of contig QTLs identified per chromosome to wild and modern alleles. b A summary of the number of contig QTLs found by taxonomies, with the chromosome of each QTL represented within each square. The presence and absence of dark borders around each square are used to indicate a QTL linked to higher abundance for a wild allele and modern allele respectively. c The effect sizes for contigs from each lineage Cellvibrio (n = 136), Devosia (n = 4), Sphingomonas (n = 3), Sphingopyxis (n = 73) and Streptomyces (n = 447) were significantly different as indicated by letters (F(14, 702) = 530.9 p < 2e−16). In addition to the scatter plot, data are presented with boxplots representing the median value, the interquartile range, and whiskers representing the minimal and maximal values excluding points greater than 1.5 times the interquartile range. d A hierarchically structured network depicting the contig rRNA QTLs identified in this study. From the top to bottom rows are the tomato chromosomes, which are linked to specific contigs, which are linked to different families and classes of bacteria. The size of the chromosome nodes is weighted by the number of outbound edges. The ASV, family, and class node sizes are weighted by the number of in-bound edges. In addition to the scatter plot, data are presented with boxplots representing the median value, the interquartile range, and whiskers representing the minimal and maximal values excluding points greater than 1.5 times the interquartile range. e When comparing the 95% confidence interval of 16S rRNA amplicon QTLs (n = 48) and contig QTLs (n = 717), the 95% confidence interval of contig QTLs was significantly smaller (two-sided t-test, p = 3.32E−09). In addition to the scatter plot, data are presented with boxplots representing the median value, the interquartile range, and whiskers representing the minimal and maximal values excluding points greater than 1.5 times the interquartile range. Source data are provided as a Source Data file.
Fig. 5
Fig. 5. Validation of Cellvibrio and Streptomyces 16S rRNA QTLs with bulk segregant analysis.
A total of 77 RIL accessions were grown with approximately four biological replicates per accession, as well as 33 modern, 30 wild and 31 bulk samples (see Supplementary Data 13). The number of replicates representing for each treatment is detailed in the top row of each panel. The number of replicates within the RIL population is represented by either an A (modern) or B (wild) allele, which depends on the marker in question. The row below represents the statistical group based on Tukey’s HSD. In addition to the scatter plot, data are presented with boxplots representing the median value, the interquartile range, and whiskers representing the minimal and maximal values excluding points greater than 1.5 times the interquartile range. a The CSS normalized abundances of Cellvibrio 16S rRNA in bulk soil (B), modern (M), wild (W), and RIL accessions at marker position 464 on chromosome 1. At this position, 32 and 45 RIL accessions with modern (A) and wild alleles (B) were used (130 and 177 samples with biological replication respectively). ANOVA showed a statistical difference between genotypes and bulk soil (F(4, 396) = 21.56, p = 4.16 e−16), A post hoc Tukey test supported the conclusion that wild allele at markers 464 associated with increased abundance Cellvibrio (p = 3.913 e−04). b Similarly, for marker 3142 on chromosome 9, there were a total of 35 and 42 RIL accessions with modern (A) and wild alleles (B), (143 and 164 samples with biological replication respectively). ANOVA showed a statistical difference between genotypes and bulk soil (F(4, 396) = 18.43, p = 6.68 e−14), A post hoc Tukey HSD test supported the conclusion that wild allele at markers 464 associated with increased abundance Cellvibrio (p = 0.08). c The normalized CSS abundances of Streptomyces 16S rRNA and sequences in bulk soil (B), modern (M), wild (W), and RIL accessions at marker 2274 on chromosome 6. There was a total of 42 and 35 RIL accessions with modern (A) and wild alleles (B), (166 and 141 samples with biological replication respectively). ANOVA showed a statistical difference between genotypes and bulk soil (F(4, 396) = 8.423, p = 1.57 e−06), A post hoc Tukey HSD test supported the conclusion that wild allele at markers 464 associated with increased abundance Streptomyces (p = 1.152 e−04). Source data are provided as a Source Data file.
Fig. 6
Fig. 6. The prioritized regions of the Streptomyces QTL on chromosomes 6 and 11 overlaying previously reported data on transcript expression and genetic sweeps due to domestication.
Within each region, the log2 ratio gene expression patterns from leaf and root materials were calculated and those with a log2 greater than 2, as delineated by the dotted line, were further prioritized. The log2 root transcript abundances (fragments per kilobase of exon per million mapped fragments, FPKM) are depicted by the size of the bubble. Previously reported genetic sweeps are indicated in red. a The 6.31 Mbp region on chromosome 6 position 33.99–40.3 Mbps. Abbreviations of highlighted genes: LOB - LOB domain protein 4, 2OGDD - 2-Oxoglutarate-dependent dioxygenases, FIT - FIT (Fer-like iron deficiency-induced transcription factor), Spermidine - Spermidine synthase, AD - Alcohol dehydrogenase 2, ALS - Acetolactate synthase, ACO - 1-aminocyclopropane-1-carboxylate oxidase, Polygalacturonase, AHL - AT-hook motif nuclear-localized protein, Trehalose-P - Trehalose 6-phosphate phosphatase, Aquaporin - Tonoplast intrinsic protein 23/Aquaporin, GPR TomR2 - Glycine-rich protein TomR2, P - Acid phosphatase (×3). b The 0.83 Mbp region on chromosome 11 position 53.06–54.89 Mbps. Abbreviations of highlighted genes: ABC-2 - ABC-2 type transporter, Acyl–Acyltransferase (×4), Sulfo–Sulfotransferase, ALMT- Aluminum-activated malate transporter. Source data are provided as a Source Data file.
Fig. 7
Fig. 7. The SNP QTLs identified in the Streptomyces contigs mapping to the previously identified positions on chromosomes 4, 6, and 11.
The figure depicts various features of both the QTL analysis and the SNP. In particular, the edge sizes are relative to the LOD score, and edge color is coded by modern and wild. SNPs are represented by square nodes. Those with confidence intervals <10 Mbp are shaded in dark. Non-synonymous SNPs have a thick border edge. Annotations are provided next to the genes. Source data are provided as a Source Data file.
Fig. 8
Fig. 8. Disentangling the genetic basis of rhizosphere microbiome assembly.
a The initial domestication, subsequent crop improvements, and introgression wild tomato traits to modern cultivars. b While domestication significantly decreased the allelic diversity of modern tomato cultivars, introgressions of allelic diversity from wild relatives has left a genomic signature. c Here we identify QTLs associated with changes in microbiome composition at both the community level, but also within individual populations (e.g., Streptomyces and Cellvibrio). We show that these QTL overlapping previously identified selective sweeps associated with domestication. d By identifying plant QTLs regions using population features of the microbiome (SNVs), it is possible to identify the reciprocal functional adaptations that may link plant and microbe (represented by capital and lower-case letters respectively). These functions may interact directly, or indirectly via the environment. For example, related to water balance (I, i), we identified plant aquaporin and both plant/microbe trehalose metabolism. Selection for altered host water usage may alter the water balance in the soil and associated repercussions on microbiome structure. Similarly, numerous plant and microbial genes related to nutrient cycling (II, ii) involving iron, sulfur, vitamin, and phosphorus acquisition were identified. Plant signaling and hormone genes (III) identified in QTL regions included 1-aminocyclopropane-1-carboxylic acid oxidase, alpha-humulene/beta-caryophyllene synthase, and a p450 involved to coumarin synthesis. Furthermore, plant cell wall metabolism (IV, iv) including expansins, extensins, pectinesterase were linked to microbial genes involved in plant cell wall plant polysaccharides catabolism, cellobiohydrolase glycosyl hydrolases, xylose, sarcosine oxidase, L-arabinofuranosidase, fructose import, a cellulase/esterase, and xyloglucan metabolism. Finally, genes related to exudation and possible cross feeding (V, v) included plant genes such as aluminum-activated malate transporter, polyamine, glutamine, and acetolactate synthetase, and microbial functions related to malate, mannonate, polyamine, and acetolactate metabolism. Created with BioRender.com.

References

    1. Oyserman BO, Medema MH, Raaijmakers JM. Road MAPs to engineer host microbiomes. Curr. Opin. Microbiol. 2018;43:46–54. doi: 10.1016/j.mib.2017.11.023. - DOI - PubMed
    1. Marasco R, et al. A drought resistance-promoting microbiome is selected by root system under desert farming. PLoS One. 2012;7:e48479. doi: 10.1371/journal.pone.0048479. - DOI - PMC - PubMed
    1. Carrión VJ, et al. Pathogen-induced activation of disease-suppressive functions in the endophytic root microbiome. Science. 2019;366:606–612. doi: 10.1126/science.aaw9285. - DOI - PubMed
    1. Finkel OM, et al. A single bacterial genus maintains root growth in a complex microbiome. Nature. 2020 doi: 10.1038/s41586-020-2778-7. - DOI - PMC - PubMed
    1. Wagner MR, et al. Microbe-dependent heterosis in maize. Proc. Natl Acad. Sci. USA. 2021;118:e2021965118. doi: 10.1073/pnas.2021965118. - DOI - PMC - PubMed

Publication types