

Temporal Associations Between EHR-Derived Workload, Burnout, and Errors: a Prospective Cohort Study
- PMID: 35710654
- PMCID: PMC9296727
- DOI: 10.1007/s11606-022-07620-3
Temporal Associations Between EHR-Derived Workload, Burnout, and Errors: a Prospective Cohort Study
Abstract
Background: The temporal progression and workload-related causal contributors to physician burnout are not well-understood.
Objective: To characterize burnout's time course and evaluate the effect of time-varying workload on burnout and medical errors.
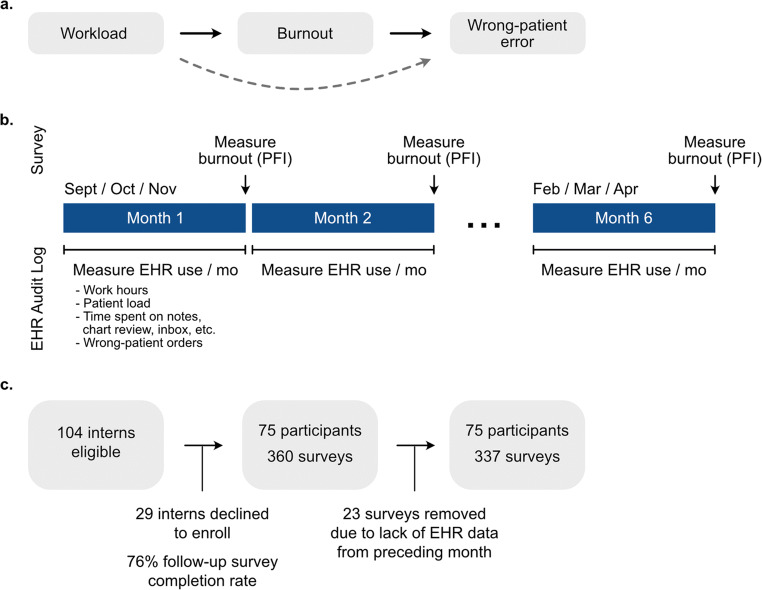
Design: Six-month longitudinal cohort study with measurements of burnout, workload, and wrong-patient orders every 4 weeks.
Participants: Seventy-five intern physicians in internal medicine, pediatrics, and anesthesiology at a large academic medical center.
Main measures: Burnout was measured using the Professional Fulfillment Index survey. Workload was collected from electronic health record (EHR) audit logs and summarized as follows: total time spent on the EHR, after-hours EHR time, patient load, inbox time, chart review time, note-writing time, and number of orders. Wrong-patient orders were assessed using retract-and-reorder events.
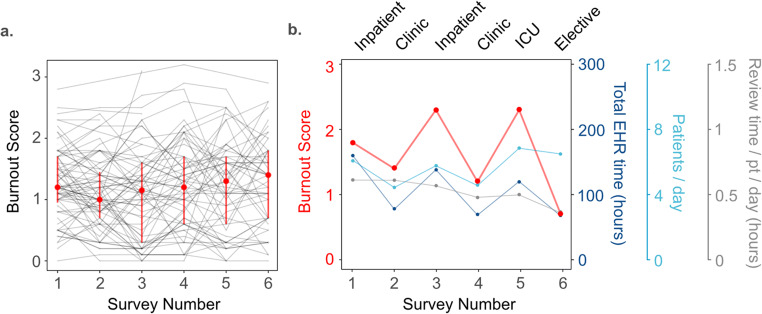
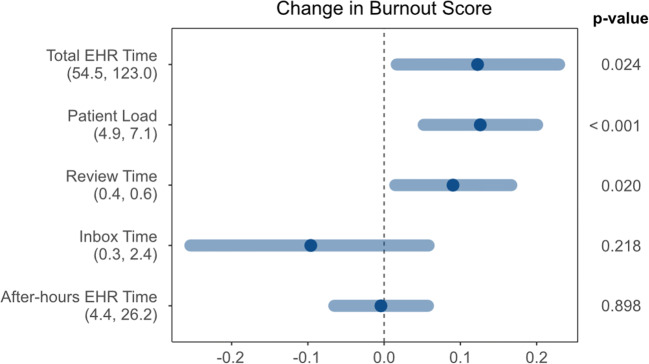
Key results: Seventy-five of 104 interns enrolled (72.1%) in the study. A total of 337 surveys and 8,863,318 EHR-based actions were analyzed. Median burnout score across the cohort across all time points was 1.2 (IQR 0.7-1.7). Individual-level burnout was variable (median monthly change 0.3, IQR 0.1-0.6). In multivariable analysis, increased total EHR time (β=0.121 for an increase from 54.5 h per month (25th percentile) to 123.0 h per month (75th percentile), 95%CI=0.016-0.226), increased patient load (β=0.130 for an increase from 4.9 (25th percentile) to 7.1 (75th percentile) patients per day, 95%CI=0.053-0.207), and increased chart review time (β=0.096 for an increase from 0.39 (25th percentile) to 0.59 (75th percentile) hours per patient per day, 95%CI=0.015-0.177) were associated with an increased burnout score. After adjusting for the total number of ordering sessions, burnout was not statistically associated with an increased rate of wrong-patient orders (rate ratio=1.20, 95%CI=0.76-1.89).
Conclusions: Burnout and recovery were associated with recent clinical workload for a cohort of physician trainees, highlighting the elastic nature of burnout. Wellness interventions should focus on strategies to mitigate sustained elevations of work responsibilities.
Keywords: burnout; electronic health record; graduate medical education; physician wellness; workload.
© 2022. The Author(s), under exclusive licence to Society of General Internal Medicine.
Conflict of interest statement
The authors declare that they do not have a conflict of interest.
Figures
References
-
- West CP, Dyrbye LN, Shanafelt TD. Physician burnout: contributors, consequences and solutions. J Intern Med. 2018;283(6):516-529. 10.1111/joim.12752. - PubMed
-
- National Academies of Sciences, Engineering, and Medicine. Taking Action Against Clinician Burnout: a Systems Approach to Professional Well-Being. The National Academies Press; 2019. 10.17226/25521. - PubMed
-
- Shanafelt TD, Balch CM, Bechamps GJ, et al. Burnout and career satisfaction among American surgeons. Ann Surg. 2009;250(3):463-471. 10.1097/SLA.0b013e3181ac4dfd. - PubMed
-
- Balch CM, Shanafelt TD, Dyrbye L, et al. Surgeon distress as calibrated by hours worked and nights on call. J Am Coll Surg. 2010;211(5):609-619. 10.1016/j.jamcollsurg.2010.06.393. - PubMed
-
- Shanafelt TD, Boone S, Tan L, et al. Burnout and satisfaction with work-life balance among US physicians relative to the general US population. Arch Intern Med. 2012;172(18):1377-1385. 10.1001/archinternmed.2012.3199. - PubMed
Publication types
MeSH terms
Grants and funding
LinkOut - more resources
Full Text Sources
Medical
