. 2022 Jun 16;13(1):3443.
doi: 10.1038/s41467-022-31022-y.

Identifying plant genes shaping microbiota composition in the barley rhizosphere

Affiliations

Identifying plant genes shaping microbiota composition in the barley rhizosphere

Carmen Escudero-Martinez et al. Nat Commun. .

Abstract

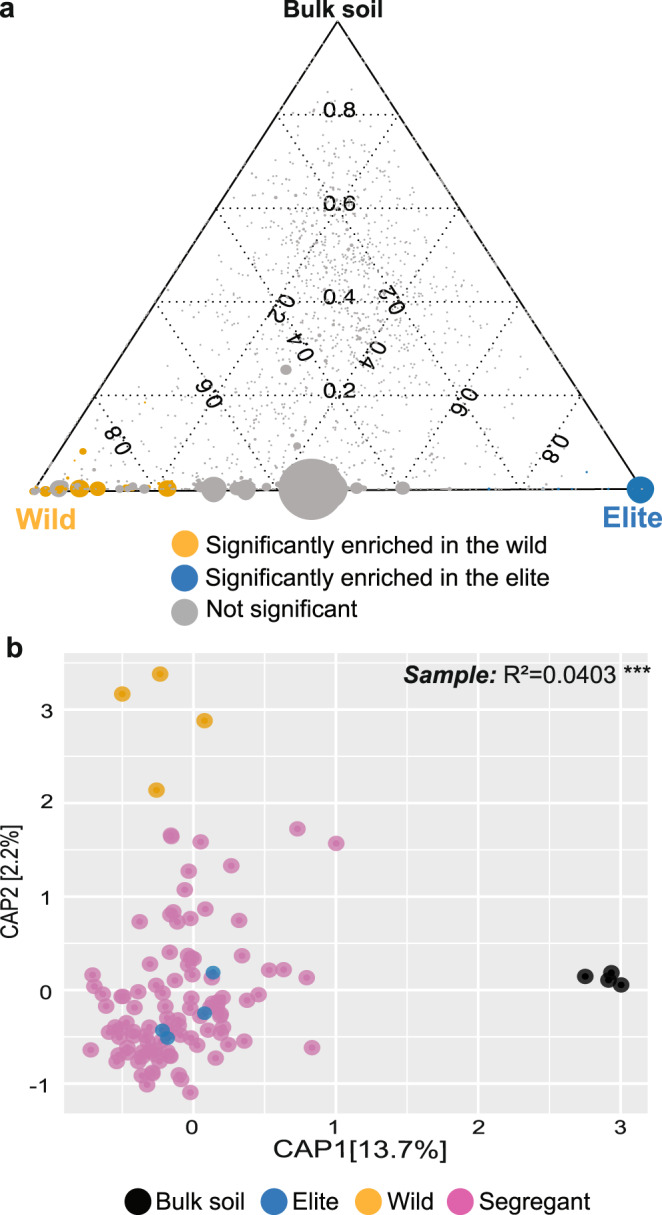
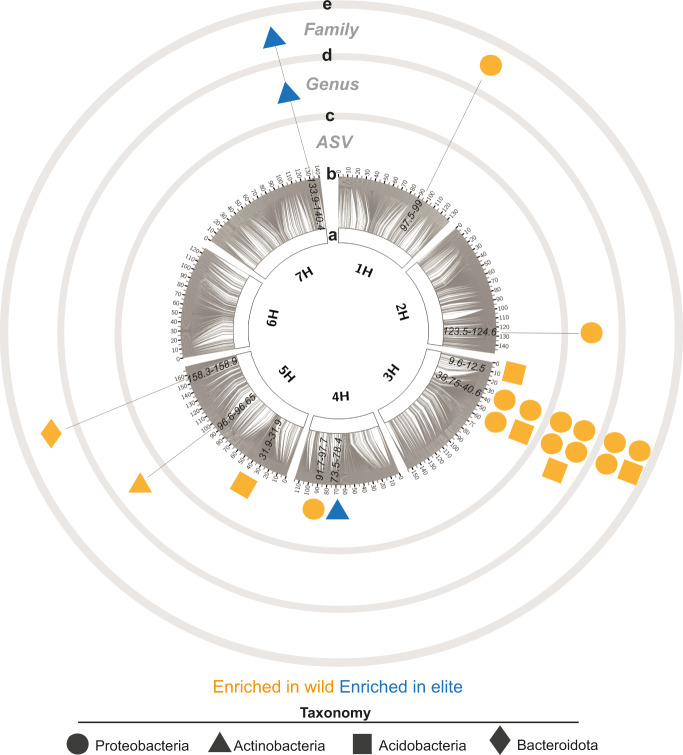
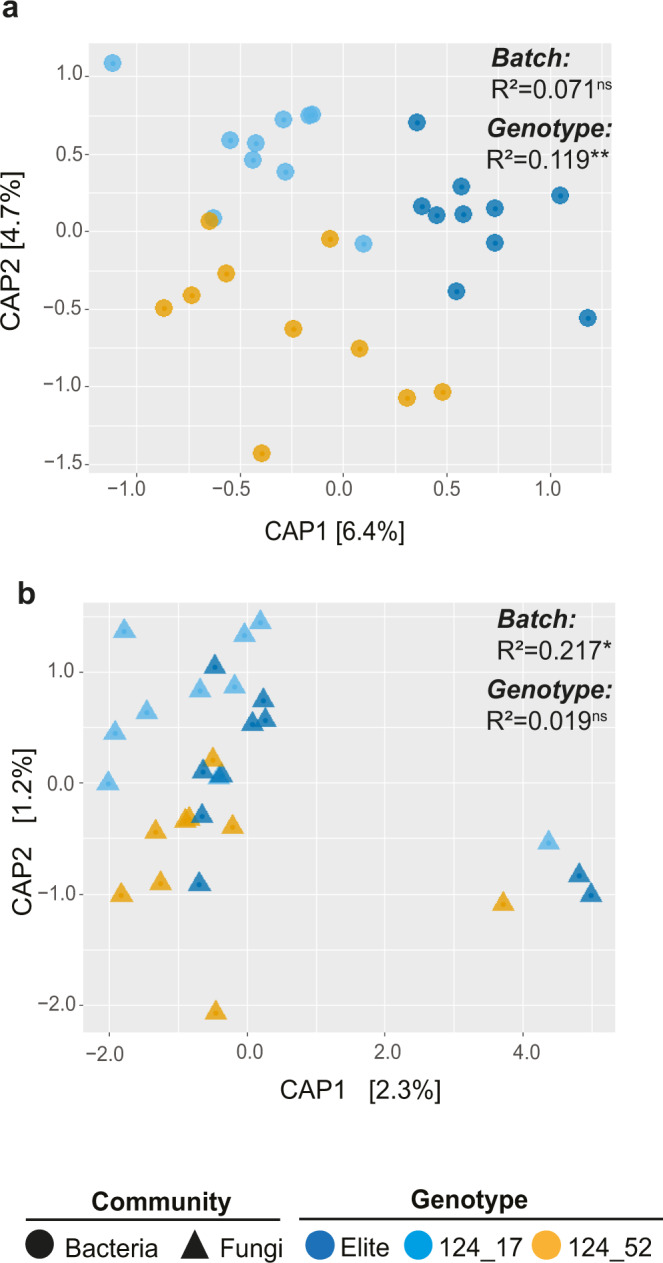
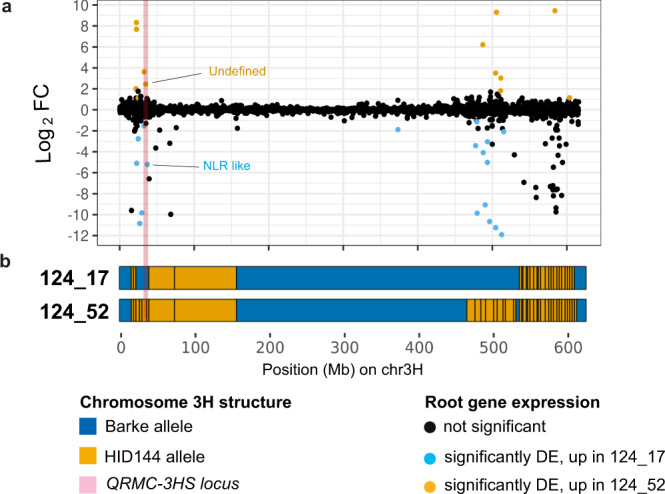
A prerequisite to exploiting soil microbes for sustainable crop production is the identification of the plant genes shaping microbiota composition in the rhizosphere, the interface between roots and soil. Here, we use metagenomics information as an external quantitative phenotype to map the host genetic determinants of the rhizosphere microbiota in wild and domesticated genotypes of barley, the fourth most cultivated cereal globally. We identify a small number of loci with a major effect on the composition of rhizosphere communities. One of those, designated the QRMC-3HS, emerges as a major determinant of microbiota composition. We subject soil-grown sibling lines harbouring contrasting alleles at QRMC-3HS and hosting contrasting microbiotas to comparative root RNA-seq profiling. This allows us to identify three primary candidate genes, including a Nucleotide-Binding-Leucine-Rich-Repeat (NLR) gene in a region of structural variation of the barley genome. Our results provide insights into the footprint of crop improvement on the plant's capacity of shaping rhizosphere microbes.


Conflict of interest statement

The authors declare no competing interests.

Figures

Fig. 1
Fig. 1. Barley microbiota composition displays a quantitative variation in a segregating population between wild and elite parental lines.
a Ternary plot depicting microbiota composition in the elite and wild genotypes as well as bulk soil samples. Each dot illustrates an individual ASV; the size of the dots is proportional to ASV’s abundance while their position reflects the microhabitat where bacteria were predominantly identified. Individual dots are colour-coded according to their significant enrichment in the rhizosphere of either parental line (Wald Test, Individual P-values < 0.05, FDR corrected). b Canonical Analysis of Principal Coordinates computed on Bray–Curtis dissimilarity matrix. Individual dots in the plot denote individual biological replicates whose colours depict sample type in the bottom part of the figure. The number in the plot depicts the proportion of variance (R2) explained by the factor ‘Sample’ within the rhizosphere microhabitat, i.e., Elite, Wild or Segregant. The asterisks associated to the R2 value denote its significance, P-value ‘Sample’ = 0.001; Adonis test, F = 2.23, 5000 permutations. Source data are provided as a Source data file.
Fig. 2
Fig. 2. Genetic map of the barley determinants of individual bacterial members of the rhizosphere microbiota.
Circos plot depicting a the seven barley chromosomes and b grey connector lines link the physical position of SNPs with the genetic position in cM as indicated in the outer part of the ring; numbers in black within the individual chromosome define genetic positions (cM) significantly associated (using the function scanone implementing interval mapping with a single-QTL model, expectation-maximization algorithm, LOD genome-wide significance threshold 20% adjusted per taxa, 1000 permutations) to the differential enrichment of individual c ASVs, d genus or e family, respectively. Different shapes depict taxonomic assignment at phylum level. Shapes are colour-coded according to the microbiota of the parental line where individual taxa were identified. Source data are provided as a Source data file.
Fig. 3
Fig. 3. Wild alleles at locus QRMC-3HS are associated with a shift in the composition of the bacterial, but not fungal, microbiota.
Canonical Analysis of Principal Coordinates computed on Bray–Curtis dissimilarity matrix of a bacterial or b fungal ASVs’ abundances. Sample type is depicted in the bottom part of the figure. The number in the plots show the proportion of variance (R2) explained by the factors ‘Batch’ and ‘Genotype’, respectively. Asterisks associated to the R2 value denote its significance, ns not significant. a P-value ‘Batch’ = 0.278, F = 1.10; P-value ‘Genotype’ = 0.005, F = 1.84; Adonis test 5000 permutations. b P-value ‘Batch’ = 0.027, F = 3.05; P-value ‘Genotype’ = 0.963, F = 0.26; Adonis test 5000 permutations. Source data are provided as a Source data file.
Fig. 4
Fig. 4. The sibling lines harbouring contrasting alleles at locus QRMC-3HS and the cultivar Barke display distinct root transcriptional profiles.
Venn diagram showing the number of differentially expressed genes among pairs of comparisons between the sibling lines 124_52 (wild-like), 124_17 (elite-like) and their elite parent Barke (EdgeR pair-wise comparison, individual P-values < 0.01, FDR corrected). Source data are provided as a Source data file.
Fig. 5
Fig. 5. Differentially expressed genes mapping at locus QRMC-3HS.
a Dots depict individual genes and their expression pattern in the pair-wise comparison 124_17 vs. 124_52 (log2 Fold-Change), colour-coded according to their significance as illustrated at the bottom of the figure (EdgeR, individual P-values < 0.01, FDR corrected). b Projection of the individual genes on the structures of chromosome 3H for the lines 124_17 (elite-like) and 124_52 (wild-like), respectively, colour-coded according to allelic composition as indicated in the key at the bottom of the figure. The physical location of locus QRMC-3HS is highlighted in pale pink. Source data are provided as a Source data file.
Fig. 6
Fig. 6. Locus QRMC-3HS defines an area of structural variation in the barley genome.
Alignment visualisation of the sequence at and surrounding the QRMC-3HS locus comparing a the cultivars Barke and Morex and b Barke to cultivar Golden Promise. The QRMC-3HS locus is shown in white, while purple dots represent sequencing matches longer than 1000 bp and ≥95% identity. The gap in the diagonal in (a) denotes a disruption of synteny between the two genotypes. Numbers on the axis denote the physical interval, in bp, analysed in the given genomes. Source data are provided as a Source data file.
Fig. 7
Fig. 7. The NLR gene associated with genotype-dependent transcriptional and genomic variations.
a Boxplot showing the root RNA-seq NLR expression across the elite and the sibling lines in normalised counts per million. Individual dots depict individual biological replicates. Upper and lower edges of the box plots represent the upper and lower quartiles, respectively. The bold line within the box denotes the median. Whiskers denote values within 1.5 interquartile ranges. b Schematic representation of the NLR gene transcripts inferred from the RNA-seq data depicting predicted protein domains from InterProScan. The black arrow depicts the predicted amplicon site of the PCR marker. c PCR amplicons partially covering the intron between the LRR and the ankyrin domains in the indicated genotypes-Negative control (NC). A DNA ladder was loaded in the first and last well of each lane, arrowheads indicate the 200 bp fragment. The diagnostic screening was repeated twice with identical results. Source data are provided as a Source data file.

References

    1. Berendsen RL, et al. Disease-induced assemblage of a plant-beneficial bacterial consortium. ISME J. 2018;12:1496–1507. doi: 10.1038/s41396-018-0093-1. - DOI - PMC - PubMed
    1. Hacquard S, Spaepen S, Garrido-Oter R, Schulze-Lefert P. Interplay between innate immunity and the plant microbiota. Annu. Rev. Phytopathol. 2017;55:565–589. doi: 10.1146/annurev-phyto-080516-035623. - DOI - PubMed
    1. Lu, T. et al. Rhizosphere microorganisms can influence the timing of plant flowering. Microbiome6, 231 (2018). - PMC - PubMed
    1. Verbon EH, Liberman LM. Beneficial microbes affect endogenous mechanisms controlling root development. Trends Plant Sci. 2016;21:218–229. doi: 10.1016/j.tplants.2016.01.013. - DOI - PMC - PubMed
    1. York LM, Carminati A, Mooney SJ, Ritz K, Bennett MJ. The holistic rhizosphere: integrating zones, processes, and semantics in the soil influenced by roots. J. Exp. Bot. 2016;67:3629–3643. doi: 10.1093/jxb/erw108. - DOI - PubMed

Publication types