. 2022 Jun 16;13(1):3470.
doi: 10.1038/s41467-022-31137-2.

Terahertz thermal curve analysis for label-free identification of pathogens

Affiliations

Terahertz thermal curve analysis for label-free identification of pathogens

S W Jun et al. Nat Commun. .

Abstract

In this study, we perform a thermal curve analysis with terahertz (THz) metamaterials to develop a label-free identification tool for pathogens such as bacteria and yeasts. The resonant frequency of the metasensor coated with a bacterial layer changes as a function of temperature; this provides a unique fingerprint specific to the individual microbial species without the use of fluorescent dyes and antibodies. Differential thermal curves obtained from the temperature-dependent resonance exhibit the peaks consistent with bacterial phases, such as growth, thermal inactivation, DNA denaturation, and cell wall destruction. In addition, we can distinguish gram-negative bacteria from gram-positive bacteria which show strong peaks in the temperature range of cell wall destruction. Finally, we perform THz melting curve analysis on the mixture of bacterial species in which the pathogenic bacteria are successfully distinguished from each other, which is essential for practical clinical and environmental applications such as in blood culture.


Conflict of interest statement

The authors declare no competing interests.

Figures

Fig. 1
Fig. 1. Schematic of thermal curve analysis based on THz metamaterials.
a Schematic of experiments. The microbial films grown on a culture medium are transferred to THz metamaterials while samples are being heated. The microbes exhibit phase change with increasing temperature based on conditions for growth, inactivation, DNA denaturation, and cell wall destruction. b An abrupt change in the metamaterial resonance occurs in the transition between different growth and death phases, in which strong peaks appear in different thermal curves (DTCs). DTCs offer unique fingerprints for identifying different microbial species. c Photograph of metamaterial sensors coated with a microbial film (30-µm-thick E. coli film).
Fig. 2
Fig. 2. Experimental results for thermal curve analysis obtained from in situ THz spectroscopy.
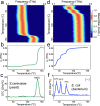
a 2D plot of THz absorption through metamaterials coated with a yeast layer (S. cerevisiae) as functions of the spectrum (x-axis) and temperature (y-axis). b Metamaterial resonance (fR) as a function of temperature extracted from a. c DTC (dfR/dT) for the yeast layer obtained by differentiating the curve in (b). d 2D plot of THz absorption for a metasensor coated with a E. coli layer. e fRT plot extracted from d. f DTC for the E. coli layer. Minus sign (–) in f indicates that E. coli is the Gram-negative bacteria.
Fig. 3
Fig. 3. Differential thermal curve results for four bacterial species.
DTCs for a S. aureus, b P. aeruginosa, c L. casei, and d P. mirabilis. Gram-negative bacteria (P. aeruginosa and P. mirabilis) do not exhibit noticeable peak corresponding to the cell wall destruction (i.e., at T > 100 °C). Positive (+) and negative (–) signs denote the Gram-positive and Gram-negative bacteria, respectively.
Fig. 4
Fig. 4. Summary on the thermal curve analysis for 10 pathogens.
Bar graphs of amplitude as a function of temperature according to the peaks observed in DTCs for a yeasts, b Gram-negative bacteria, and c Gram-positive bacteria. The amplitudes are normalized by its highest peak values for each species.
Fig. 5
Fig. 5. Thermal curve analysis for a mixture of bacteria.
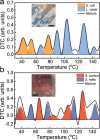
a DTC for a mixture of E. coli and L. casei bacteria. The curve was decomposed by those of E. coli (orange) and L. casei (sky-blue) based on their respective peak positions obtained from Fig. 4. b DTC for a mixture of S. aureus and S. mitis bacteria, which was decomposed by those of S. aureus (red) and S. mitis (blue). Insets in (a, b) are the pictures of bacterial layers grown in respective culture media (scale bar: 5 mm).

References

    1. Kevadiya BD, et al. Diagnostics for SARS-CoV-2 infections. Nat. Mater. 2021;20:593–605. doi: 10.1038/s41563-020-00906-z. - DOI - PMC - PubMed
    1. Castillo-Henríquez L, et al. Biosensors for the detection of bacterial and viral clinical pathogens. Sensors. 2020;20:6926. doi: 10.3390/s20236926. - DOI - PMC - PubMed
    1. Makimura K, Murayama SY, Yamaguchi H. Detection of a wide range of medically important fungi by the polymerase chain reaction. J. Med. Microbiol. 1994;40:358–364. doi: 10.1099/00222615-40-5-358. - DOI - PubMed
    1. Belgrader P, et al. PCR detection of bacteria in seven minutes. Science. 1999;284:449–450. doi: 10.1126/science.284.5413.449. - DOI - PubMed
    1. Niemz A, Ferguson TM, Boyle DS. Point-of-care nucleic acid testing for infectious diseases. Trends Biotechnol. 2011;29:240–250. doi: 10.1016/j.tibtech.2011.01.007. - DOI - PMC - PubMed

Publication types

LinkOut - more resources