. 2022 Jun 17;13(1):3485.
doi: 10.1038/s41467-022-31194-7.

The chromatin remodeller ATRX facilitates diverse nuclear processes, in a stochastic manner, in both heterochromatin and euchromatin

Affiliations

The chromatin remodeller ATRX facilitates diverse nuclear processes, in a stochastic manner, in both heterochromatin and euchromatin

Julia Truch et al. Nat Commun. .

Abstract

The chromatin remodeller ATRX interacts with the histone chaperone DAXX to deposit the histone variant H3.3 at sites of nucleosome turnover. ATRX is known to bind repetitive, heterochromatic regions of the genome including telomeres, ribosomal DNA and pericentric repeats, many of which are putative G-quadruplex forming sequences (PQS). At these sites ATRX plays an ancillary role in a wide range of nuclear processes facilitating replication, chromatin modification and transcription. Here, using an improved protocol for chromatin immunoprecipitation, we show that ATRX also binds active regulatory elements in euchromatin. Mutations in ATRX lead to perturbation of gene expression associated with a reduction in chromatin accessibility, histone modification, transcription factor binding and deposition of H3.3 at the sequences to which it normally binds. In erythroid cells where downregulation of α-globin expression is a hallmark of ATR-X syndrome, perturbation of chromatin accessibility and gene expression occurs in only a subset of cells. The stochastic nature of this process suggests that ATRX acts as a general facilitator of cell specific transcriptional and epigenetic programmes, both in heterochromatin and euchromatin.


Conflict of interest statement

The authors declare no competing interests.

Figures

Fig. 1
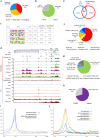
Fig. 1. ATRX binding sites associated with unmethylated CpG clusters and open chromatin regions.
a Examples of the variability in pattern and shape of the ATRX binding sites. (i) Example of a broad ATRX binding site enriched in H3K9me3 at a fully methylated CpG island with a background signal in the Bio-CAP experiment (designed to detect unmethylated CpG clusters), (ii) Example of a sharp ATRX binding site depleted in H3K9me3 at a non-methylated CpG island with an enrichment in the Bio-CAP-seq signal. The signals represent an average of the independent replicates (n = 3) b Distribution of the ATRX binding sites. c Genome-wide analysis of ATRX enrichment across genes. The ATRX enrichment represents an average of the independent replicates (n = 3). d Overlap between ATRX peaks annotated CpG islands and non-methylated CpG clusters (Bio-CAP-seq) in LCLs. e Heatmap showing the enrichment in ATRX (n = 3), Bio-CAP (n = 3), H3K4me3 (n = 3), ATAC-seq (n = 4), Runx3 (n = 2) and H3K9me3 (n = 3) signals at all ATRX binding sites subdivided on their genomic location. The read densities represent an average of the independent replicates. f Correlation between Bio-CAP signal (n = 3 independent replicates) and H3K9me3 signal (n = 3 independent replicates) at all annotated CpG islands (n = 27711) in grey and at annotated CpG islands enriched in ATRX (n = 2580) in blue (data are presented as mean values +/− SEM). g Venn diagram illustrating the overlap between all ATRX binding sites and ATAC-seq peaks.
Fig. 2
Fig. 2. ATRX binding sites associate with active regulatory elements.
a GenoSTAN analysis in LCLs of: (left) all ATAC-seq sites of open chromatin identified in LCLs plus ATRX binding sites not in open chromatin, (right) all the ATRX binding sites identified in LCLs—active promoter (P), poised promoter (Pp), active enhancer (E), enhancer-CTCF binding site (EC), CTCF binding site (C), repressed region (R) and background (B). b Proportion of ATRX binding sites overlapping with transcription factor binding sites (TFBS). c Analysis of TFBS at ATRX binding sites (in blue) vs ATRX binding sites at TFBS (in burgundy) based on their % overlaps showing the TFBS the most enriched at ATRX binding sites. d Motif analysis of ATRX binding sites in LCLs (p-values HOMER findMotifsGenome.pl). e Representative image of the Myc locus highlighting the presence of ATRX enrichment at active enhancers (−525 and −428). The signals represent an average of the independent replicates (n = 3 for ATRX, H3K4me1, H3K4me3 and H3.3 ChIP-seq, n = 2 for H3K27ac ChIP-seq and n = 4 for ATAC-seq).
Fig. 3
Fig. 3. ATRX enrichment at regulatory elements varies with the activity of the locus and ATRX binding sites conserved across cell lines show conserved chromatin accessibility states.
a Distribution of the ATRX binding sites relative to genes in erythroblasts. b Distribution of the ATRX binding sites depending on their chromatin accessibility as assessed by ATAC-seq in erythroblasts. c Motif analysis of ATRX binding sites in erythroblasts (p-values HOMER findMotifsGenome.pl). d Representative image of the α-globin locus active in erythroblasts and silenced in LCLs. The signals represent an average of the independent replicates (in LCLS, n = 3 for ATRX ChIP-seq, H3K4me1, H3K4me3, H3K27me3 and H3.3 ChIP-seq, n = 2 for H3K27ac ChIP-seq and n = 4 for ATAC-seq. In erythroblasts, n = 3 for ATRX-ChIP-seq, n = 1 for H3K4me1, H3K4me3, H3.3 and H3K27me3 and n = 4 for ATAC-seq). e Venn diagram showing the cell type-specific and conserved ATRX binding sites in LCLs and erythroblasts. f Distribution of the conserved ATRX binding sites based on their position in relation to genes. g Chromatin accessibility status in LCLs and erythroblasts at the conserved ATRX binding sites. h Distribution of the conserved ATRX binding sites based on the presence or absence of PQS. i Genome-wide ATRX enrichment across genes in LCLs depending on the gene expression status in LCLs and erythroblasts. The signals represent an average of the independent replicates (n = 3). j Genome-wide ATRX enrichment across genes depending on the level of gene expression in LCLs. The signals represent an average of the independent replicates (n = 3).
Fig. 4
Fig. 4. Pathogenic ATRX mutations are associated with changes in chromatin environment at regulatory elements in LCLs.
a Volcano plot of the microarray data comparing LCLs derived from ATR-X cases and unaffected donors. In red (or blue if highlighted with gene name), the probes that are significantly differentially expressed (ATR-X cases relative to controls) with an adjusted p-value ≤ 0.05 (horizontal grey dot line). adj.P.Val = adjusted p-values based on lmFit and eBayes (empirical Bayes moderated t-statistics test) from the limma packages and adjustment with Benjamini Hochberg. Adjusted p-values for probes highlighted in blue: ATF7IP2 (adj.P.Val = 9.14E−06 and 3.19E−06), LPAR6 (adj.P.Val = 1.37E−03), NME4 (adj.P.Val = 3.67E−02), PBX4 (adj.P.Val = 2.96E−02), RASGEF1A (adj.P.Val = 2.22E−08), ZNF555 (adj.P.Val = 6.96E−05), ZNF57 (adj.P.Val = 4.65E−03), ZNF595 (adj.P.Val  = 2.36E−04 and 1.05E−03) and ZNF718 (adj.P.Val = 1.08E−04). logFC = log fold change of cases over controls (n = 20 for the controls and n = 28 for the cases). b ATF7IP2 locus. c PBX4 locus. Signals of chromatin marks, Bio-CAP, ATAC, and Runx3, for ATR-X individuals (Case) and controls (Ctr). The signals represent an average of the independent replicates (n = 3 except for ATAC (n = 4) and H3K27ac and runx3 (n = 2) and ATRX (n = 6)).
Fig. 5
Fig. 5. ATRX loss of function is associated with perturbation of the chromatin environment and gene expression in a subpopulation of erythroblasts.
a Comparison of the chromatin environment in erythroblasts across the α-globin locus between unaffected donors and ATR-X cases (n = 1). H3K27ac ChIP-seq were performed as ChIP-Rx and normalised based on the Drosophila melanogaster S2 cells spiked in. bd Tukey based box plots of scATAC-seq data showing the distribution of chromatin accessibility in controls (n = 2: Ctr2 and Ctr3, each of them composed of 4000 cells) and ATR-X cases (n = 2: case1 and case2, each of them composed of 4000 cells). Tukey based box plots showing the 25th and 75th percentiles (lower and upper bounds of the box, respectively), the median (centre line highlighted by an arrow), the minimum value lower than the 25th percentile minus 1.5* inter-quartile range (IQR) (lower whisker) and the maximum value greater than the 75th percentile plus 1.5*IQR (upper whisker), any values beyond the whiskers boundaries are represented as dots. b HBB locus, c HBA locus and d HBM locus. eh t-SNE analysis of scATAC-seq data showing each individual cell (n = 4: Ctr2, Ctr3, Case1 and Case2) and encircled in red a subpopulation with contrasting chromatin accessibility scores for e HBB, f HBA1, g HBM; in h highlighting the cells belonging to either controls or cases that are included in or surrounding the subpopulation encircled with a red line; in eg the black arrows point to examples of subpopulations where there are high levels of chromatin accessibility at HBB, HBA and HBM loci. i, j scRNA-seq data showing each individual cell colour based on HBM expression in control (n = 1: Ctr3) and in case (n = 1: Case1) and showing in i the relative gene expression of HBA relative to HBB. and in j the relative gene expression of HBM relative to HBB. k Model of the loss of chromatin integrity observed in ATR-X cases during cell differentiation/locus activity and the associated effect on gene expression.

References

    1. Clynes D, Higgs DR, Gibbons RJ. The chromatin remodeller ATRX: a repeat offender in human disease. Trends Biochem Sci. 2013;38:461–466. - PubMed
    1. Gibbons RJ, et al. Mutations in ATRX, encoding a SWI/SNF-like protein, cause diverse changes in the pattern of DNA methylation. Nat. Genet. 2000;24:368–371. - PubMed
    1. Law MJ, et al. ATR-X syndrome protein targets tandem repeats and influences allele-specific expression in a size-dependent manner. Cell. 2010;143:367–378. - PubMed
    1. Clynes D, et al. ATRX dysfunction induces replication defects in primary mouse cells. PLoS ONE. 2014;9:e92915. - PMC - PubMed
    1. Clynes D, et al. Suppression of the alternative lengthening of telomere pathway by the chromatin remodelling factor ATRX. Nat. Commun. 2015;6:7538. - PMC - PubMed

Publication types

Supplementary concepts