. 2022 Jun;29(6):586-591.
doi: 10.1038/s41594-022-00773-z. Epub 2022 Jun 16.

The cohesin acetylation cycle controls chromatin loop length through a PDS5A brake mechanism

Affiliations

The cohesin acetylation cycle controls chromatin loop length through a PDS5A brake mechanism

Marjon S van Ruiten et al. Nat Struct Mol Biol. 2022 Jun.

Abstract

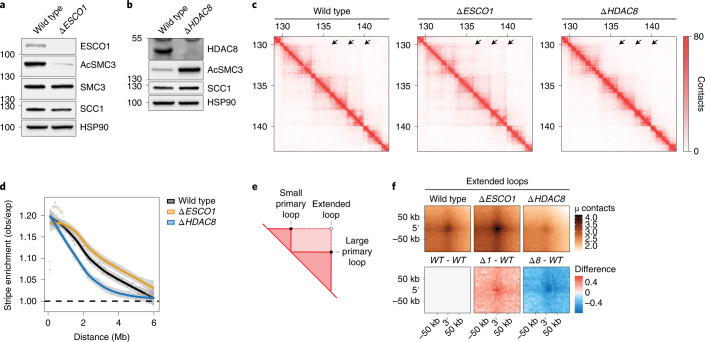
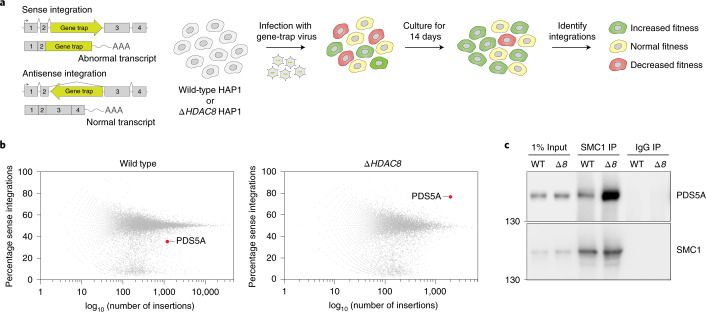
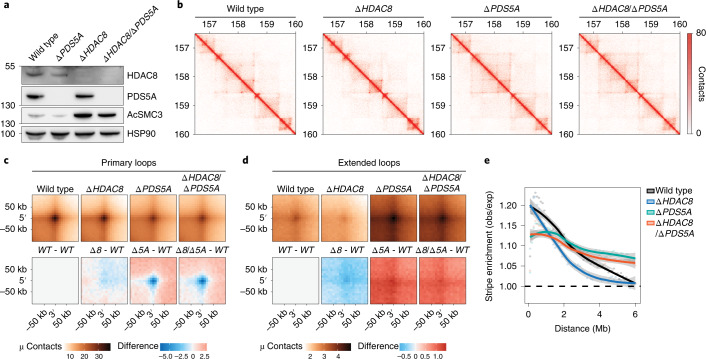
Cohesin structures the genome through the formation of chromatin loops and by holding together the sister chromatids. The acetylation of cohesin's SMC3 subunit is a dynamic process that involves the acetyltransferase ESCO1 and deacetylase HDAC8. Here we show that this cohesin acetylation cycle controls the three-dimensional genome in human cells. ESCO1 restricts the length of chromatin loops, and of architectural stripes emanating from CTCF sites. HDAC8 conversely promotes the extension of such loops and stripes. This role in controlling loop length turns out to be distinct from the canonical role of cohesin acetylation that protects against WAPL-mediated DNA release. We reveal that acetylation controls the interaction of cohesin with PDS5A to restrict chromatin loop length. Our data support a model in which this PDS5A-bound state acts as a brake that enables the pausing and restart of loop enlargement. The cohesin acetylation cycle hereby provides punctuation in the process of genome folding.


Conflict of interest statement

The authors declare no competing interests.

Figures

Fig. 1
Fig. 1. Cohesin acetylation restricts the length of architectural stripes and chromatin loops.
a, Immunoblot analysis of ∆ESCO1 cells. The ∆ESCO1 cell line displays reduced levels of acetylated SMC3 (AcSMC3). This experiment was performed three times, with similar results. b, Immunoblot analysis of ∆HDAC8 cells; these cells have increased levels of acetylated SMC3. This experiment was performed three times, with similar results. c, Hi-C contact matrices for G1 cells of the indicated genotypes. A locus at chromosome 4 is shown at 20-kb resolution. Matrices were normalized to 100 million contacts per sample. The arrows indicate examples of architectural stripes whose length has changed in ∆ESCO1 and ∆HDAC8 cells. d, Aggregate stripe analysis to quantify signal enrichment emanating from CTCF sites at 100-kb resolution. Typically, interactions are formed close to the diagonal and decay over distance. These so-called expected contacts were obtained from a distance-normalized contact matrix; we then calculated enrichment of the observed (obs) contacts over the expected (exp) contacts at 100-kb resolution. This method reveals the presence of architectural stripes emanating from CTCF sites. ∆ESCO1 cells are enriched for long interactions while ∆HDAC8 cells display shorter interactions. e, Cartoon illustrating the difference between primary and extended loops. f, APA for extended loops. Differential APA plots for extended loops compared with wild type (WT). ∆ESCO1 (∆1) cells show an increase in extended loops while ∆HDAC8 (∆8) cells show a decrease. Source data
Fig. 2
Fig. 2. Cohesin acetylation restricts loop length in a WAPL-independent manner.
a, Hi-C contact matrices for G1 cells of the indicated genotypes. A locus at chromosome 5 is shown at 10-kb resolution. Matrices were normalized to 100 million contacts per sample. b, Immunoblot analysis of the indicated genotypes. This experiment was performed twice, with similar results. c, APA for extended loops in the indicated genotypes (top); differential APA plots for extended loops compared with ∆WAPL (∆W) cells (bottom). ∆ESCO1/∆WAPL (∆1/∆W) cells show an increase in extended loops in comparison with ∆WAPL cells. d, Aggregate stripe analysis to quantify signal enrichment emanating from CTCF sites at 100-kb resolution. Both ∆ESCO1 and ∆WAPL cells display longer stripes in comparison with wild-type cells, although stripes are extended even further in ∆ESCO1/∆WAPL cells. Source data
Fig. 3
Fig. 3. Cohesin acetylation converts cohesin into a PDS5A-bound state.
a, Schematic overview of the setup of the haploid genetic screen, comparing control HAP1 cells with ∆HDAC8 HAP1 cells. This genome-wide genetic screen involves the infection of haploid HAP1 cells with a gene-trap virus, leading to a polyclonal collection of knockout cells. Intronic insertion of the gene trap in a sense orientation creates a knockout of the affected gene, while intronic insertion in the antisense orientation does not affect it. If loss of a gene is beneficial for cellular outgrowth, sense insertions will be enriched over time. b, Plot depicting screen results for wild-type and ∆HDAC8 cells. Each dot represents one gene. The percentage of sense integrations in comparison to the total amount of insertions shows the importance of each gene for cell viability. Upward shift in the cloud indicates that loss of PDS5A is beneficial specifically for ∆HDAC8 cells. c, Pulldown experiment on the core cohesin subunit SMC1, revealing an increase in PDS5A binding to cohesin in ∆HDAC8 (∆8) cells. This experiment was performed three times, with similar results. Source data
Fig. 4
Fig. 4. Cohesin acetylation controls loop length through PDS5A.
a, Immunoblot analysis of the indicated genotypes. This experiment was performed three times, with similar results. b, Hi-C contact matrices for G1 cells of the indicated genotypes. A locus at chromosome 5 is shown at 10-kb resolution. Matrices were normalized to 100 million contacts per sample. c, APA for primary loops (top). The bottom row displays differential APA plots for primary loops in ∆HDAC8 (∆8) cells, ∆PDS5A (∆5A) cells and ∆HDAC8/∆PDS5A (∆8/∆5A) cells in comparison with wild-type (WT) cells. ∆PDS5A and ∆HDAC8/∆PDS5A cells show a decrease in primary loops. d, APA for extended loops (top). The bottom row displays differential APA plots for extended loops compared with wild type. ∆HDAC8 cells show a decrease in extended loops; this defect was rescued following deletion of PDS5A. ∆PDS5A and ∆HDAC8/∆PDS5A cells both show an increase in extended loops. e, Aggregate stripe analysis to quantify signal enrichment emanating from CTCF sites at 100-kb resolution. Deletion of PDS5A in ∆HDAC8 cells rescued the shorter interactions found in ∆HDAC8 cells. Source data
Fig. 5
Fig. 5. Model of how the cohesin acetylation cycle controls chromatin loop length.
a, Cohesin acetylation regulates the size of architectural stripes and loops. Our data support a model in which ESCO1 acetylates SMC3 to pause cohesin looping while HDAC8 deacetylates cohesin to promote further loop enlargement. b, Cohesin acetylation converts cohesin into a PDS5A-bound state. We propose that this PDS5A binding to cohesin could inactivate cohesin’s ATPase to pause the looping process. Deacetylation by HDAC8 could alleviate this brake to restart the looping reaction.
Extended Data Fig. 1
Extended Data Fig. 1. The looping defect of ∆HDAC8 cells is ESCO1-dependent.
(a) The 10% smallest cells were sorted to obtain G1 cells. FACS plots showing the DNA content of unsorted (asynchronous) and sorted (G1) cells. Cells were fixed and stained with DAPI. (b) Aggregate stripe analysis to quantify the signal enrichment emanating from CTCF sites at 100-kb resolution. The architectural stripe phenotype is observed in independent clones. (c) APA analysis reveals that the extended loop phenotype is also observed in independent clones. Differential APA plots for extended loops compared to wild type (WT). ∆ESCO1 (∆1) cells show an increase in extended loops. ∆HDAC8 (∆8) cells show a decrease in extended loops. (d) Western blot analysis of the indicated genotypes. This experiment was performed twice with similar results. (e) Aggregate stripe analysis to quantify the signal enrichment emanating from CTCF sites at 100-kb resolution. The short stripes in ∆HDAC8 cells are rescued upon ESCO1 deletion. This phenotype is also observed in a replicate Hi-C experiment in an independent ∆ESCO1/∆HDAC8 clone (dashed line). (f) Hi-C contact matrices for asynchronous cells of the indicated genotypes. A locus at chromosome 2 is shown at 10-kb resolution. Matrices were normalized to 100 million contacts per sample. (g) APA for extended loops. Differential APA plots for extended loops compared to wild type (WT). Asynchronous ∆HDAC8 (∆8) cells show a decrease in extended loops. (h) Aggregate stripe analysis to quantify the signal enrichment emanating from CTCF sites at 100-kb resolution. Asynchronous ∆HDAC8 cells display shorter stripes in comparison to asynchronous wild type cells. Source data
Extended Data Fig. 2
Extended Data Fig. 2. Hi-C replicates in G1 cells.
(a) Aggregate peak analysis (APA) reveals that the extended loop phenotype is also observed in a replicate Hi-C experiment. ∆ESCO1/∆WAPL cells show an increase in extended loops in comparison to ∆WAPL cells. (b) The extended stripe phenotypes for ∆WAPL and ∆ESCO1/∆WAPL cells are also observed in a replicate Hi-C experiment. The aggregate stripe analysis quantifies the signal enrichment emanating from CTCF sites at 100-kb resolution. (c) APA plots show that the extended loop phenotypes are also observed in a replicate Hi-C experiment. For ∆PDS5A (∆5A) cells we used an independent clone, for ∆HDAC8/∆PDS5A (∆8/∆5A) cells we used the same clone. (d) The extended stripe phenotypes for ∆PDS5A and ∆HDAC8/∆PDS5A cells are also observed in a replicate Hi-C experiment in the clones described in (c). The aggregate stripe analysis quantifies the signal enrichment emanating from CTCF sites at 100-kb resolution. (e) APA in an independent ∆PDS5B clone confirms that PDS5B does not regulate the formation of extended loops. (f) Hi-C analysis in an independent ∆PDS5B clone confirms that PDS5B does not regulate the length of architectural stripes.
Extended Data Fig. 3
Extended Data Fig. 3. Haploid genetic screen in ∆HDAC8 cells.
(a) Plot depicting the screen results for wild type cells and ∆HDAC8 cells. Several cohesin regulators are highlighted. (b) Gene-trap integration patterns for PDS5A in anti-sense (blue) or sense (red) orientation in wild type and ∆HDAC8 cells. ∆HDAC8 cells harbour an increase in sense insertions along the entire gene. (c) Gene-trap integration patterns for SCC2NIPBL in anti-sense (blue) or sense (red) orientation in wild type and ∆HDAC8 cells. The sense insertions in ∆HDAC8 cells appear to be tolerated until exon 10, while exons 11 - 47 appear to remain essential. This pattern much resembles the pattern found in ∆WAPL cells. (d) Pulldown experiment on the core cohesin subunit SMC1 in cells lacking ESCO1 (∆1) or HDAC8 (∆8). We find that cohesin in ∆HDAC8 cells is enriched for binding to PDS5A, PDS5B, and WAPL. Cohesin’s binding to these factors appears to be less evidently affected in ∆ESCO1 cells. We note that in wild type cells only a small fraction of cohesin complexes is acetylated. These low acetylation levels could explain why it is relatively difficult to assess differences in binding of the mentioned proteins in ∆ESCO1 cells. This experiment was performed 3 times with similar results. (e) Pulldown experiment on the cohesin regulator SCC2NIPBL in cells lacking ESCO1 (∆1) or HDAC8 (∆8). The upper three rows belong to one experiment and the lower two rows to another experiment. Both a short exposure (se) and long exposure (le) are shown for the core cohesin subunit SMC1. We find that the amount of cohesin acetylation does not affect SCC2NIPBL binding to cohesin. We also find that SCC2NIPBL pulls along acetylated cohesin complexes, suggesting that cohesin acetylation and cohesin’s binding to SCC2NIPBL are not mutually exclusive. This experiment was performed 3 times with similar results. Source data
Extended Data Fig. 4
Extended Data Fig. 4. PDS5B does not control chromatin looping in HAP1 cells.
(a) Hi-C contact matrices for G1 cells of the indicated genotypes. A locus at chromosome 5 is shown at 10-kb resolution. Matrices were normalized to 100 million contacts per sample. ∆PDS5B cells do not display chromatin looping defects. (b) Aggregate stripe analysis to quantify the signal enrichment emanating from CTCF sites at 100-kb resolution. PDS5B does not control the length of stripes. (c) Aggregate peak analysis (APA) for primary loops. PDS5B does not regulate primary loops. (d) APA for extended loops. ∆PDS5B cells do not show an increase in extended loops. (e) The RNA read counts of PDS5A and PDS5B in wild type HAP1 cells, from. Mean and standard deviation are shown of three biological replicates (grey circles depict replicates). (f) The PSM counts of PDS5A and PDS5B in whole cell proteomics in wild type HAP1 cells. Mean and standard deviation are shown of three biological replicates (grey circles depict replicates). (g) Western blot analysis of wild type and ∆PDS5A cells with either untagged or tagged SCC1-HALO. (h) Quantification of the FRAP experiment in SCC1-HALO tagged G1 cells. Mean and standard deviation for 17 wild type cells and 17 ∆PDS5A cells, measured over 5 independent experiments. (i) Example images of cells used in (h) at the indicated time points after photobleaching. White scale bar is 5 µm. Note that the ∆PDS5A cells display a ‘vermicelli’-like SCC1 localization. (j) Western blot analysis of wild type and ∆PDS5B cells with either untagged or tagged SCC1-HALO. (k) Quantification of the FRAP experiment in SCC1-HALO tagged G1 cells. Mean and standard deviation for 12 wild type cells and 12 ∆PDS5B cells, measured over 4 independent experiments. (l) Example images of cells used in (k) at the indicated time points after photobleaching. White scale bar is 5 µm. Source data
Extended Data Fig. 5
Extended Data Fig. 5. Overview Hi-C analyses of different genotypes.
(a) Hi-C contact matrices for G1 cells of the indicated genotypes. A locus at chromosome 4 is shown at 10-kb resolution. Matrices were normalized to 100 million contacts per sample. (b) Hi-C contact matrices for G1 cells of the indicated genotypes. A locus at chromosome 4 is shown at 10-kb resolution. Matrices were normalized to 100 million contacts per sample. These Hi-C libraries were less deeply sequenced than the Hi-C libraries presented in (a). (c) Aggregate peak analysis (APA) for primary loops using the same scale for all genotypes. The bottom right value depicts the APA score. (d) APA for extended loops using the same scale for all genotypes. The bottom right value depicts the APA score.

References

    1. Davidson IF, et al. DNA loop extrusion by human cohesin. Science. 2019;366:1338–1345. doi: 10.1126/science.aaz3418. - DOI - PubMed
    1. Kim Y, Shi Z, Zhang H, Finkelstein IJ, Yu H. Human cohesin compacts DNA by loop extrusion. Science. 2019;366:1345–1349. doi: 10.1126/science.aaz4475. - DOI - PMC - PubMed
    1. Haarhuis JHI, et al. The cohesin release factor WAPL restricts chromatin loop extension. Cell. 2017;169:693–707. doi: 10.1016/j.cell.2017.04.013. - DOI - PMC - PubMed
    1. Wutz G, et al. Topologically associating domains and chromatin loops depend on cohesin and are regulated by CTCF, WAPL, and PDS5 proteins. EMBO J. 2017;36:3573–3599. doi: 10.15252/embj.201798004. - DOI - PMC - PubMed
    1. Gassler J, et al. A mechanism of cohesin-dependent loop extrusion organizes zygotic genome architecture. EMBO J. 2017;36:3600–3618. doi: 10.15252/embj.201798083. - DOI - PMC - PubMed

Publication types