. 2022 Jun 16;13(1):3466.
doi: 10.1038/s41467-022-31142-5.

Single-cell profiling of the antigen-specific response to BNT162b2 SARS-CoV-2 RNA vaccine

Affiliations

Single-cell profiling of the antigen-specific response to BNT162b2 SARS-CoV-2 RNA vaccine

Kevin J Kramer et al. Nat Commun. .

Abstract

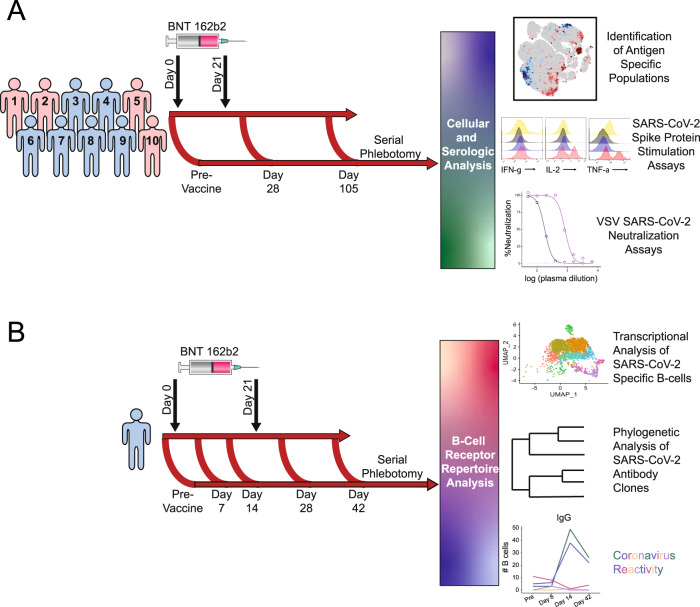
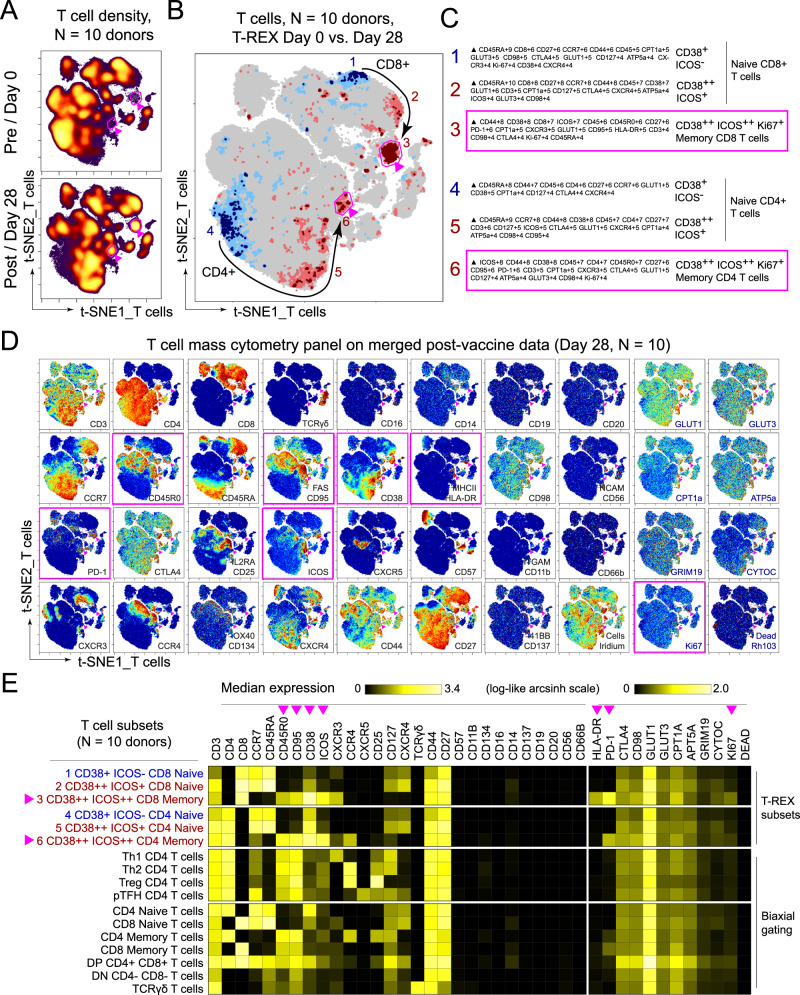
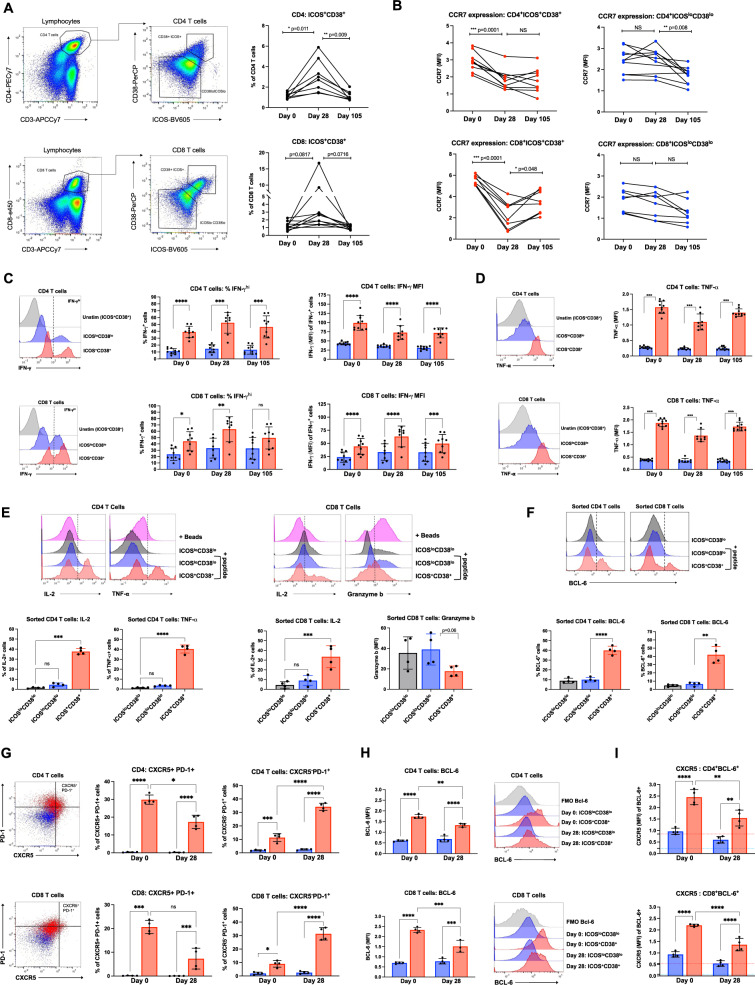
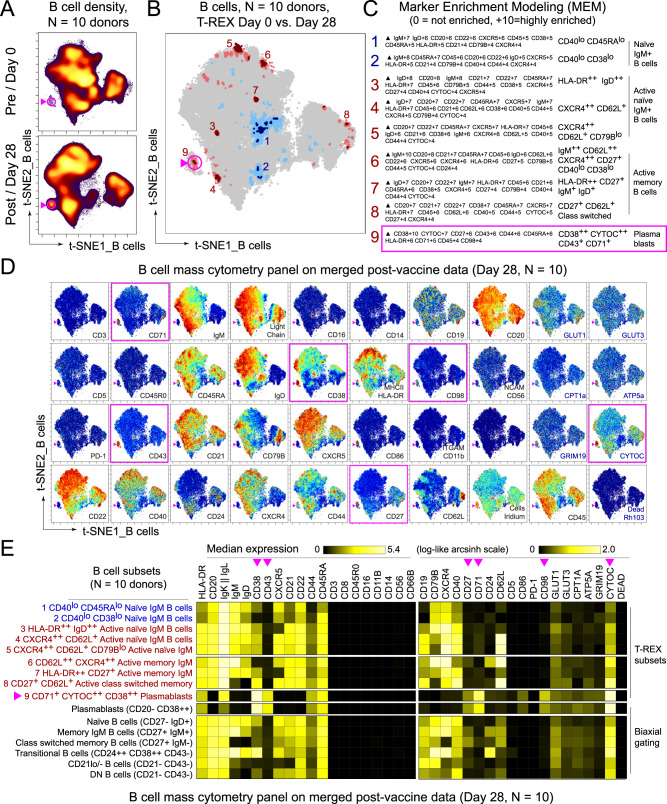
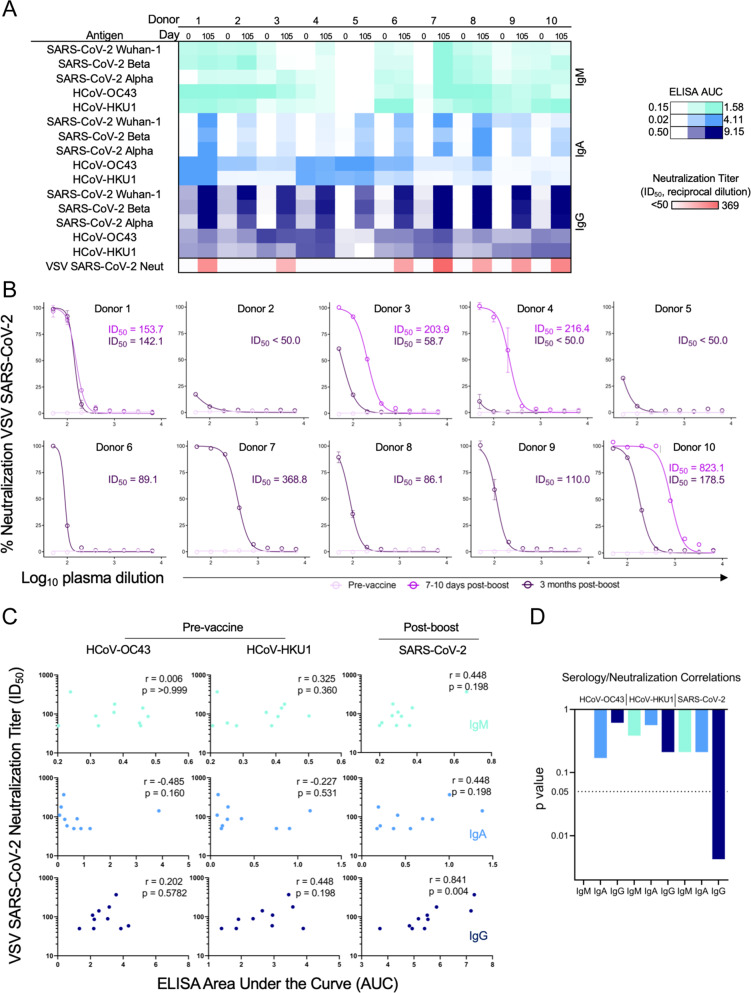
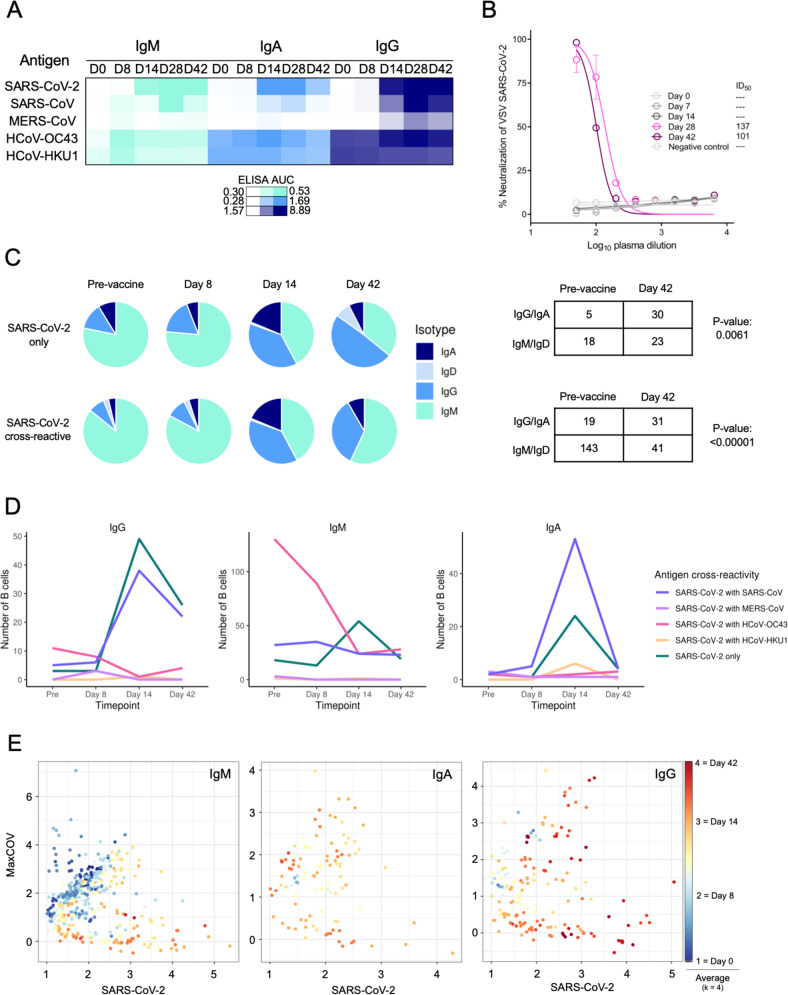
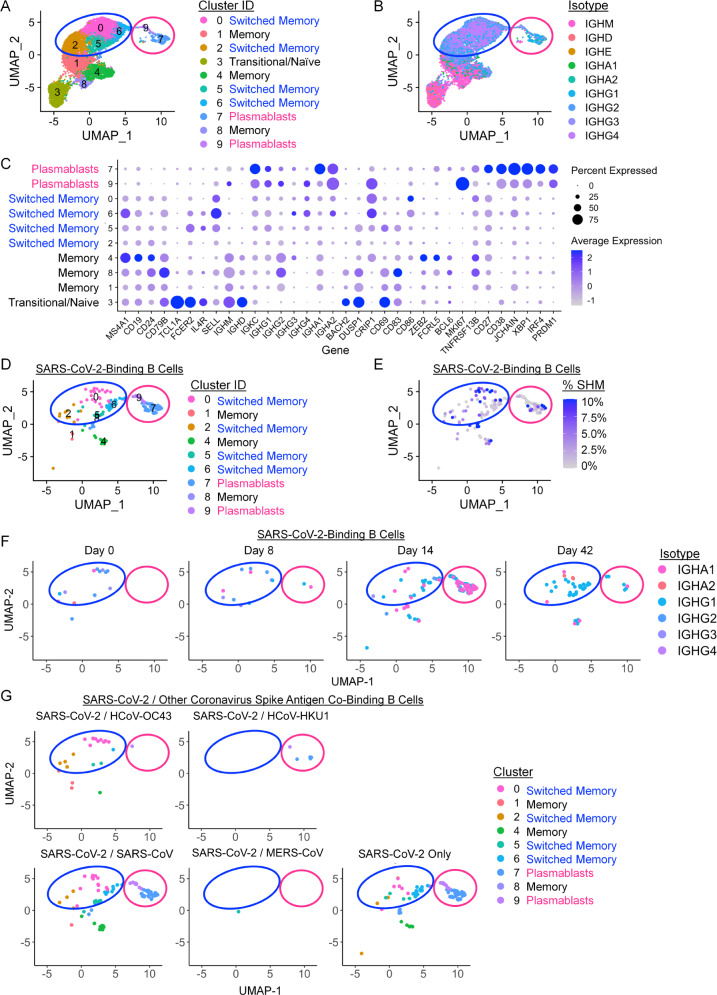
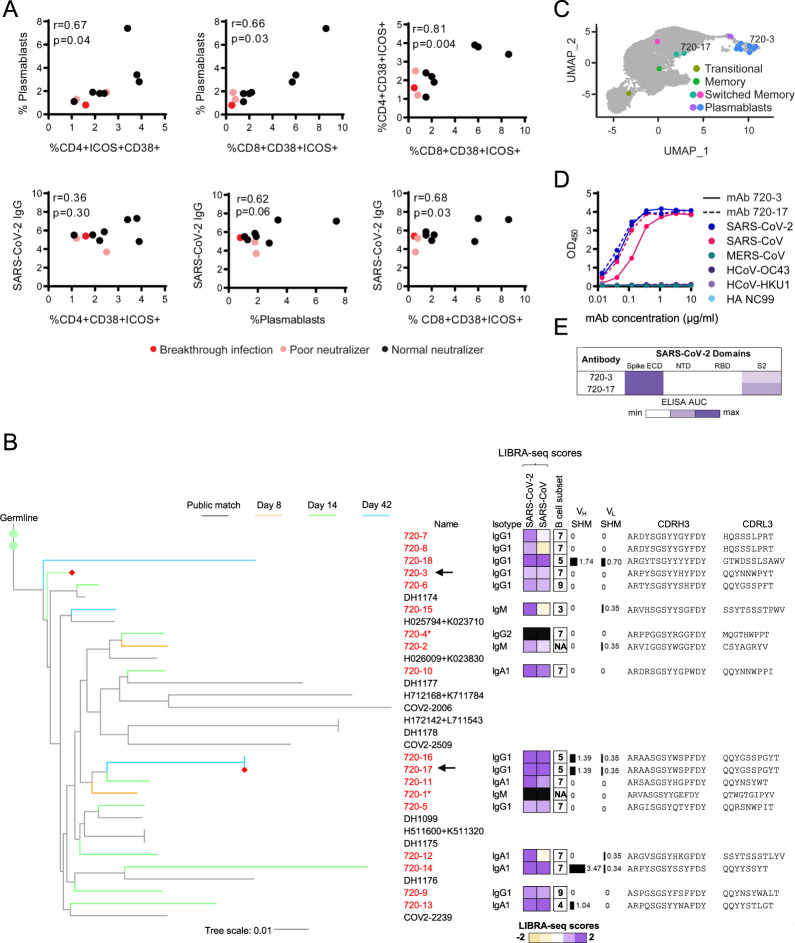
RNA-based vaccines against SARS-CoV-2 have proven critical to limiting COVID-19 disease severity and spread. Cellular mechanisms driving antigen-specific responses to these vaccines, however, remain uncertain. Here we identify and characterize antigen-specific cells and antibody responses to the RNA vaccine BNT162b2 using multiple single-cell technologies for in depth analysis of longitudinal samples from a cohort of healthy participants. Mass cytometry and unbiased machine learning pinpoint an expanding, population of antigen-specific memory CD4+ and CD8+ T cells with characteristics of follicular or peripheral helper cells. B cell receptor sequencing suggest progression from IgM, with apparent cross-reactivity to endemic coronaviruses, to SARS-CoV-2-specific IgA and IgG memory B cells and plasmablasts. Responding lymphocyte populations correlate with eventual SARS-CoV-2 IgG, and a participant lacking these cell populations failed to sustain SARS-CoV-2-specific antibodies and experienced breakthrough infection. These integrated proteomic and genomic platforms identify an antigen-specific cellular basis of RNA vaccine-based immunity.


Conflict of interest statement

E.M.W. receives research funding from Boehringer-Ingelheim and is a member of their myositis ILD advisory board. A.R.S. and I.S.G. are co-founders of AbSeek Bio. R.H.C. is an inventor on patents related to other SARS-CoV-2 antibodies. J.E.C. has served as a consultant for Luna Biologics, is a member of the Scientific Advisory Boards of CompuVax and Meissa Vaccines and is Founder of IDBiologics. J.E.C. has received sponsored research agreements from Takeda Vaccines, IDBiologics and AstraZeneca. J.M.I. was a co-founder and a board member of Cytobank Inc. and has engaged in sponsored research with Incyte Corp, Janssen, Pharmacyclics. J.C.R. is a founder, scientific advisory board member, and stockholder of Sitryx Therapeutics, a scientific advisory board member and stockholder of Caribou Biosciences, a member of the scientific advisory board of Nirogy Therapeutics, has consulted for Merck, Pfizer, and Mitobridge within the past three years, and has received research support from Incyte Corp., Calithera Biosciences, and Tempest Therapeutics. No other author declares any competing interests.

Figures

Fig. 1
Fig. 1. Schematic of vaccination schedule and sample collection.
All participants were vaccinated with BNT162b2 on days 0 and 21 and samples were collected early in 2021. A 10 healthy participants underwent serial phlebotomy that was performed pre-vaccination (day −3 to 0), on day 28–30, and on day 105-108. PBMCs were isolated at each time point, and citrated plasma was stored when possible. PBMCs from these participants were utilized for CyTOF and in vitro stimulation studies. Plasma was used both for SARS-CoV-2 ELISAs and vesicular stomatitis virus pseudoneutralization assays. B A single healthy participant underwent serial phlebotomy pre-vaccination and on days 8, 14, 28, and 42. PBMCs and citrated plasma were isolated at each time point and used for transcriptional analysis of SARS-CoV-2-specific B cells.
Fig. 2
Fig. 2. Immune phenotyping of BNT162b2 responding T cells.
PBMCs collected from study participants (n = 10) pre-vaccination (day 0), and day 28 post-vaccination (7 days post-boost) were analyzed individually by mass cytometry in one setting to avoid batch effects, and data were concatenated for analysis. A CD3+ T cells from 10 participants were pooled into two sets, one for pre-vaccination (taken at day 0) and one for post-vaccination (day 28). Cell density for each set is shown on the t-SNE axes. B T-REX analysis of the CD3+ T cells from the 10 participants is shown. A central t-SNE, performed only using cell surface markers, shaded by T-REX change depicts phenotypically similar cells in regions of great expansion (dark red, ≥95% from post-vaccination day 28) or great contraction (dark blue, ≥95% from pre-) over time following SARS-CoV-2 vaccination. Red or blue population interpretations are shown for major expanding or contracting populations identified by T-REX. C MEM labels show enriched protein features for several populations of great expansion or contraction. All measured features were included in MEM enrichment labels, which only show features enriched by at least +4 on a scale from 0 to 10. Pink boxes are around the MEM labels for the CD4+ and CD8+ memory T-cell clusters that are greatly enriched for ICOS and CD38 protein and expanded greatly following vaccination. D Each protein marker is shown on t-SNE axes, with proteins that were enriched on CD4+ICOS+CD38+ and CD8+ICOS+CD38+ cells in pink boxes. A rainbow intensity scale indicates expression levels with red representing high and dark blue representing low expression. Protein names in blue indicate functional features that were not used in t-SNE analysis, including metabolic markers, Rhodium, and Ki67. Surface proteins in black were used in t-SNE analysis. E Heat maps show all markers measured by mass cytometry for cell populations as determined by T-REX or expert gating. Cell labels in red were defined by T-REX as expanding and blue were defined as contracting by T-REX. Black cell labels were expert gated. Protein markers enriched in CD4+ICOS+CD38+ and CD8+ICOS+CD38+ cells are indicated with pink arrows.
Fig. 3
Fig. 3. Functional analysis of ICOS+CD38+ CD4+ and CD8+ T cells and response to SARS-CoV-2 Spike antigen.
PBMCs collected from study participants (n = 10) pre-vaccination (day 0), day 28 post-vaccination (7 days post-boost), and day 105 post-vaccination were examined for ICOS, CD38, and other markers by fluorescence flow cytometry individually in one setting to avoid batch variation. A CD4+ T cells were gated from lymphocytes and defined as ICOS+CD38+ or ICOSloCD38lo. Percentages of CD4+ICOS+CD38+ T cells were quantified and data from each participant is connected by lines. B Mean fluorescence intensity (MFI) of CCR7 within CD4+ICOS+CD38+, CD8+ICOS+CD38+, CD4+ICOSloCD38lo, or CD8+ICOSloCD38lo T cells. C, D PBMCs were stimulated with PMA/ionomycin and examined for cytokine production. T cells defined as ICOS+CD38+ (red) or ICOSloCD38lo (blue) were examined for C IFN-γ or D TNF. Representative samples on the left and individual participants are shown on right. E Day 28 PBMC samples were stimulated with activation beads or T cells were sorted based on CD38 and ICOS expression. Sorted T cells were labeled with CellTrace Violet (CTV) to track and stimulated with T-cell (CD3)-depleted autologous PBMCs ± SARS-CoV-2 Spike peptide pool (+ peptide, blue and red). Sorted T-cell populations were analyzed after 48 h for IL-2, TNF, and Granzyme b in F. BCL6 expression in sorted T-cell populations, stimulated as in E. G Tfh markers CXCR5 and PD-1 compared on day 0 and 28 samples. H Unstimulated days 0 and 28 ICOS+CD38+ and ICOSloCD38lo T cells were analyzed for BCL6 expression (FMO; fluorescence-minus-one control for BCL6). I CXCR5 MFI within BCL6+ T cells. FMO control for BCL6 in ICOSloCD38lo T cells is shown by the blue dotted line, and by the red dotted line for ICOS+CD38+ T cells. B Significance was determined by paired two-way ANOVA mixed-effects model. E, F Repeated measures one-way ANOVA. C, D, GI Two-way ANOVA with Sidak’s multiple comparisons test. Representative samples are shown and each data point represents an individual participant. All error bars ± SD. ns = not significant, *p < 0.5, **p < 0.005, ***p < 0.0005, ****p < 0.00005.
Fig. 4
Fig. 4. Immune phenotyping of BNT162b2 responding B cells.
PBMCs collected from study participants (n = 10) pre-vaccination (day 0), day 28 post-vaccination (7 days post-boost) were individually by mass cytometry in one setting to avoid batch effects, and data were concatenated for analysis of expanded B-cell subsets and plasmablasts. A B cells from 10 participants were pooled into two sets, one for pre-vaccination (taken at day 0) and one for post-vaccination (day 28). Cell density for each set is shown on the t-SNE axes. B T-REX analysis of the B cells from the 10 participants is shown. A central t-SNE, performed only using cell surface markers, shaded by T-REX change depicts phenotypically similar cells in regions of great expansion (dark red, ≥95% from post-vaccination day 28) or great contraction (dark blue, ≥95% from pre-) over time following SARS-CoV-2 vaccination. Red or blue population interpretations are shown for major expanding or contracting populations identified by T-REX. C MEM labels show enriched protein features for several populations of great expansion or contraction. All measured features were included in MEM enrichment labels, which only show features enriched by at least +4 on a scale from 0 to 10. A pink box is around the MEM label for the plasmablast cluster that expanded greatly following vaccination. D Each protein marker is shown on t-SNE axes, with proteins that were enriched on the plasmablast population in pink boxes. A rainbow intensity scale indicates expression levels with red representing high and dark blue representing low expression. Protein names in blue indicate functional features that were not used in t-SNE analysis, including metabolic markers, Rhodium, and Ki67. Surface proteins in black were used in t-SNE analysis. E Heat maps show all markers measured by mass cytometry for cell populations as determined by T-REX or expert gating. Cell labels in red were defined by T-REX as expanding and blue were defined as contracting by T-REX. Black cell labels were expert gated. Protein markers enriched in plasmablasts are indicated with pink arrows.
Fig. 5
Fig. 5. Serologic response induced by BNT162b2.
Sera were analyzed from healthy participants (n = 10) pre-vaccination and at day 105 in one setting to avoid batch variation. A Log ELISA area under the curve (AUC) values from vaccine recipient plasma are depicted as a heatmap against spike proteins from SARS-CoV-2 Wuhan-1, SARS-CoV-2 Alpha, SARS-CoV-2 Beta, HCoV-OC43, and HCoV-HKU1 coronaviruses. The minimum signal is represented in white and the maximum signal is depicted by teal, blue, and navy blue for IgM, IgA, and IgG, respectively. At the bottom of the serology heatmap, the inhibitory dose at 50% neutralization (ID50) neutralization titer at the day 105 time point is depicted from zero neutralization (white) to the maximum Log ID50 value quantified in the participants. ELISAs were performed in technical duplicate and repeated once; neutralization assays were performed once in technical triplicate. B VSV SARS-CoV-2 neutralization curves of vaccine recipient plasma. Pre-vaccine, 7–10 days post-boost (collected only from participants 1, 3, 4, and 10), and 105 days post-boost are depicted in light pink, pink, and purple, respectively. %Neutralization (y-axis) is plotted as a function of log plasma dilution (x axis). Assays were done in technical triplicate. C Spearman correlations for serological responses as log ELISA AUC (x-axis) of patient cohort against pre-vaccination HCoV-OC43 (left), HCoV-HKU1 (middle), and post-boost SARS-CoV-2 (right) as a function of neutralization titer expressed as ID50 (y axis). IgM is depicted in teal (top), IgA is shown in blue (middle), and IgG is shown in navy blue (bottom). The respective rho and p values are shown in the top right of each plot. D Individual statistical significance comparison values are depicted as a bar graph for HCoV-OC43, HCoV-HKU1, and SARS-CoV-2 (left to right). IgM is depicted in teal, IgA is shown in blue, and IgG is shown in navy blue. All error bars are mean ± standard deviation.
Fig. 6
Fig. 6. LIBRA-seq characterization of the antigen specificity of the SARS-CoV-2-reactive B-cell response to BNT162b2.
A single participant with multiple longitudinal samples was analyzed for serological response and individual B-cell selectivity by LIBRA-seq. A Plasma log ELISA area under the curve (AUC) values are depicted as a heatmap against spike proteins for SARS-CoV-2, SARS-CoV, MERS-CoV, HCoV-OC43, and HCoV-HKU1. The minimum signal is represented in white and the maximum signal is depicted by teal, blue, and navy blue for IgM, IgA, and IgG, respectively. Assays were performed in technical duplicates and repeated once. B VSV SARS-CoV-2 neutralization of longitudinal timepoints. % Neutralization (y-axis) is plotted as a function of plasma dilution (x axis). The negative control sample, Day 0, Day 8, and Day 14 timepoints are depicted in gray, with Day 28 and Day 42 curves shown in pink and purple respectively. The inhibitory dose at 50% neutralization (ID50) values of each timepoint is denoted to the right of graph. Assays were performed in technical triplicate and performed once. C Pie charts representing: (top) SARS-CoV-2-specific B cells with an associated LIBRA-seq score ≥1 for SARS-CoV-2; and (bottom) SARS-CoV-2 cross-reactive B cells (bottom) with an associated LIBRA-seq score ≥1 for SARS-CoV-2 and for at least one other coronavirus antigen (MERS-CoV, SARS-CoV, HCoV-OC43, or HCoV-HKU1). For the pre-vaccine, day 8, day 14, and day 42 time points, the segments in each pie chart represent the number of antibody sequences with the isotypes IgD (light blue), IgM (teal), IgG (blue), IgA (navy blue). Also shown are a statistical comparison of isotype distribution of SARS-CoV-2-specific (top) and SARS-CoV-2 cross-reactive (bottom) B cells in the pre-vaccine and day 42 post-vaccination time points. The values in each table represent the number of antibody sequences with the designated isotypes. D Evolution of cross-reactive SARS-CoV-2 and SARS-CoV-2-only B cells from each isotype (separate plots) over time. Each line shows the number of B cells (y axis) for either SARS-CoV-2-only (blue) or SARS-CoV-2 cross-reactive with other coronaviruses (designated colors) B cells at the four timepoints (x axis). E Individual IgM, IgA, and IgG-expressing cells graphed for cumulative cross-reactive (MaxCOV) and SARS-CoV-2 LIBRA-seq scores shaded based on k = 4 nearest neighbors averaging for the time of sample collection. All error bars are mean ± standard deviation.
Fig. 7
Fig. 7. BNT162b2 vaccination drives IgG and IgA-switched SARS-CoV-2-binding memory B-cell and plasmablast expansion.
B cells that bound a panel of LIBRA-seq antigens were purified from peripheral blood samples and single-cell RNA-seq/BCR-seq/LIBRA-seq data were integrated. Cells were scored positive for binding a given antigen for LIBRA-seq scores ≥1. A UMAP identified clusters of B cells based on transcriptional similarity. Antibody-secreting cells (pink circle encompassing clusters 7 and 9) and isotype-switched memory B cells (blue circle encompassing clusters 0, 2, 5, and 6) are highlighted across all UMAP plots. B BCR isotypes are shown among sorted B cells. C Selected gene expression profiles within each cluster are shown. DF SARS-CoV-2-binding B cells were identified using LIBRA-seq and non-class-switched B cells were filtered out for detailed analysis. D UMAP identified clusters of SARS-CoV-2-binding B cells based on transcriptional similarity. E IgH somatic hypermutation frequency of SARS-CoV-2-binding B cells is indicated. F SARS-CoV-2-binding B-cell isotypes are shown for each time point. G SARS-CoV-2-binding B cells are shown, each panel indicates cells that also bound the indicated coronavirus S antigens.
Fig. 8
Fig. 8. Associations of antigen-specific cell populations and antibody responses.
A Correlation of biaxially gated plasmablast and T-cell populations with other cellular subsets from CyTOF analyses in Figs. 2 and 4 with SARS-CoV-2 IgG using Pearson correlations. Patients with typical neutralization titers are shown in black, poor neutralizers with no known breakthrough infection are shown in pink, and a poor neutralizer with known breakthrough infection is shown in red. B Phylogenetic tree of a public antibody cluster comprised of LIBRA-seq-identified sequences (antibody names: red; branches: colored by timepoint) and previously published SARS-CoV-2 antibody sequences from the CoV-AbDab database (gray), with recombinantly expressed antibodies 720-3 and 720-17 highlighted with a red diamond at the end of their respective branches and arrows. For each sequence from the cluster, sequence features including isotype, LIBRA-seq scores, % SHM of V-gene, and amino acid sequences of CDRH3 and CDRL3 are displayed. Nucleotide level percentage of SHM changes of V-genes of both heavy and light chains were reported as bars with numerical values. LIBRA-seq scores are shown as a range with tan-white-purple representing -2 to 0 to 2. Scores higher or lower than this range are shown as −2 and 2, respectively. The B-cell subsets are classified by scRNA-seq analysis. Sequences denoted by an asterisk (720-1 and 720-2) did not fulfill the cutoff for RNA-seq analysis and therefore were not classified into a B-cell subset. Antibodies 720-1 and 720-4 do not have a computed LIBRA-seq score due to not meeting data filtering criteria, as described in the methods. C Location of B cells in cluster 720 including recombinantly expressed monoclonal antibodies (720-3 and 720-17) on UMAP identified clusters of B cells based on transcriptional similarity. D ELISAs for antibodies selected for monoclonal antibody characterization are shown against spike proteins for SARS-CoV-2 (blue), SARS-CoV (pink), MERS-CoV (teal), HCoV-OC43 (purple), HCoV-HKU1 (light purple), and HA NC99 (light blue) for antibodies 720-3 (solid lines) and 720-17 (dashed lines). E Epitope mapping ELISA AUC for antibodies 720-3 and 720-17 against SARS-CoV-2 spike ECD, and truncated subunit domains NTD, RBD, and S2. ELISAs were performed in technical duplicate and repeated once.

Update of

Similar articles

Cited by

References

    1. Dong E, Du H, Gardner L. An interactive web-based dashboard to track COVID-19 in real time. Lancet Infect. Dis. 2020;20:533–534. doi: 10.1016/S1473-3099(20)30120-1. - DOI - PMC - PubMed
    1. Schulte-Schrepping J, et al. Severe COVID-19 is marked by a dysregulated myeloid cell compartment. Cell. 2020;182:1419–1440.e1423. doi: 10.1016/j.cell.2020.08.001. - DOI - PMC - PubMed
    1. Mathew D, et al. Deep immune profiling of COVID-19 patients reveals distinct immunotypes with therapeutic implications. Science. 2020;369:eabc8511. doi: 10.1126/science.abc8511. - DOI - PMC - PubMed
    1. Koutsakos M, et al. Integrated immune dynamics define correlates of COVID-19 severity and antibody responses. Cell Rep. Med. 2021;2:100208. doi: 10.1016/j.xcrm.2021.100208. - DOI - PMC - PubMed
    1. Arunachalam PS, et al. Systems biological assessment of immunity to mild versus severe COVID-19 infection in humans. Science. 2020;369:1210–1220. doi: 10.1126/science.abc6261. - DOI - PMC - PubMed

Publication types