. 2022 Jun 16;5(1):590.
doi: 10.1038/s42003-022-03537-z.

Molecular and cellular immune features of aged patients with severe COVID-19 pneumonia

Affiliations

Molecular and cellular immune features of aged patients with severe COVID-19 pneumonia

Domenico Lo Tartaro et al. Commun Biol. .

Abstract

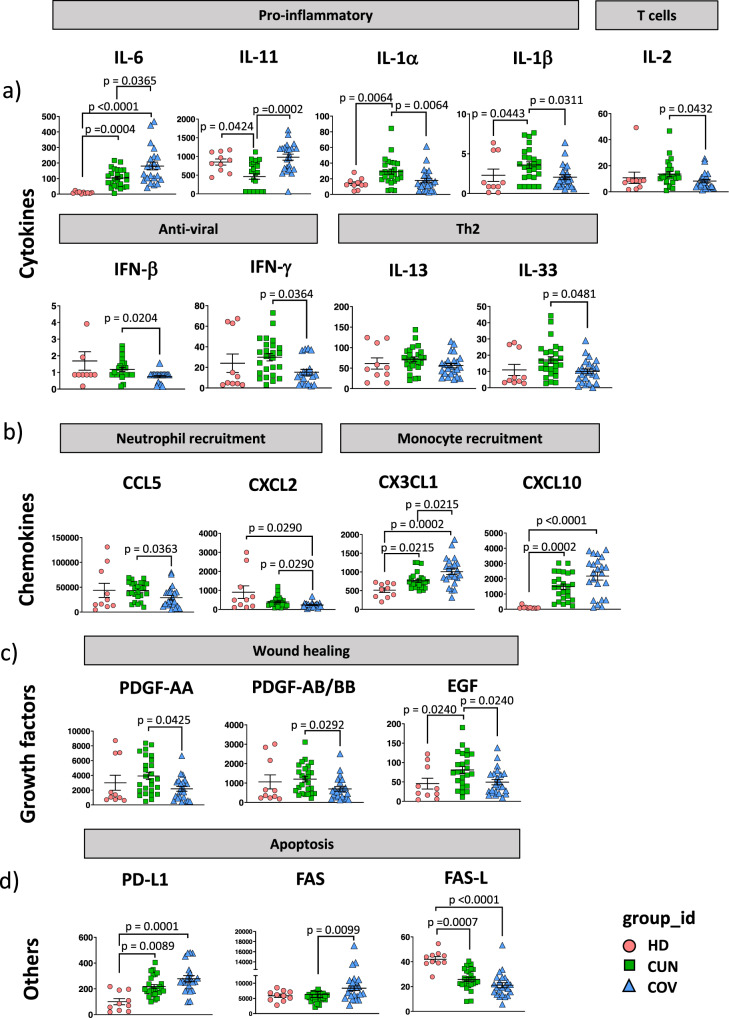
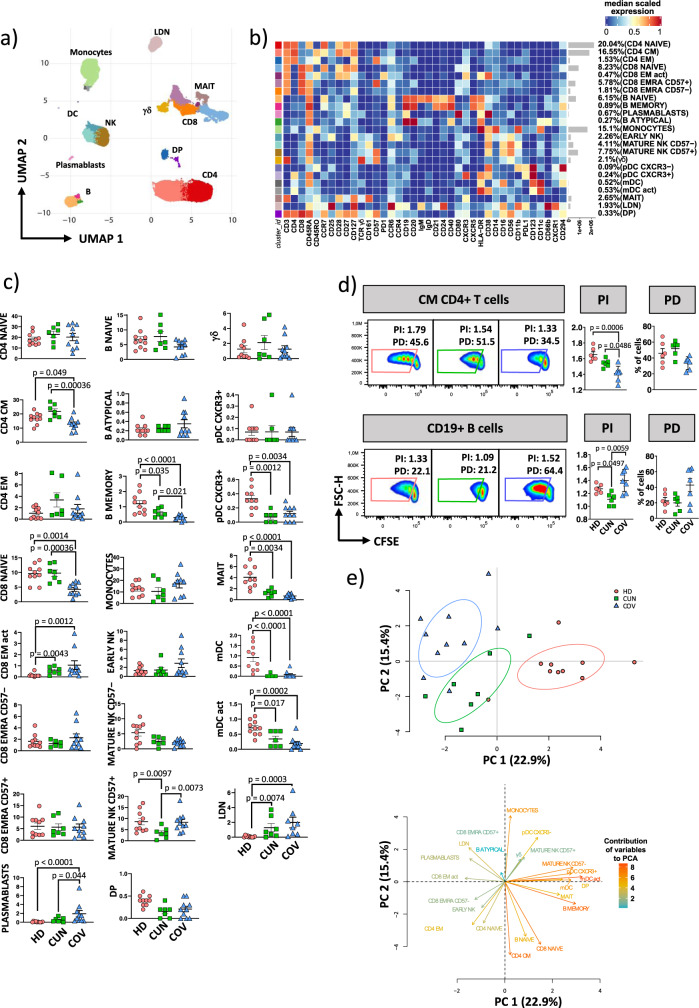
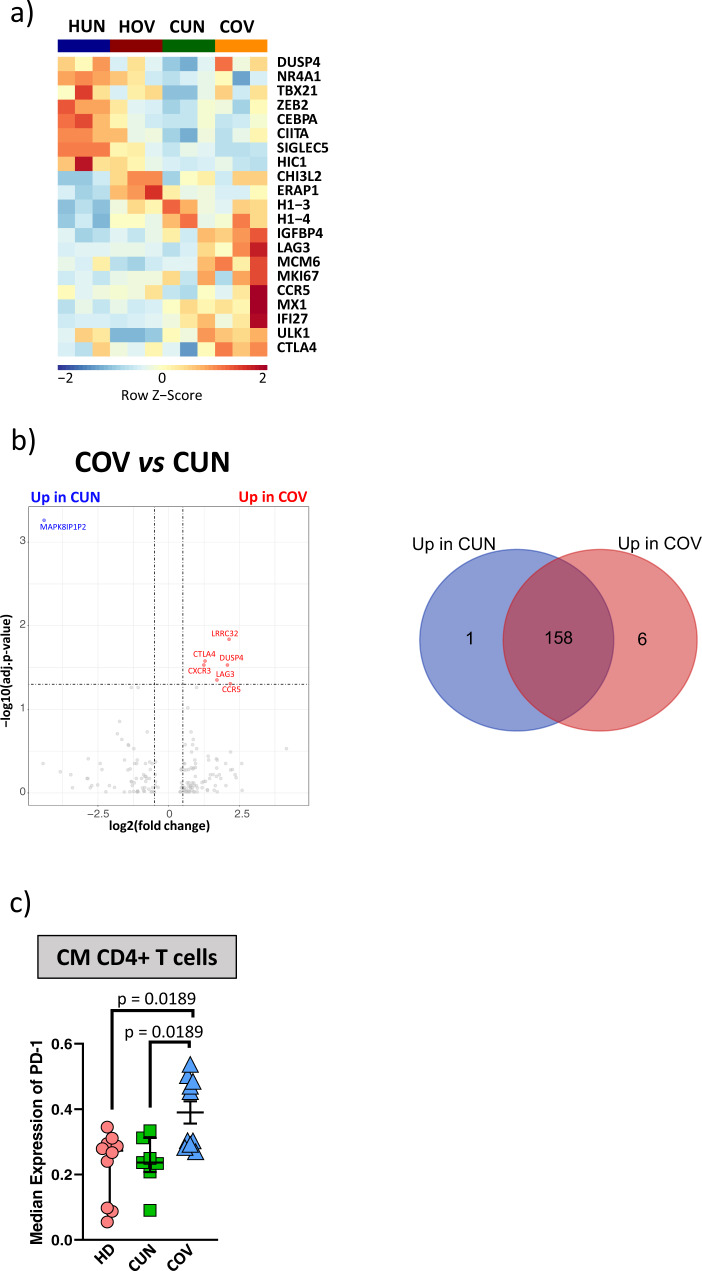
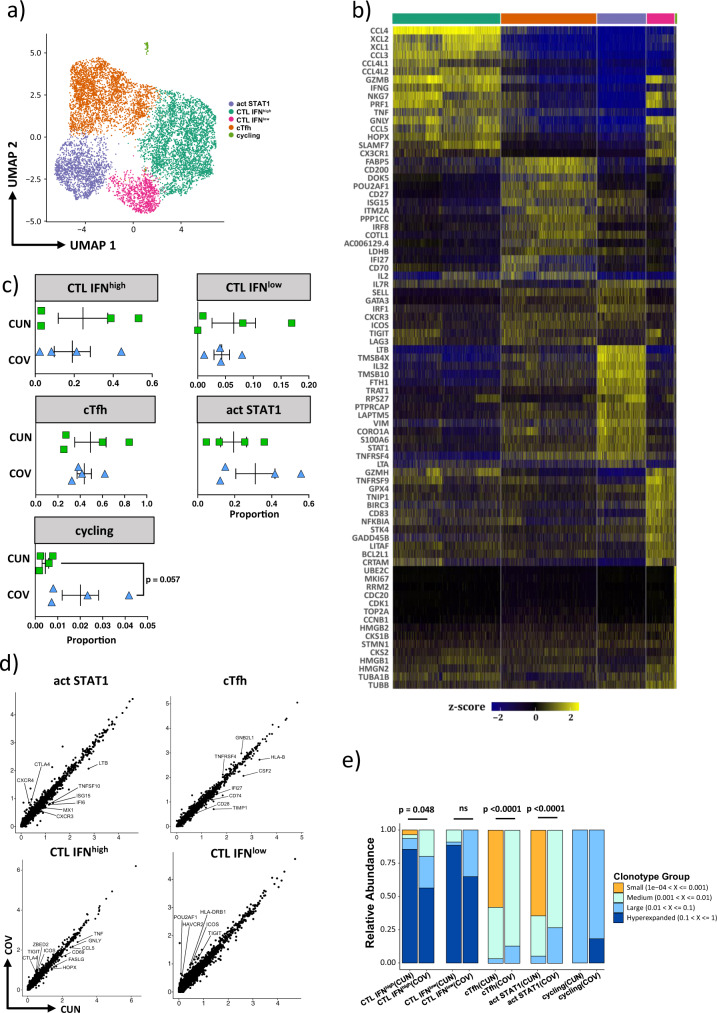
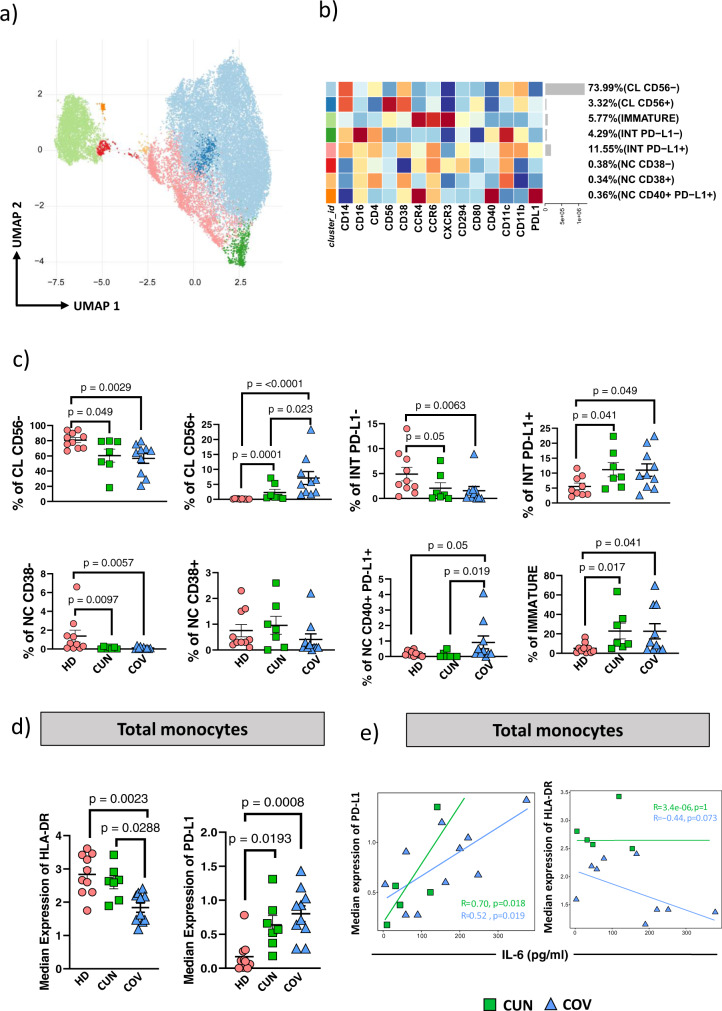
Aging is a major risk factor for developing severe COVID-19, but few detailed data are available concerning immunological changes after infection in aged individuals. Here we describe main immune characteristics in 31 patients with severe SARS-CoV-2 infection who were >70 years old, compared to 33 subjects <60 years of age. Differences in plasma levels of 62 cytokines, landscape of peripheral blood mononuclear cells, T cell repertoire, transcriptome of central memory CD4+ T cells, specific antibodies are reported along with features of lung macrophages. Elderly subjects have higher levels of pro-inflammatory cytokines, more circulating plasmablasts, reduced plasmatic level of anti-S and anti-RBD IgG3 antibodies, lower proportions of central memory CD4+ T cells, more immature monocytes and CD56+ pro-inflammatory monocytes, lower percentages of circulating follicular helper T cells (cTfh), antigen-specific cTfh cells with a less activated transcriptomic profile, lung resident activated macrophages that promote collagen deposition and fibrosis. Our study underlines the importance of inflammation in the response to SARS-CoV-2 and suggests that inflammaging, coupled with the inability to mount a proper anti-viral response, could exacerbate disease severity and the worst clinical outcome in old patients.


Conflict of interest statement

AQ, CP, GA, SD, DL, and JN are employers of Fluidigm Corporation. All other authors declare no competing interests.

Figures

Fig. 1
Fig. 1. Plasma level of cytokines, chemokines and growth factor from young (CUN) and aged (COV) patients with severe COVID-19.
Scatter plots of 19 cytokines and other mediators in plasma obtained from healthy donors (HD, n = 10), CUN (n = 26) and COV (n = 23) subjects. Scatter plots show individual values, mean ± SEM. Kruskal-Wallis test with Benjamini-Hochberg correction for multiple comparisons was used to test the differences among the three groups; p-values are indicated in the figure. The upper bar indicates the function mediated by each plasmatic molecule. a Dotplots show the level of IL-6, IL-11, IL-1α, IL-1β, IL-2, IFN-β, IFN-γ, IL-13 and IL-33. b Dotplots show the level of CCL5, CXCL2, CX3CL1 and CXCL10. c Dotplots show the level of PDGF-AA, PDGF-AB/BB and EGF. d Dotplots show the level of PD-L1, FAS and FAS-L.
Fig. 2
Fig. 2. Deep immune profiling of PBMC from severe COVID-19 patients.
a UMAP plot shows the 2D spatial distribution of 11,153,288 cells from healthy donors (HD, n = 10), CUN (n = 7) and COV (n = 10) embedded with FlowSOM clusters. b Heatmap of the median marker intensities of the 38 lineage markers across the 23 cell populations obtained with FlowSOM algoritm after the manual metaclusters merging. The colors of cluster_id column correspond to the colors used to label the UMAP plot clusters. The color in the heatmap is referred to the median of the arcsinh marker expression (0 to 1 scaled) calculated over cells from all the samples. Blue represents lower expression while red represent higher expression. Light grey bar along the rows (clusters) and values in brackets indicate the relative sizes of clusters. CM central memory, TM transitional memory, EM effector memory, EMRA effector memory re-expressing the CD45RA, NK natural killer cells, γδ T cells expressing the γδ T cell receptor, mDC myeloid dendritic cells; pDC plasmacytoid dendritic cells; MAIT mucosal associated invariant T cells; LDN low density neutrophils; DP double positive CD4 + CD8 + T lymphocytes. c Dotplots show the relative cells percentage of the 23 clusters among healthy donors (HD; salmon circles; n = 10), CUN (green squares; n = 7) and COV patients (blue triangles; n = 10). The central bar represents the mean ± SEM. The statistical relevant adjusted p-values obtained by GLMM statistical test comparing CUN and COV cluster percentages are reported in the figure. d Carboxyfluorescein diacetate succinimidyl ester (CFSE) dilution in CM CD4+ T and CD19+ B cells of HD (salmon), CUN (green) and COV (blue) samples after 16 hours of stimulation with 1 μg/mL of anti-CD3 plus anti-CD28. (Left) Dotplots show representative CFSE dilution in HDs, CUN and COV samples; (Right) paired dotplots show the proliferation index (PI) and percentage of divided cells (PD) of HD (salmon, n = 6), CUN (green, n = 6) and COV (blue, n = 7) samples after stimulation. Kruskal-Wallis test with Benjamini-Hochberg correction for multiple comparisons was used to test the differences among the three groups; p-values are indicated in the figure. The central bar represents the mean ± SEM. e (Top) Principal component analysis (PCA) using the percentage of clusters from HDs, CUN and COV subjects obtained by unsupervised analysis of PBMCs (see Fig. 2a). HD, salmon circles (n = 10); CUN, green squares (n = 7) and COV, blue triangles (n = 10); (Bottom) Contribution of the different variables to PCA. The color of the arrows underlines the contribution level, while the position underlines the positive or negative contribution. Negatively correlated variables are positioned on opposite sides of the plot origin (opposed quadrants).
Fig. 3
Fig. 3. Transcriptomic analysis of sorted central memory (CM) CD4+ T cells.
a Heatmap showing the selection of 21 immune-related differential expressed genes (DEGs) in sorted CM CD4+ T of young healthy subjects (HUN, n = 3), aged healthy subjects (HOV, n = 3), CUN (n = 3) and COV (n = 3). Z-scores were calculated for each row (each gene) and used for the graphical visualization. b Left panel: volcano plot shows the DEGs among CM CD4+ T cells from COV and CUN patients. The genes upregulated in these cells from COV are in red, while those upregulated in CM CD4+ T cells from CUN in blue (thresholds: FDR < 0.05 and log2FC > 0.5). Right panel: Venn diagram shows data summary of DEGs between CUN (blue circle) and COV (red circle). c Dotplot shows the surface median expression (number of molecules) of the PD-1 on CM CD4+ T cells from CUN and COV patients. The CM CD4+ T lymphocytes were selected from CyTOF unsupervised analysis (shown in Fig. 2). The central bar represents the mean ± SEM. Dashed line represents the median expression of the PD-1 on CM CD4+ T cells from HDs. Kruskal-Wallis test with Benjamini-Hochberg correction for multiple comparisons was used to test the differences among the three groups; p-values are indicated in the figure.
Fig. 4
Fig. 4. CD4+ T cells reclustering.
a UMAP plot shows the 2D spatial distribution of 4,252,208 cells from healthy subjects (HD, n = 0), CUN (n = 7) and COV (n = 10) embedded with FlowSOM clusters. b CD4+ T cells heatmap shows the median marker intensities of the 15 lineage markers across the 22 cell populations obtained with FlowSOM after the manual metaclusters merging. The color in the heatmap is referred to the median of the arcsinh marker expression (0 to 1 scaled) calculated over cells from all the samples. Blue represents lower expression while red represent higher expression. Lightgrey bar along the rows (clusters) and values in brackets indicate the relative sizes of clusters. CM, central memory; TM, transitional memory; EM, effector memory; EMRA, effector memory re-expressing the CD45RA; eTreg, effector T regulatory CD4+ T cells; cTfh, circulating T follicular helper cells. The black bar on the right is used to group subpopulations with similar immunophenotype backbone. c Dotplots show the relative cell percentage of the 22 clusters among healthy donors (HD; salmon circles; n = 10), CUN (green squares; n = 7) and COV (azure triangles; n = 10). The central bar represents the mean ± SEM. GLMM test was used for the statistical analysis. Exact p-values are reported in the figure.
Fig. 5
Fig. 5. Single cell transcriptomic analysis of CD4+CD154+CD69+ T cells.
a UMAP plot shows the distribution of 8959 SARS-CoV-2-specific cells from CUN (n = 4) and COV (n = 4) patients. b Heatmap displays scaled-expression values of discriminative gene set per cluster related to CD4+CD154+CD69+ T cells that passed quality control. A list of the most representative genes is shown for each cluster (left). The upper bar colors were matched with those reported in the UMAP. Activated STAT1+ (act STAT1); cytotoxic T cells (CTL); circulating T follicular helper (cTfh). c Dotplots show the proportion of each cluster among CUN and COV patients. The central bar represents the mean ± SEM. Mann-Whitney U-test. d Dotplots reporting the DEGs among CUN and COV samples within each cluster. No DEGs were reported between cycling cells of CUN and COV (threshold: FDR < 0.01 and log2FC > 0.3). e Occupied repertoire space for each scRNA-seq cluster among CUN and COV patients. Changes in the frequencies of hyperexpanded (for CTL IFNhigh and IFNlow) and rare (for cTfh and act STAT1) clones between CUN and COV were assessed using Mann-Whitney U-test; exact p-values are reported in the figure.
Fig. 6
Fig. 6. Monocytes reclustering in CUN and COV patients.
a UMAP plot shows the 2D spatial distribution of 1,608,200 cells from healthy subjects (HD, n = 10), CUN (n = 7) and COV (n = 10) embedded with FlowSOM clusters. b Monocytes heatmap shows the median marker intensities of the 14 lineage markers across the 8 cell populations obtained with FlowSOM after the manual metaclusters merging. Lightgrey bar along the rows (clusters) and values in brackets indicate the relative sizes of clusters. CL classical monocytes, INT intermediate monocytes, NC non-classical monocytes. c Dotplots show the relative cells percentage of the 8 clusters among healthy donors (HD; salmon circles; n = 10), CUN (green squares; n = 7) and COV (azure triangles; n = 10). The central bar represents the mean ± SEM. GLMM test was used for the statistical analysis. Exact p-values are reported in the figure. d Dotplots show the surface median expression (number of molecules) of the HLA-DR and PD-L1 on total monocytes among CUN and COV patients. Total monocytes were selected from CyTOF unsupervised analysis (Fig.2). The central bar represents the mean ± SEM. Kruskal-Wallis test with Benjamini-Hochberg correction for multiple comparisons was used to test the differences among the three groups; p-values are indicated in the figure. e Spearman correlation between plasmatic IL-6 and PD-L1 median expression on total monocytes in both CUN and COV patients (left); Spearman correlation between the plasmatic IL-6 and median expression of the HLA-DR on total monocytes in both CUN and COV patients (right).
Fig. 7
Fig. 7. Spatial landscape of lung tissue from young and aged COVID-19 patients.
a Collagen type I distribution in lung images of CUN (n = 3; ROI = 31) and COV (n = 3; ROI = 30). Scale bar 200 µm. The sample name and the region of interest (ROI) are indicated. b Collagen type I mean intensity in images from CUN and COV patients. The central bar represents the mean ± SEM. Mann–Whitney U-test was used for the statistical analysis. Exact p-value is reported in the figure. c Spatial distribution of macrophages expressing CD68 (red dots) and activated macrophages simultaneously expressing CD68 and vimentin (yellow dots). Scale bar 200 µm. The sample name and the region of interest (ROI) are indicated. d Abundance of macrophages (top) and the fraction of activated macrophages (bottom) in lung images of CUN and COV patients. The central bar represents the mean ± SEM. Mann–Whitney U-test was used for the statistical analysis. Exact p-value is reported in the figure.

References

    1. Bajaj V, et al. Aging, Immunity, and COVID-19: how age influences the host immune response to coronavirus infections? Front Physiol. 2020;11:571416. doi: 10.3389/fphys.2020.571416. - DOI - PMC - PubMed
    1. Tian J, et al. Clinical characteristics and risk factors associated with COVID-19 disease severity in patients with cancer in Wuhan, China: a multicentre, retrospective, cohort study. Lancet Oncol. 2020;21:893–903. doi: 10.1016/S1470-2045(20)30309-0. - DOI - PMC - PubMed
    1. Franceschi C, et al. Inflamm-aging. an evolutionary perspective on immunosenescence. Ann. N. Y Acad. Sci. 2000;908:244–254. doi: 10.1111/j.1749-6632.2000.tb06651.x. - DOI - PubMed
    1. Franceschi C, et al. Successful immunosenescence and the remodelling of immune responses with ageing. Nephrol. Dial. Transpl. 1996;11:18–25. doi: 10.1093/ndt/11.supp9.18. - DOI - PubMed
    1. Mueller AL, McNamara MS, Sinclair DA. Why does COVID-19 disproportionately affect older people? Aging. 2020;12:9959–9981. doi: 10.18632/aging.103344. - DOI - PMC - PubMed

Publication types