. 2022 Jul;54(7):950-962.
doi: 10.1038/s41588-022-01097-w. Epub 2022 Jun 16.

Epigenomic and transcriptomic analyses define core cell types, genes and targetable mechanisms for kidney disease

Affiliations

Epigenomic and transcriptomic analyses define core cell types, genes and targetable mechanisms for kidney disease

Hongbo Liu et al. Nat Genet. 2022 Jul.

Abstract

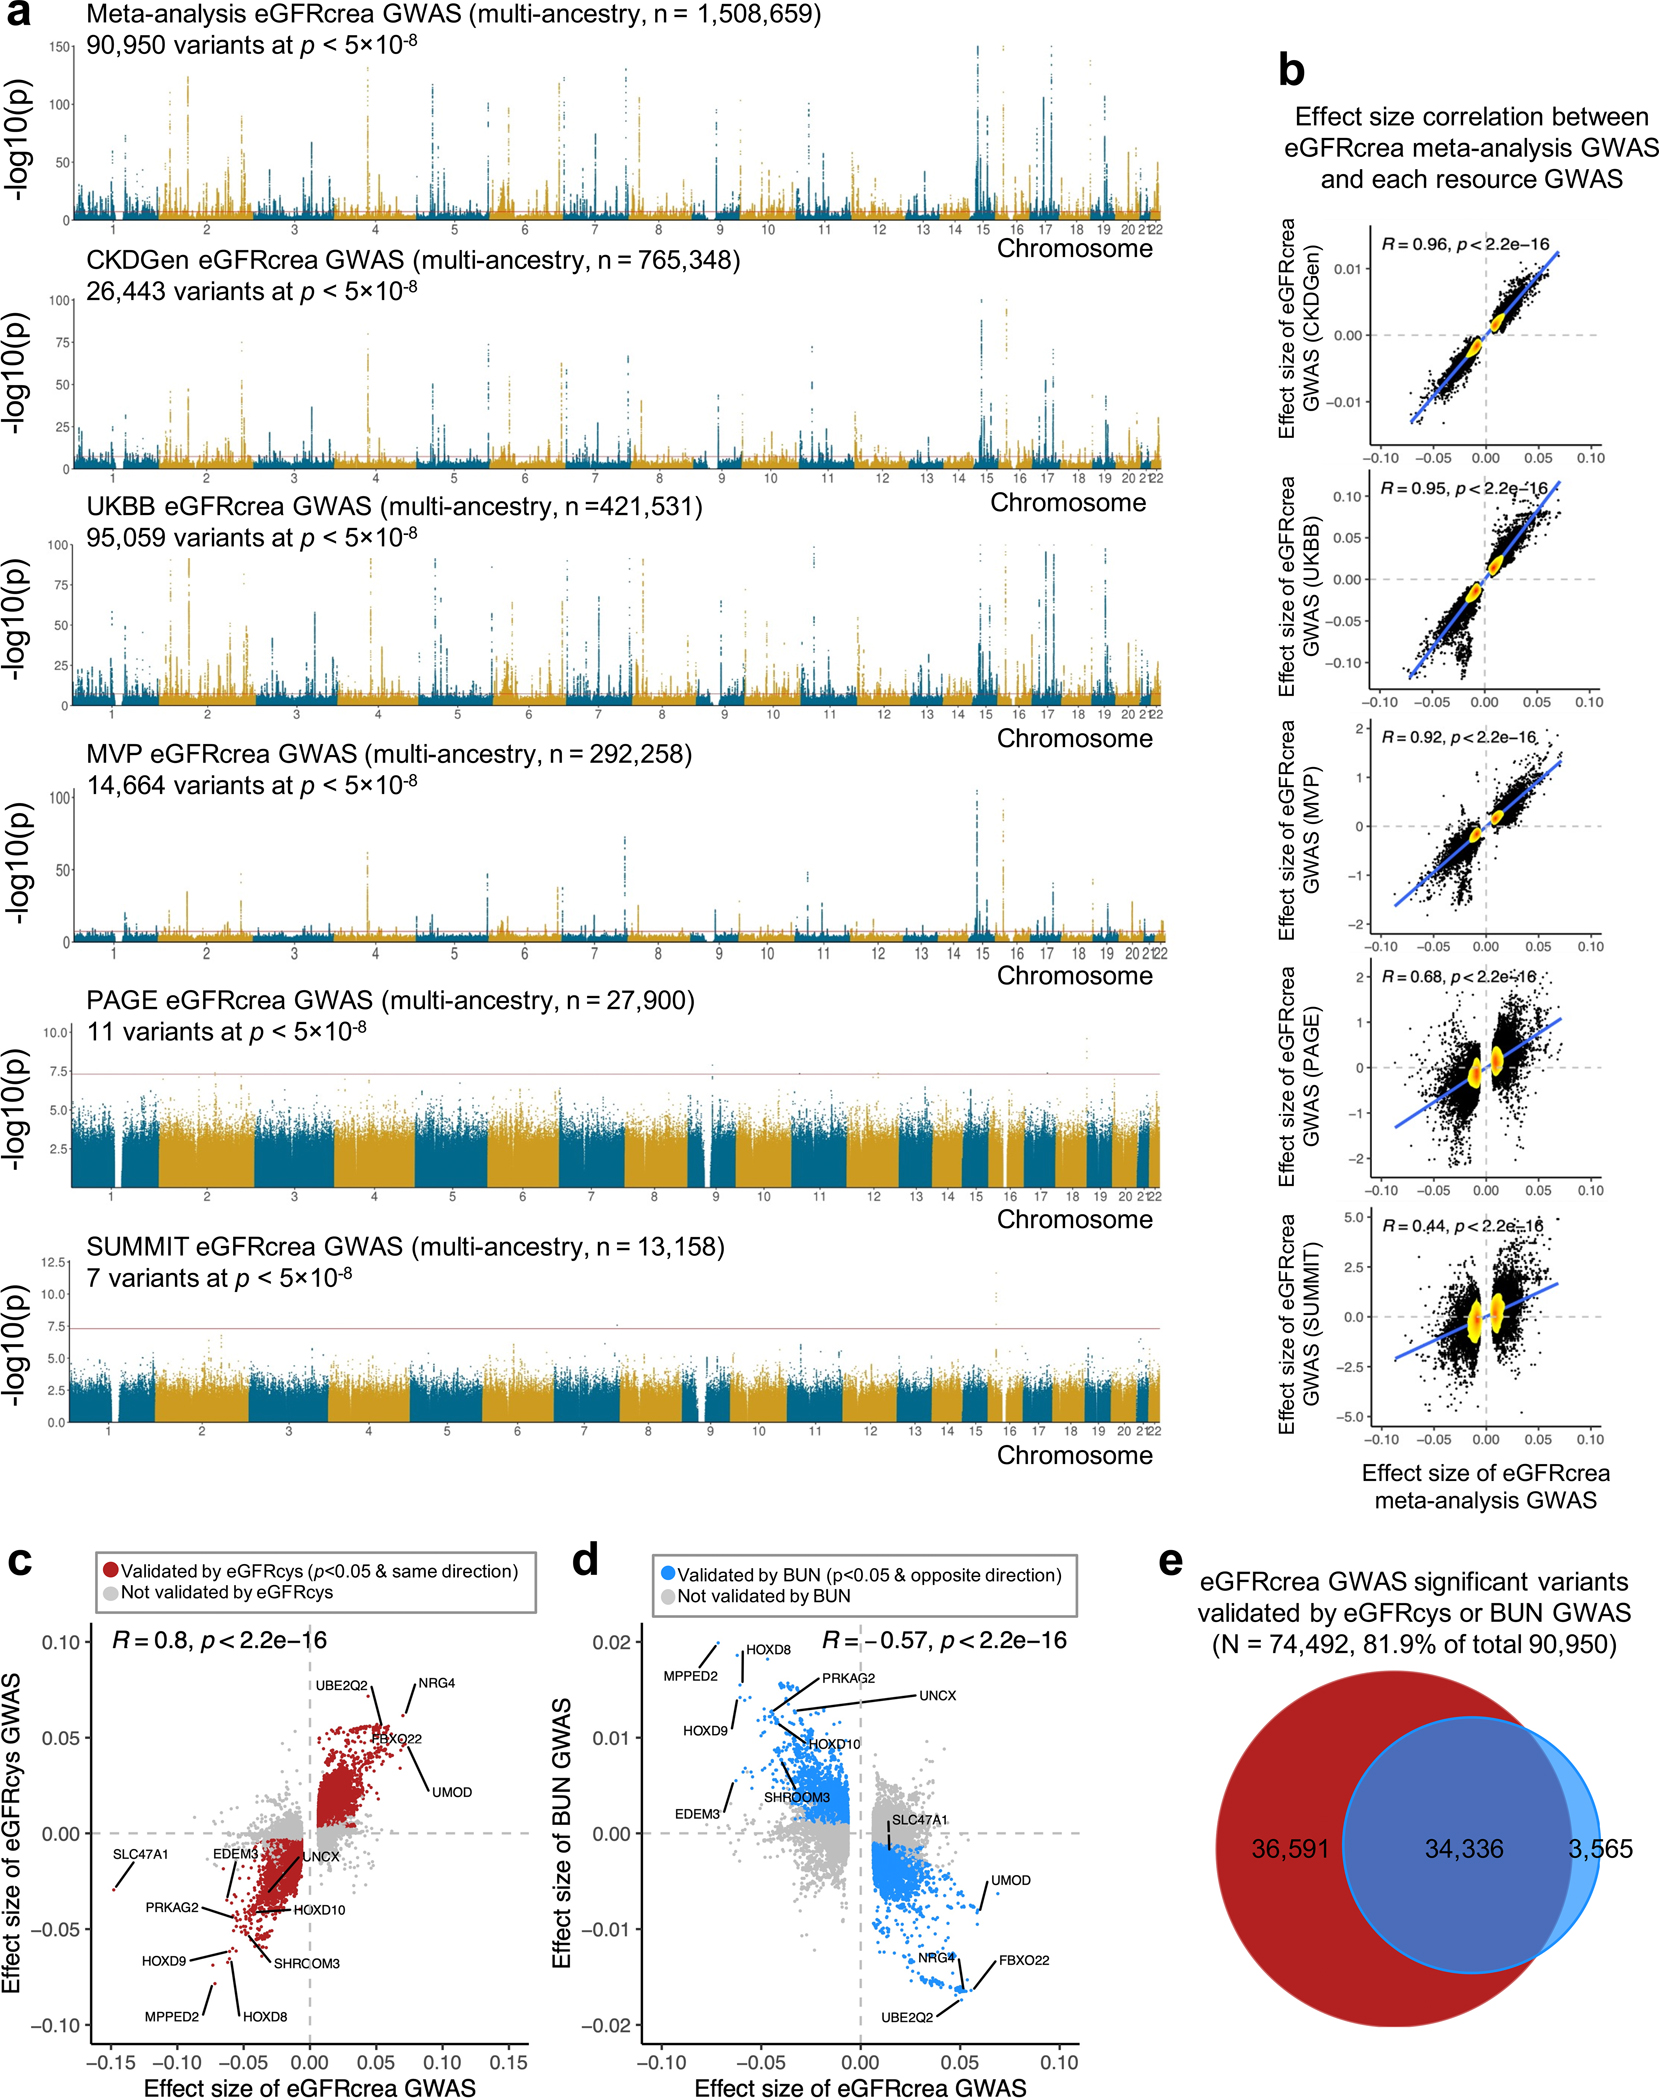
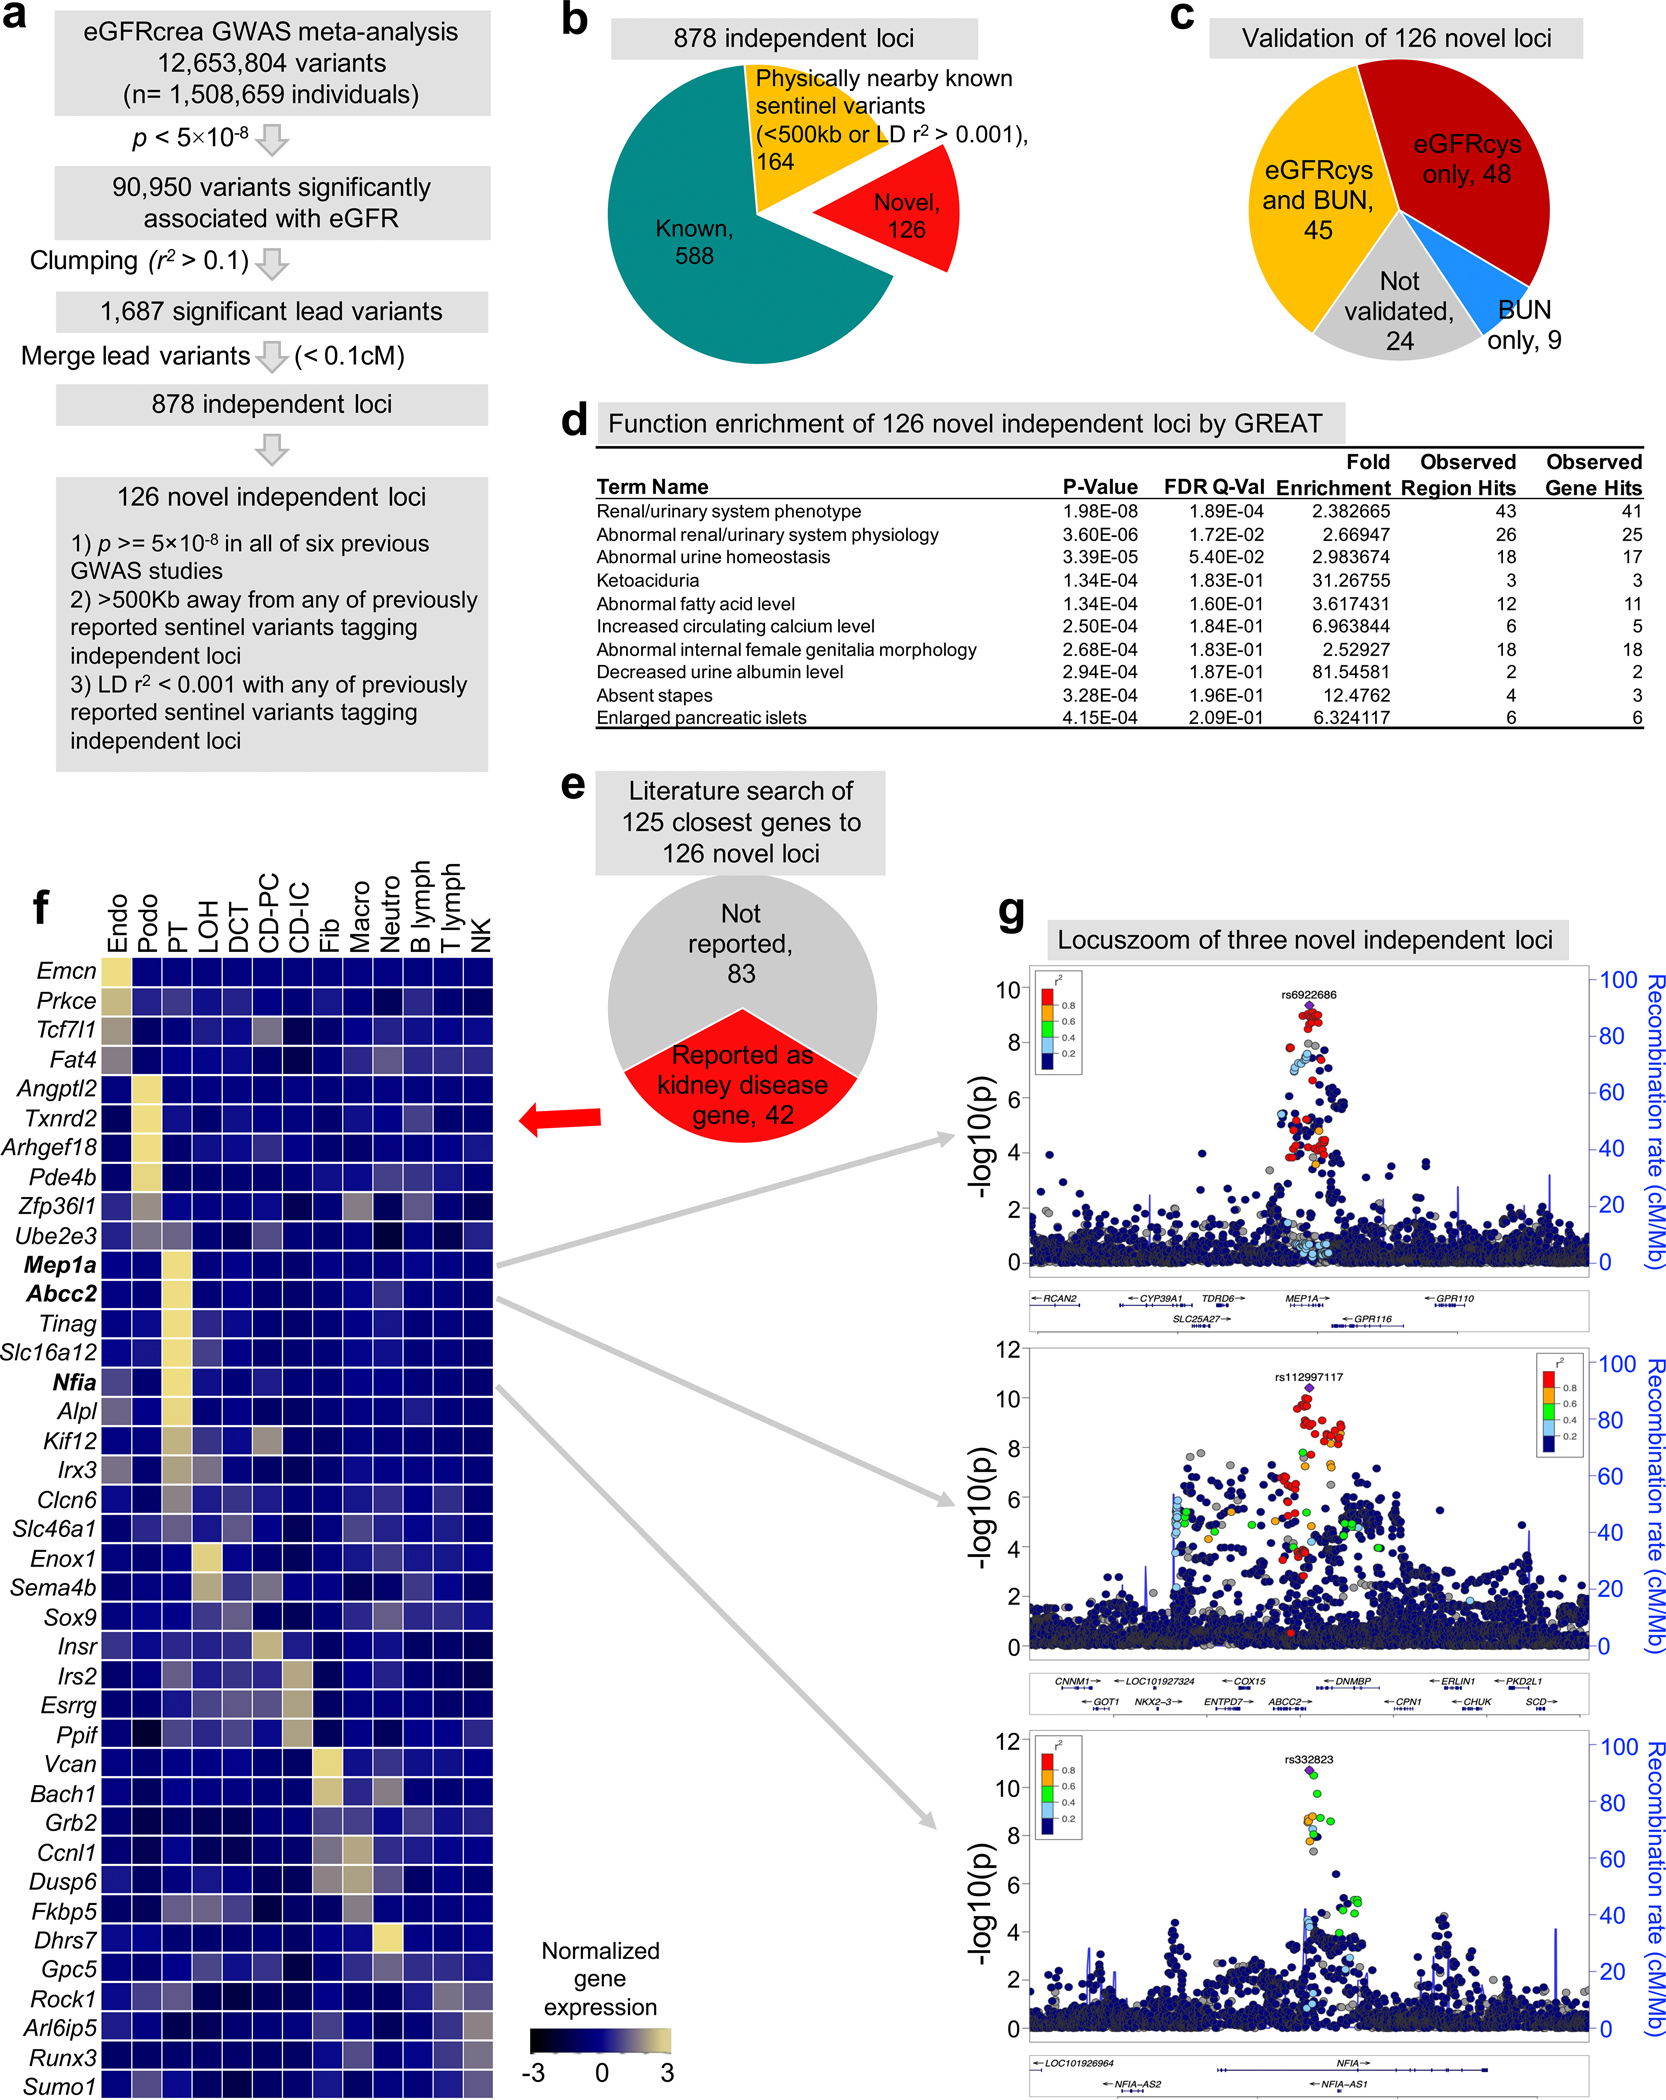
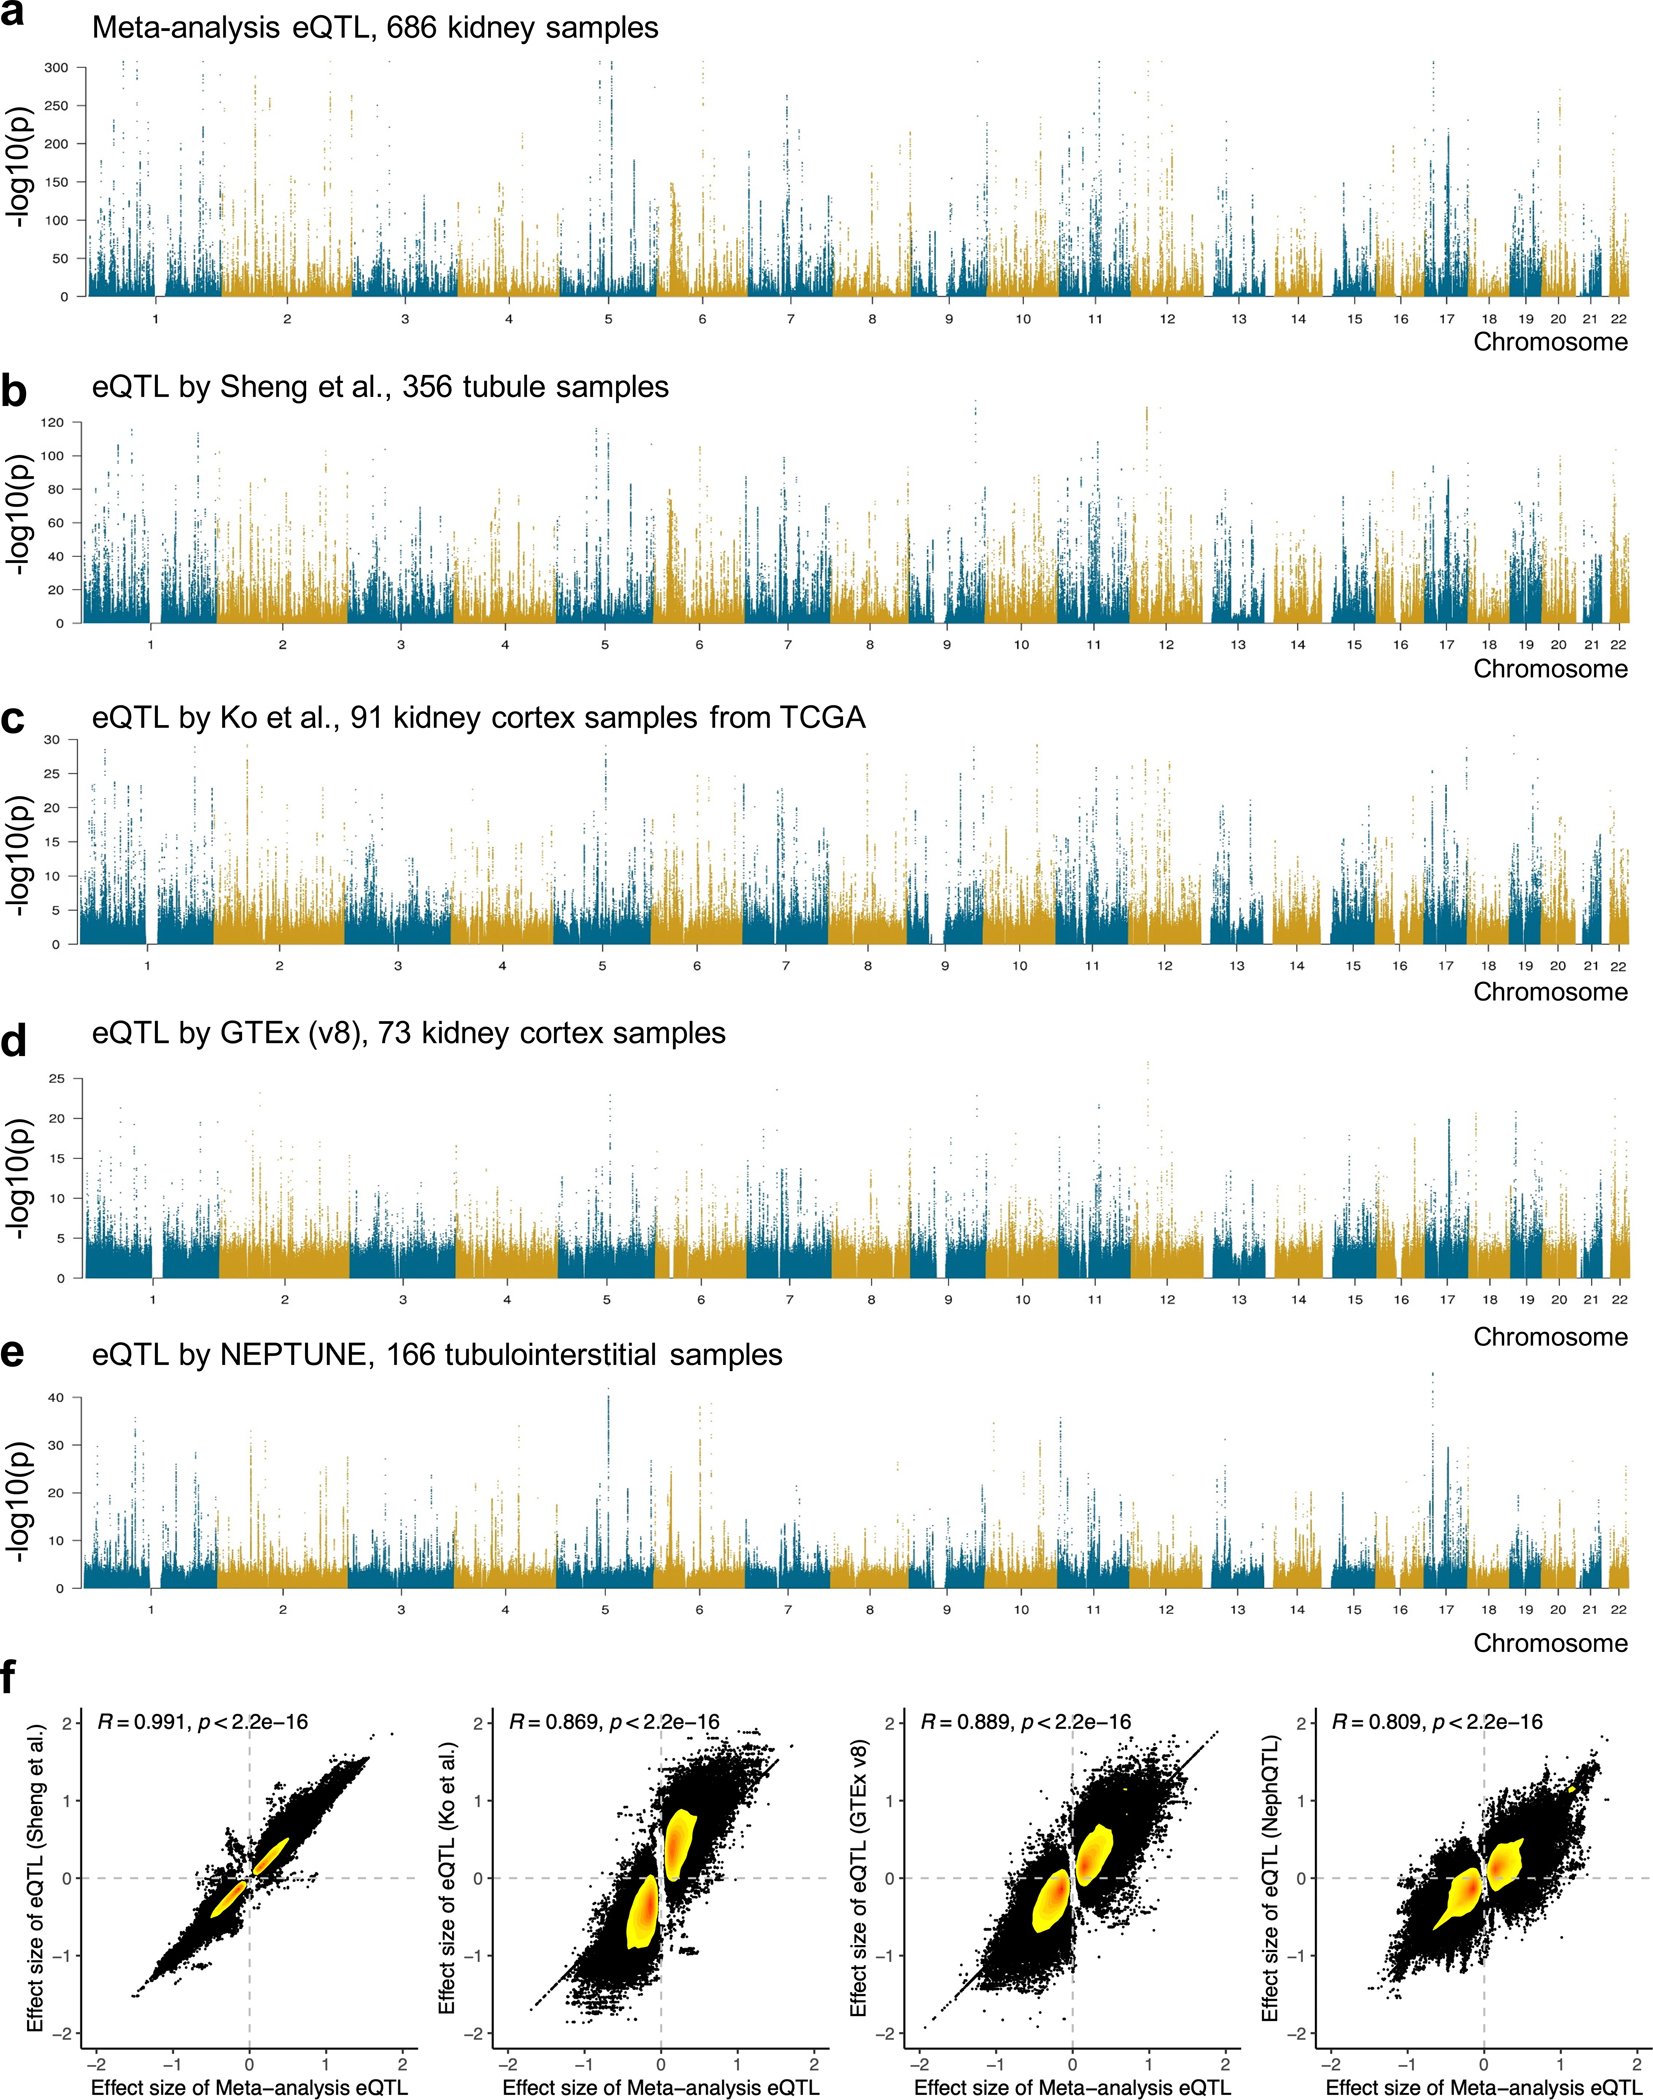
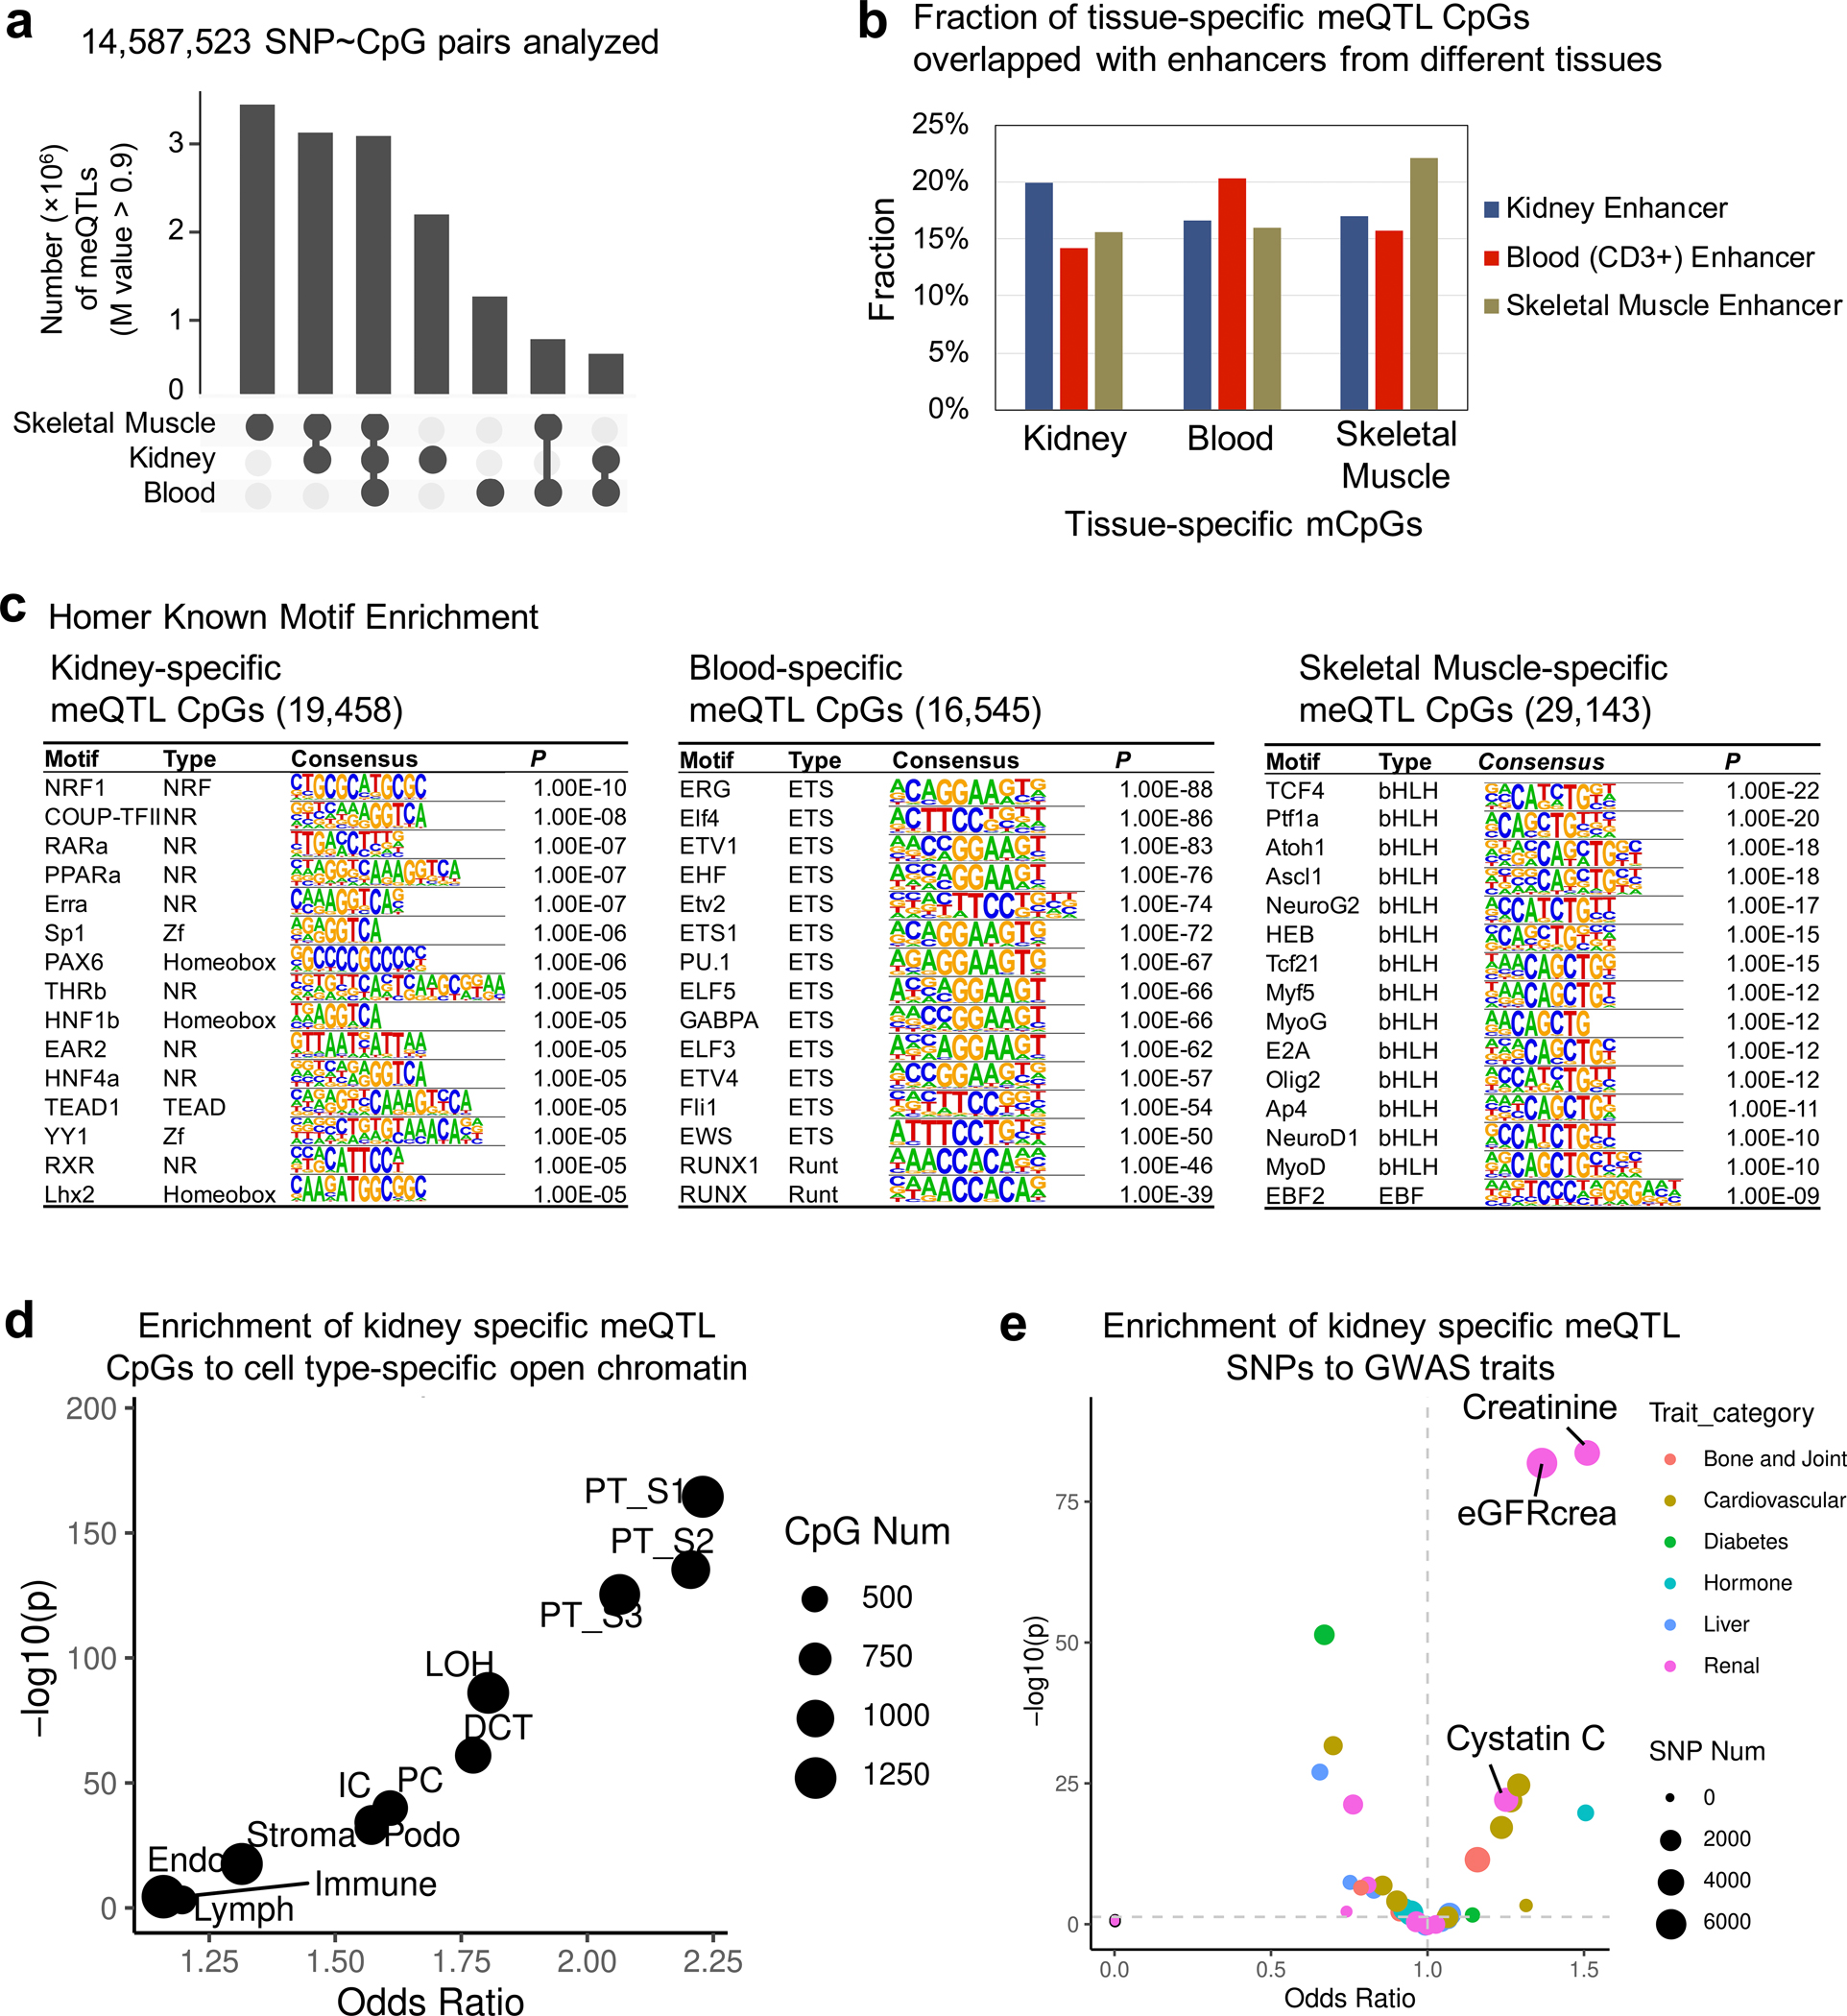
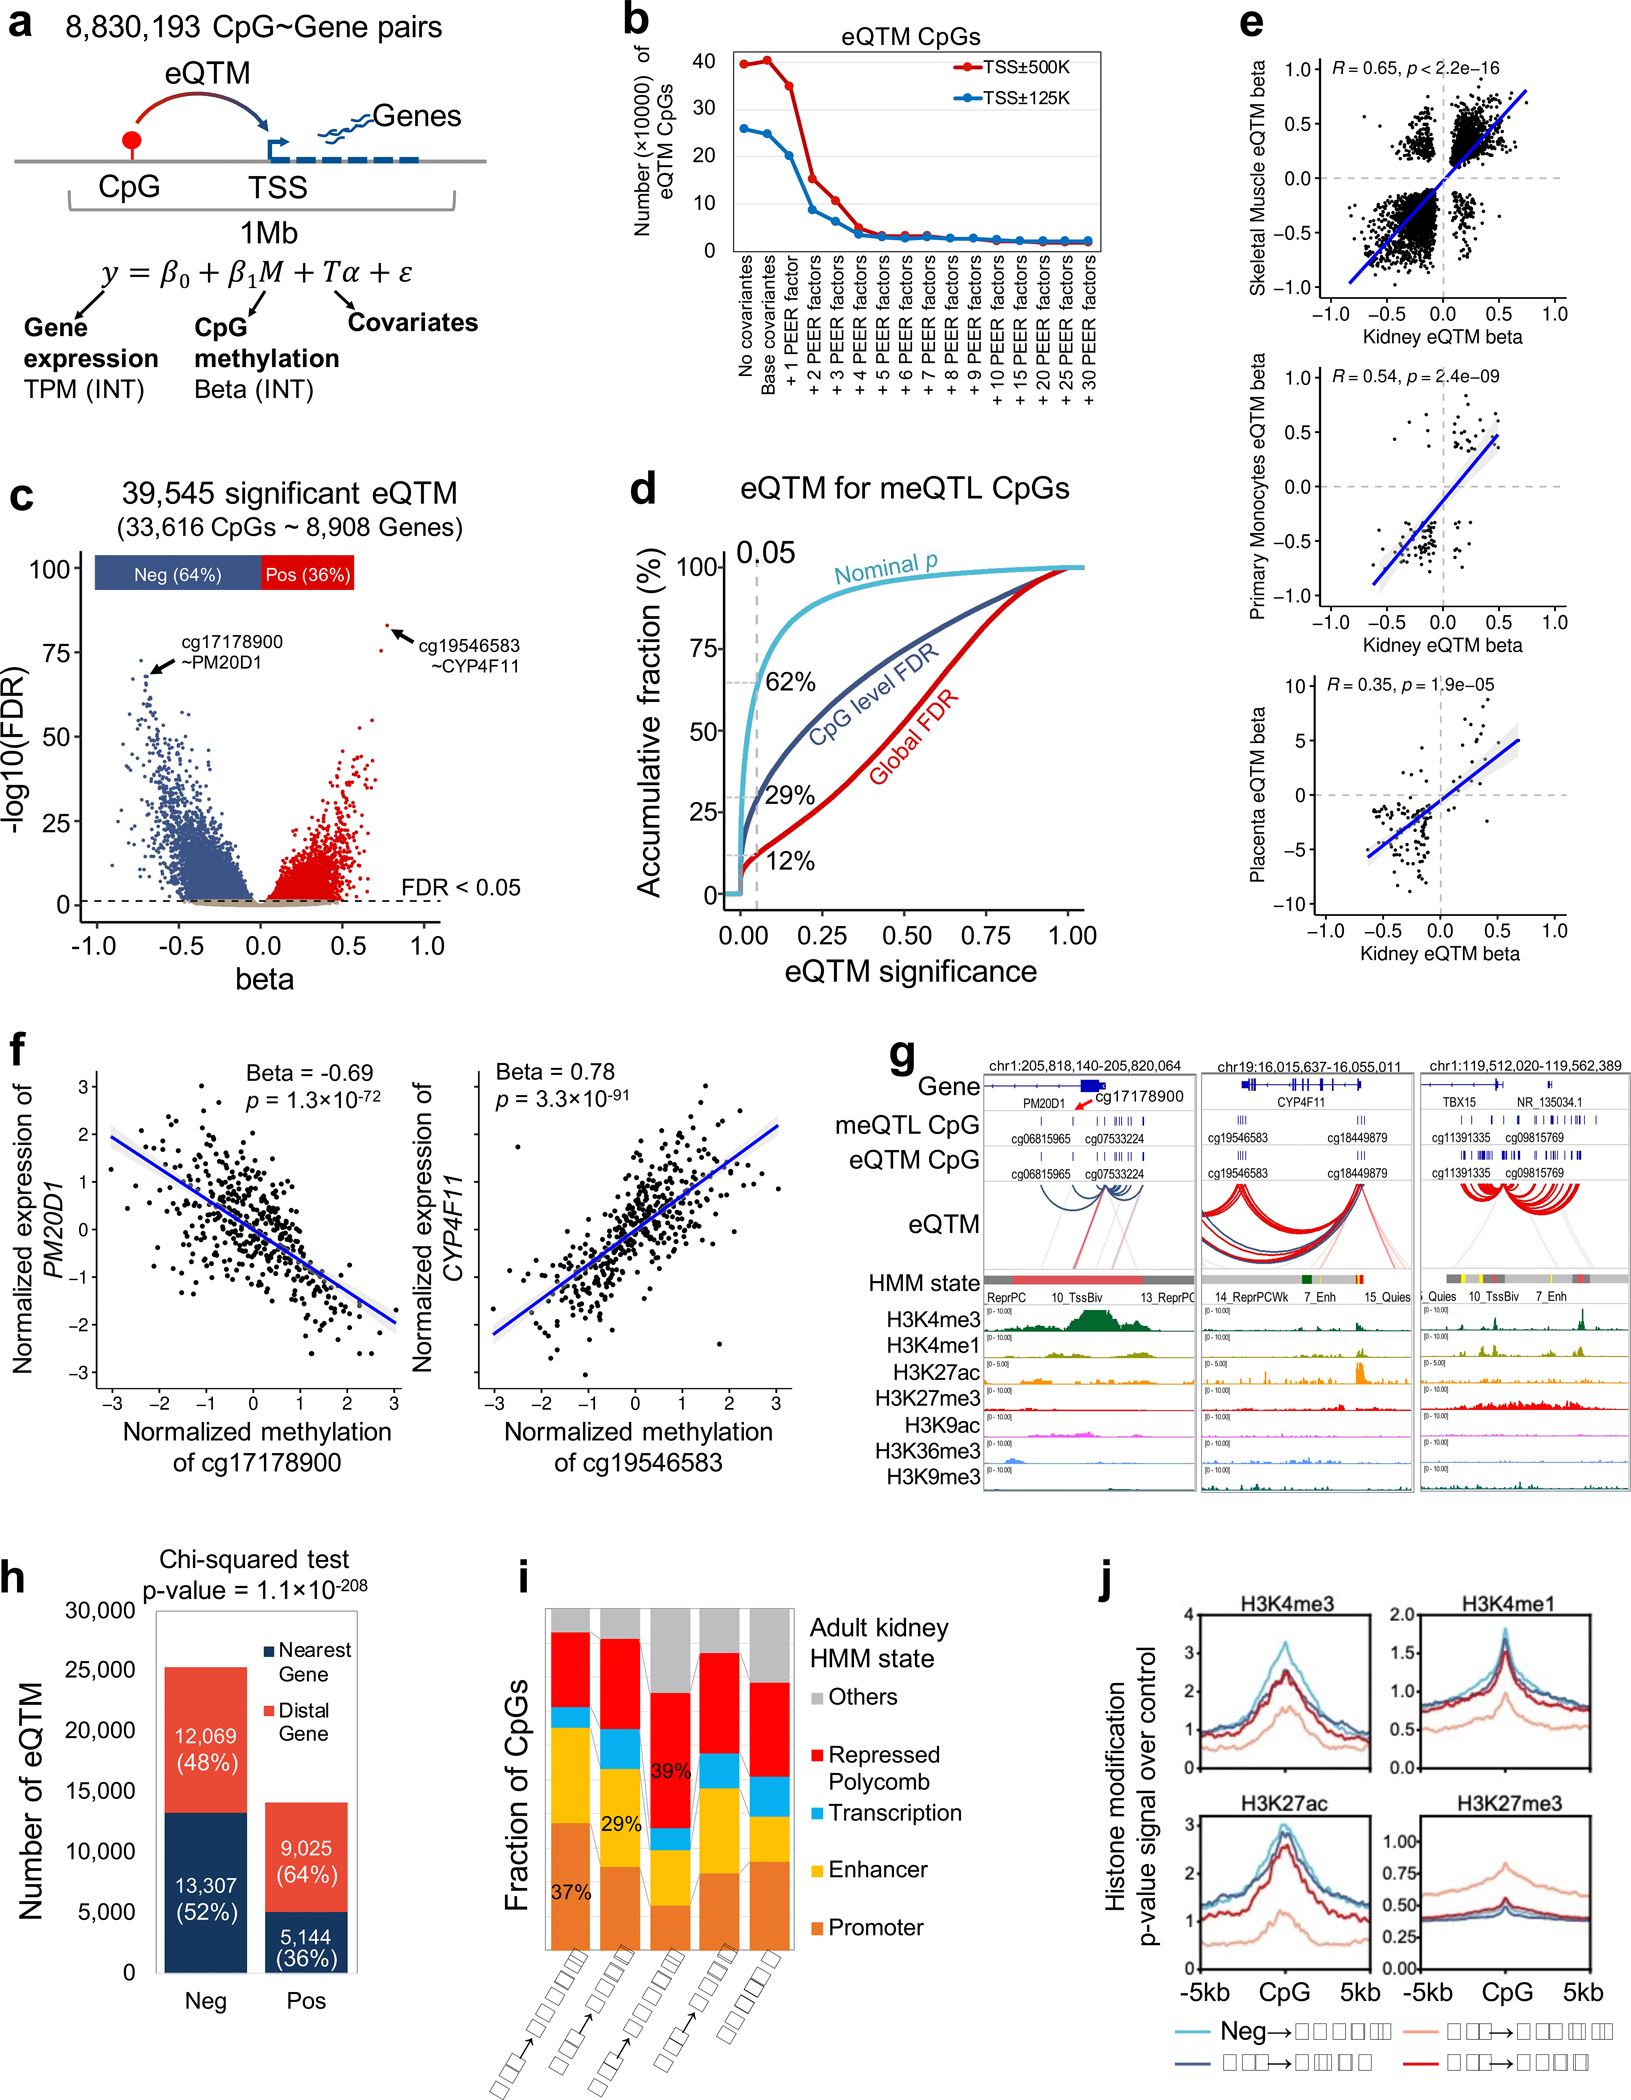
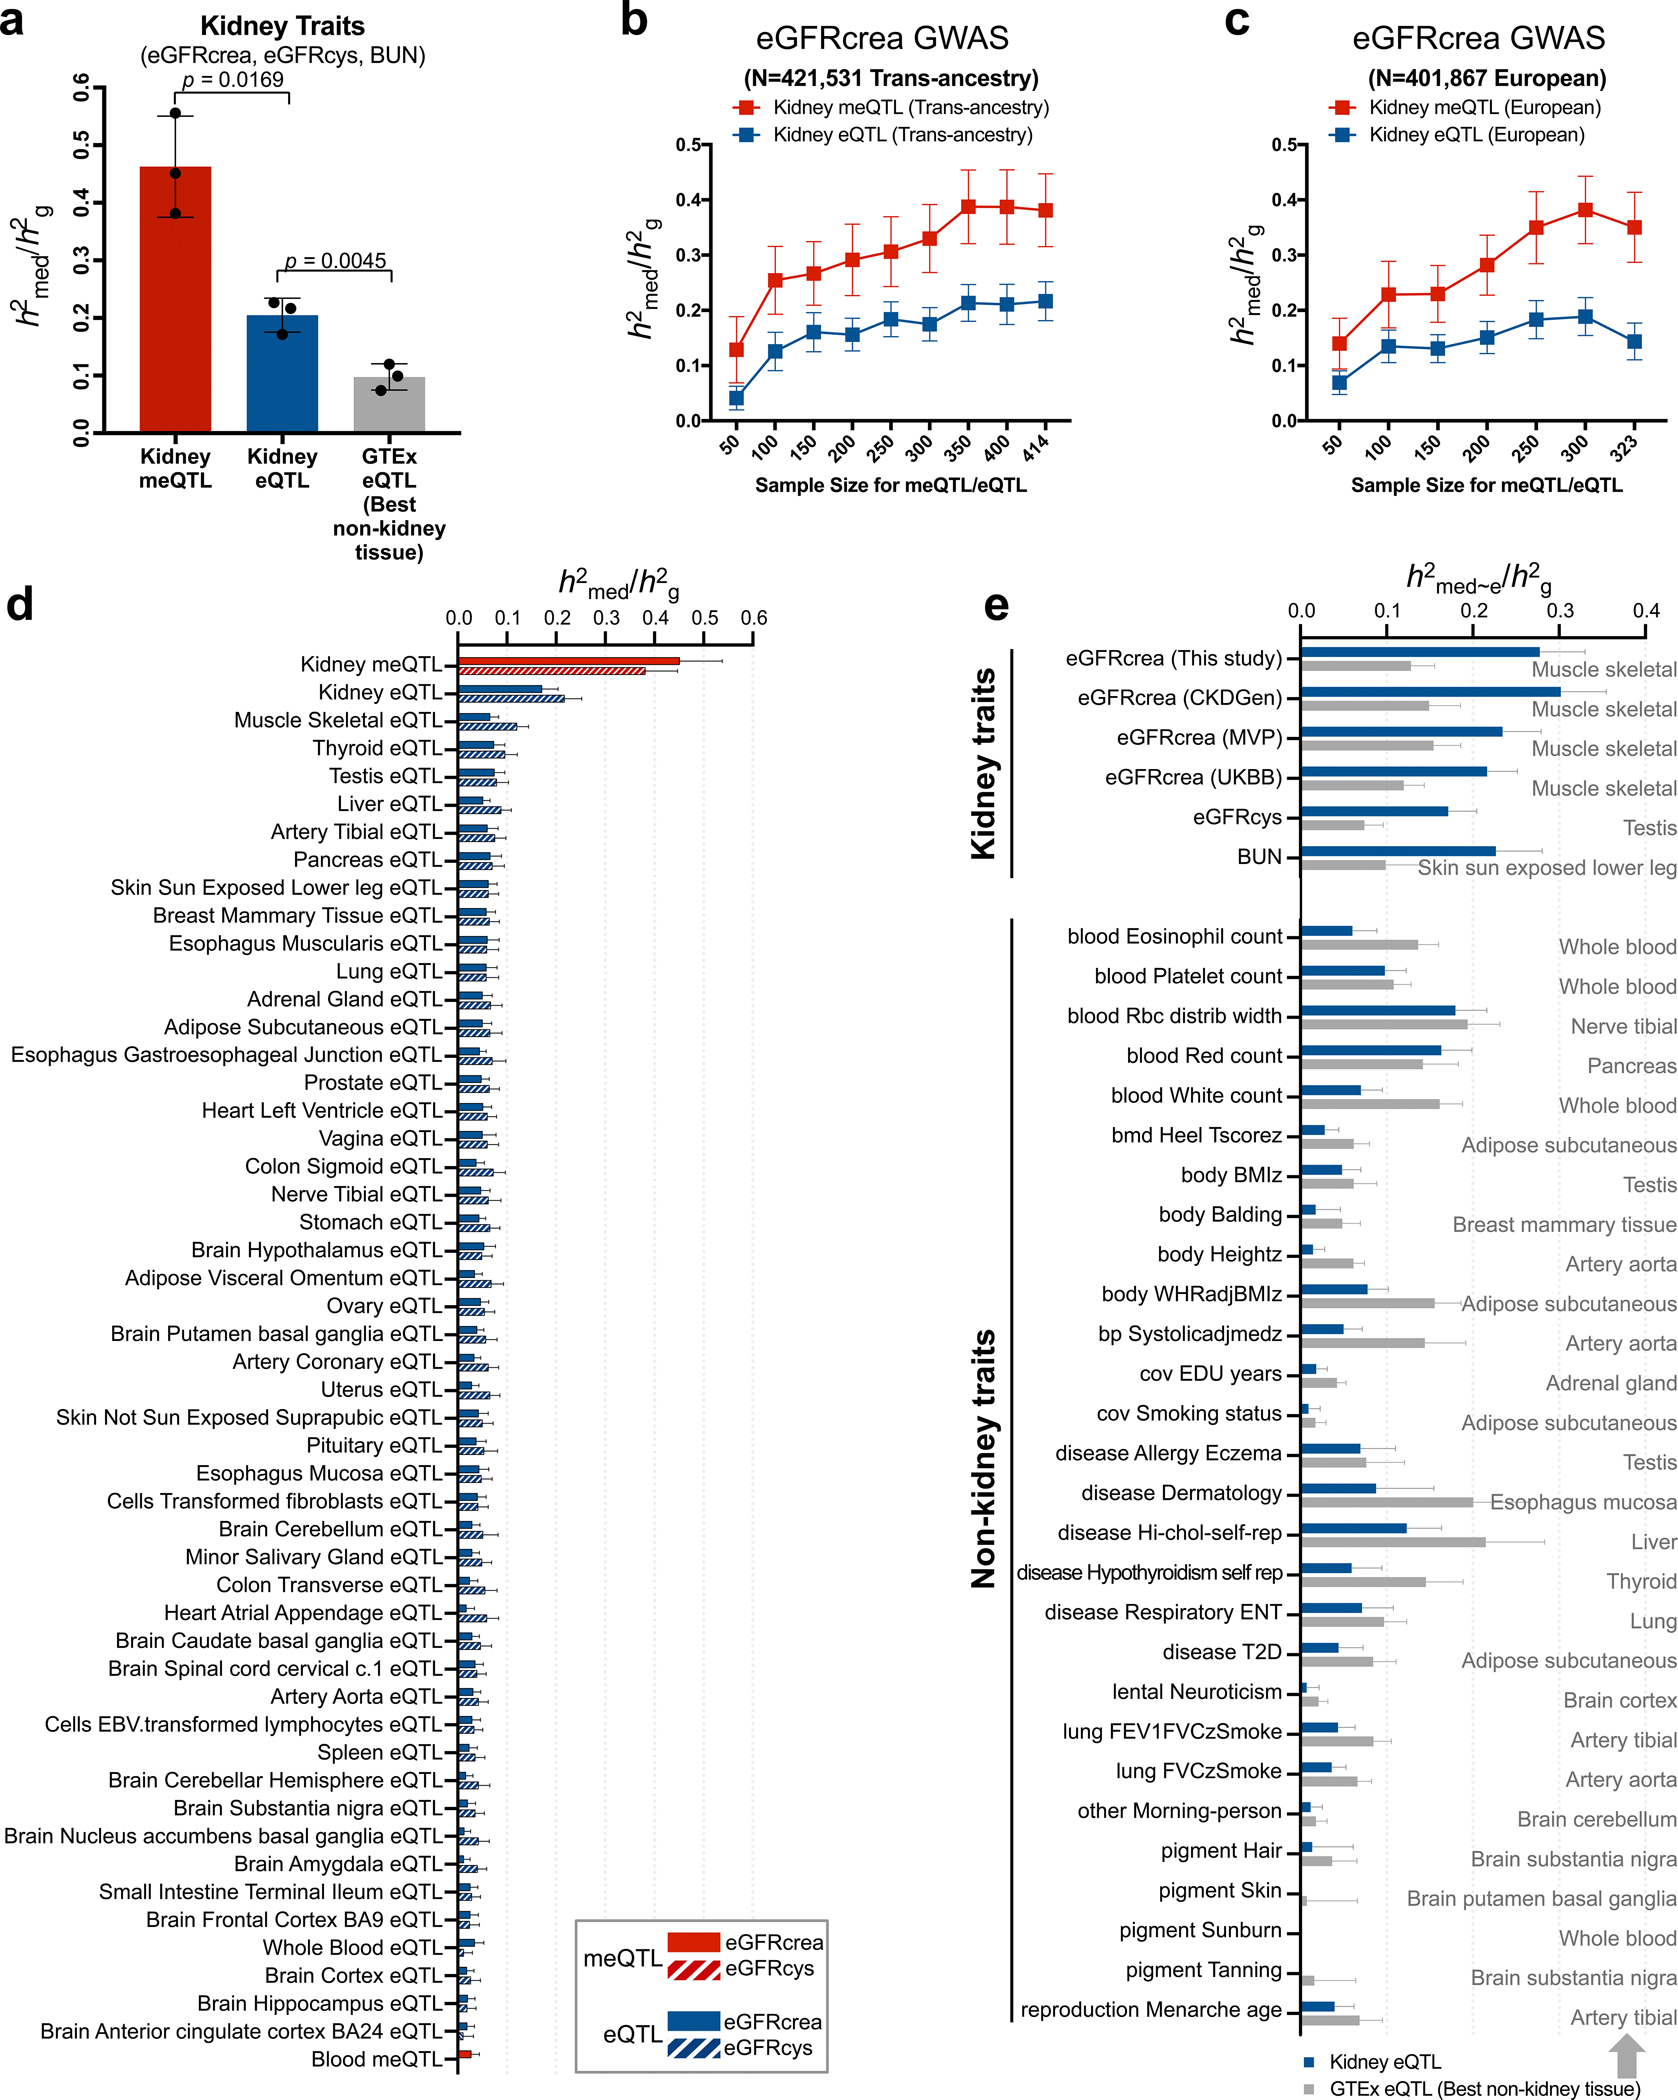
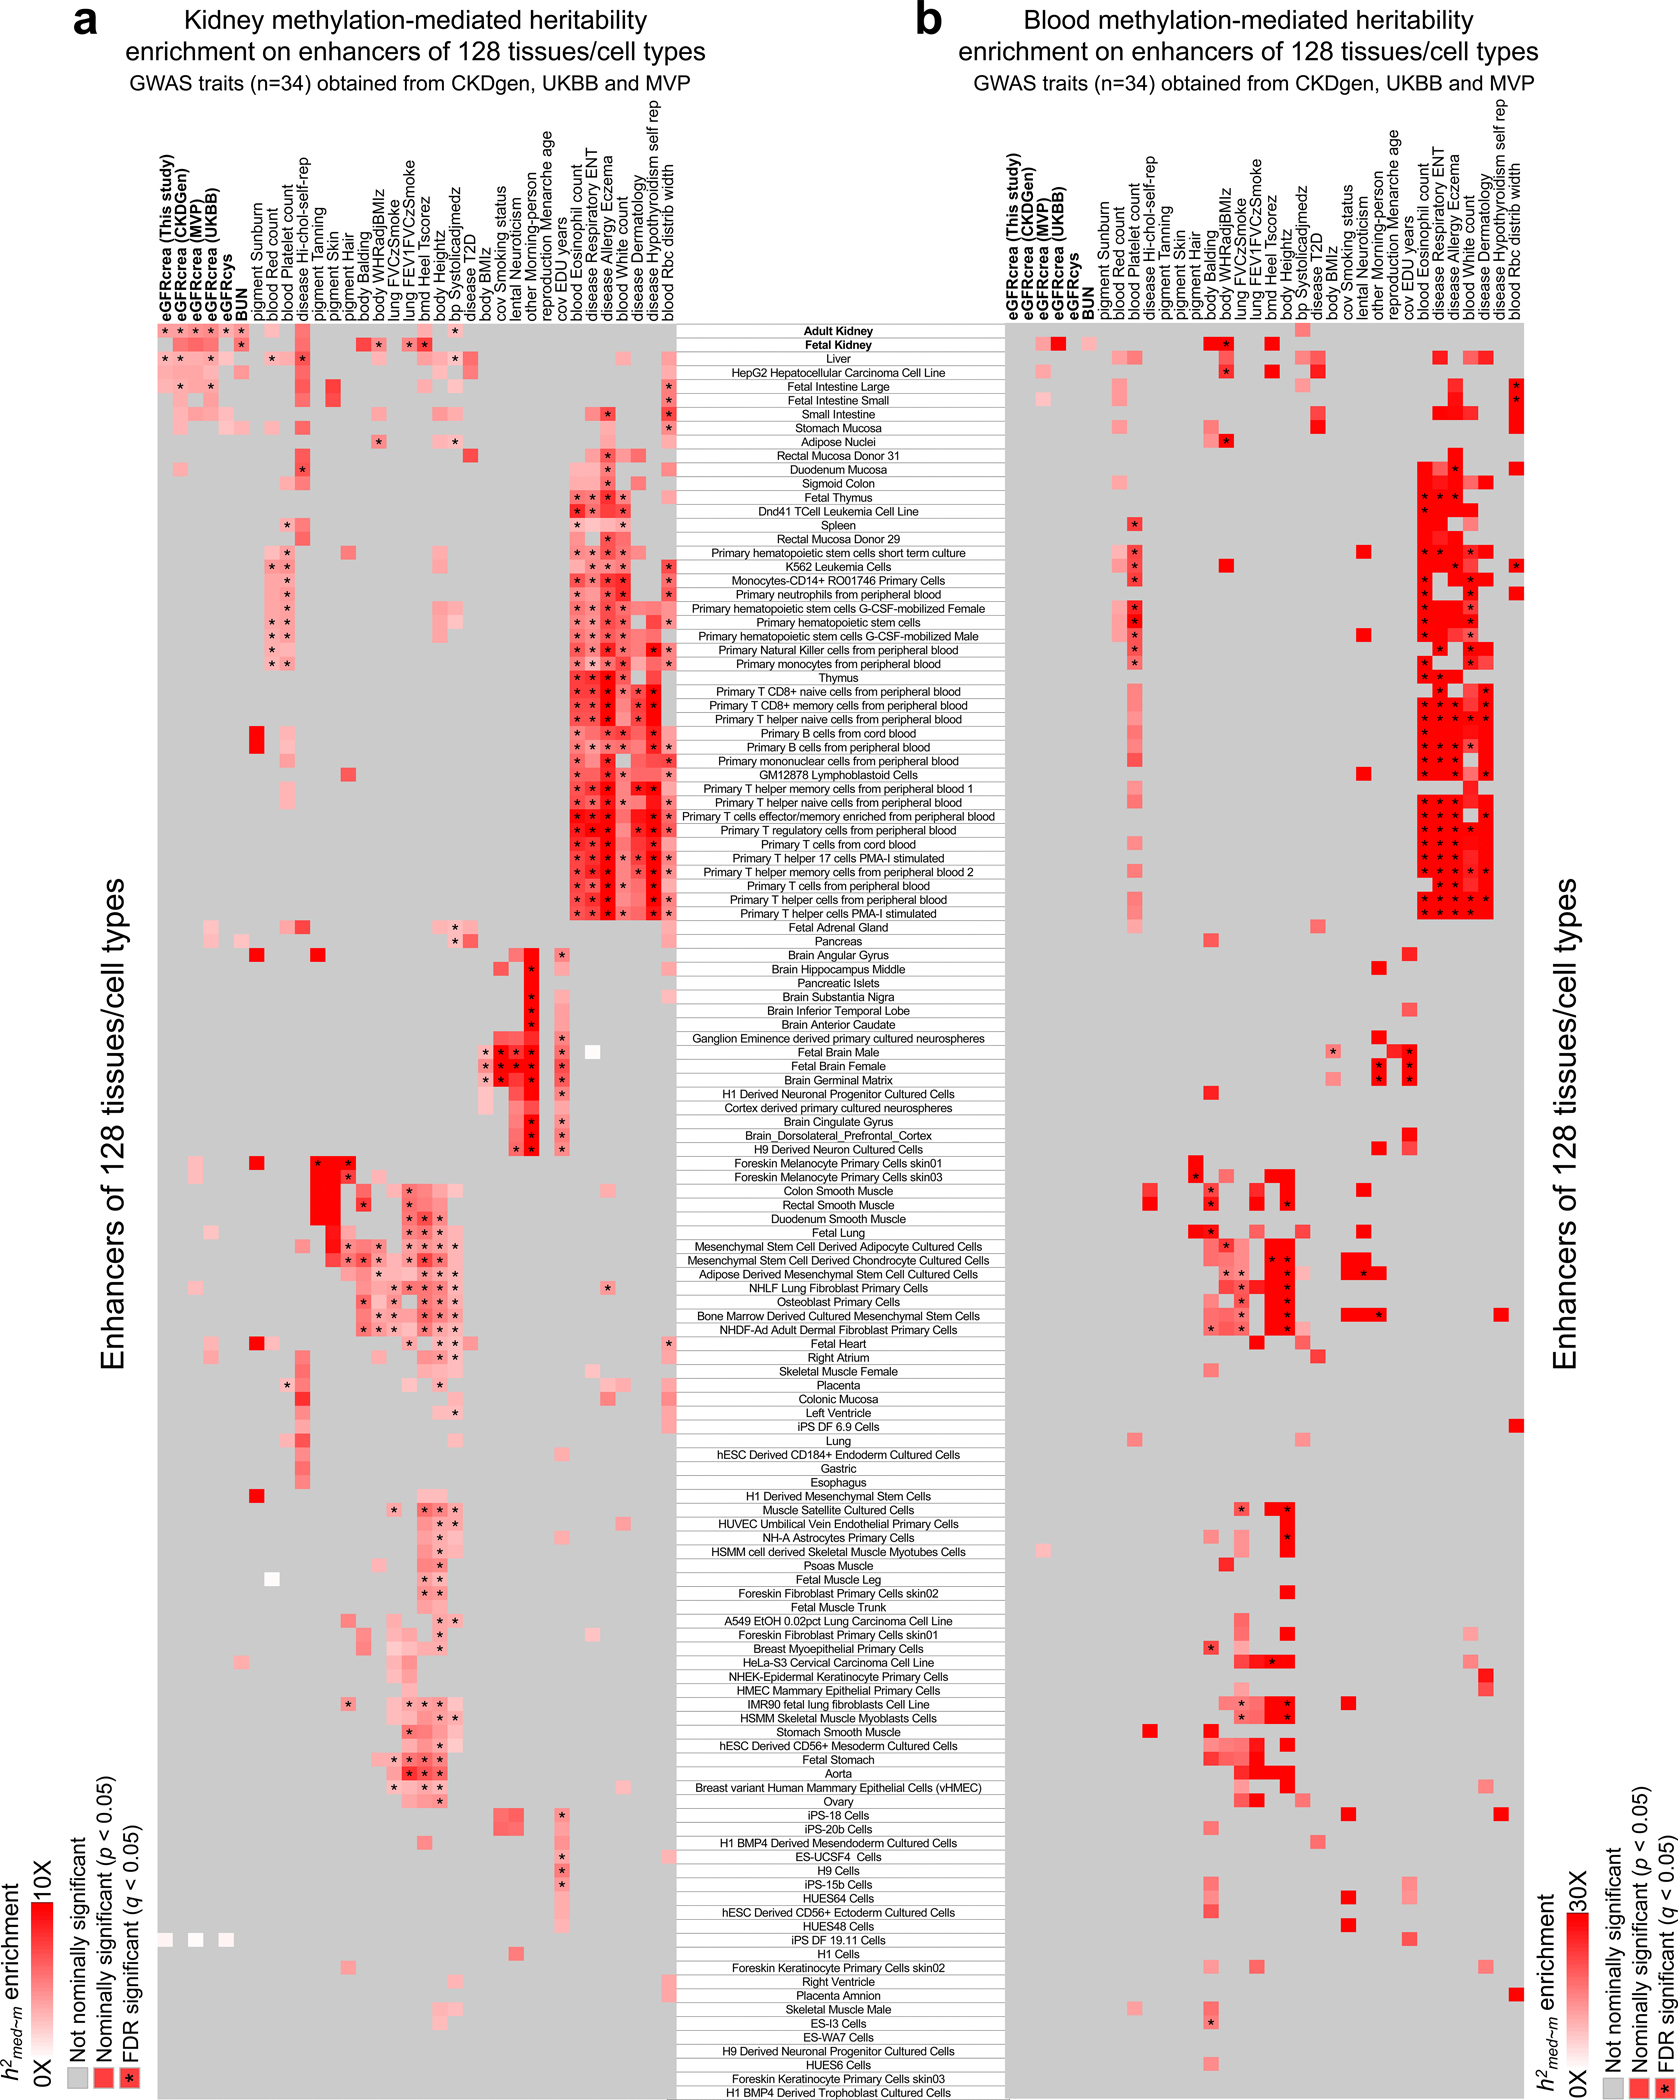
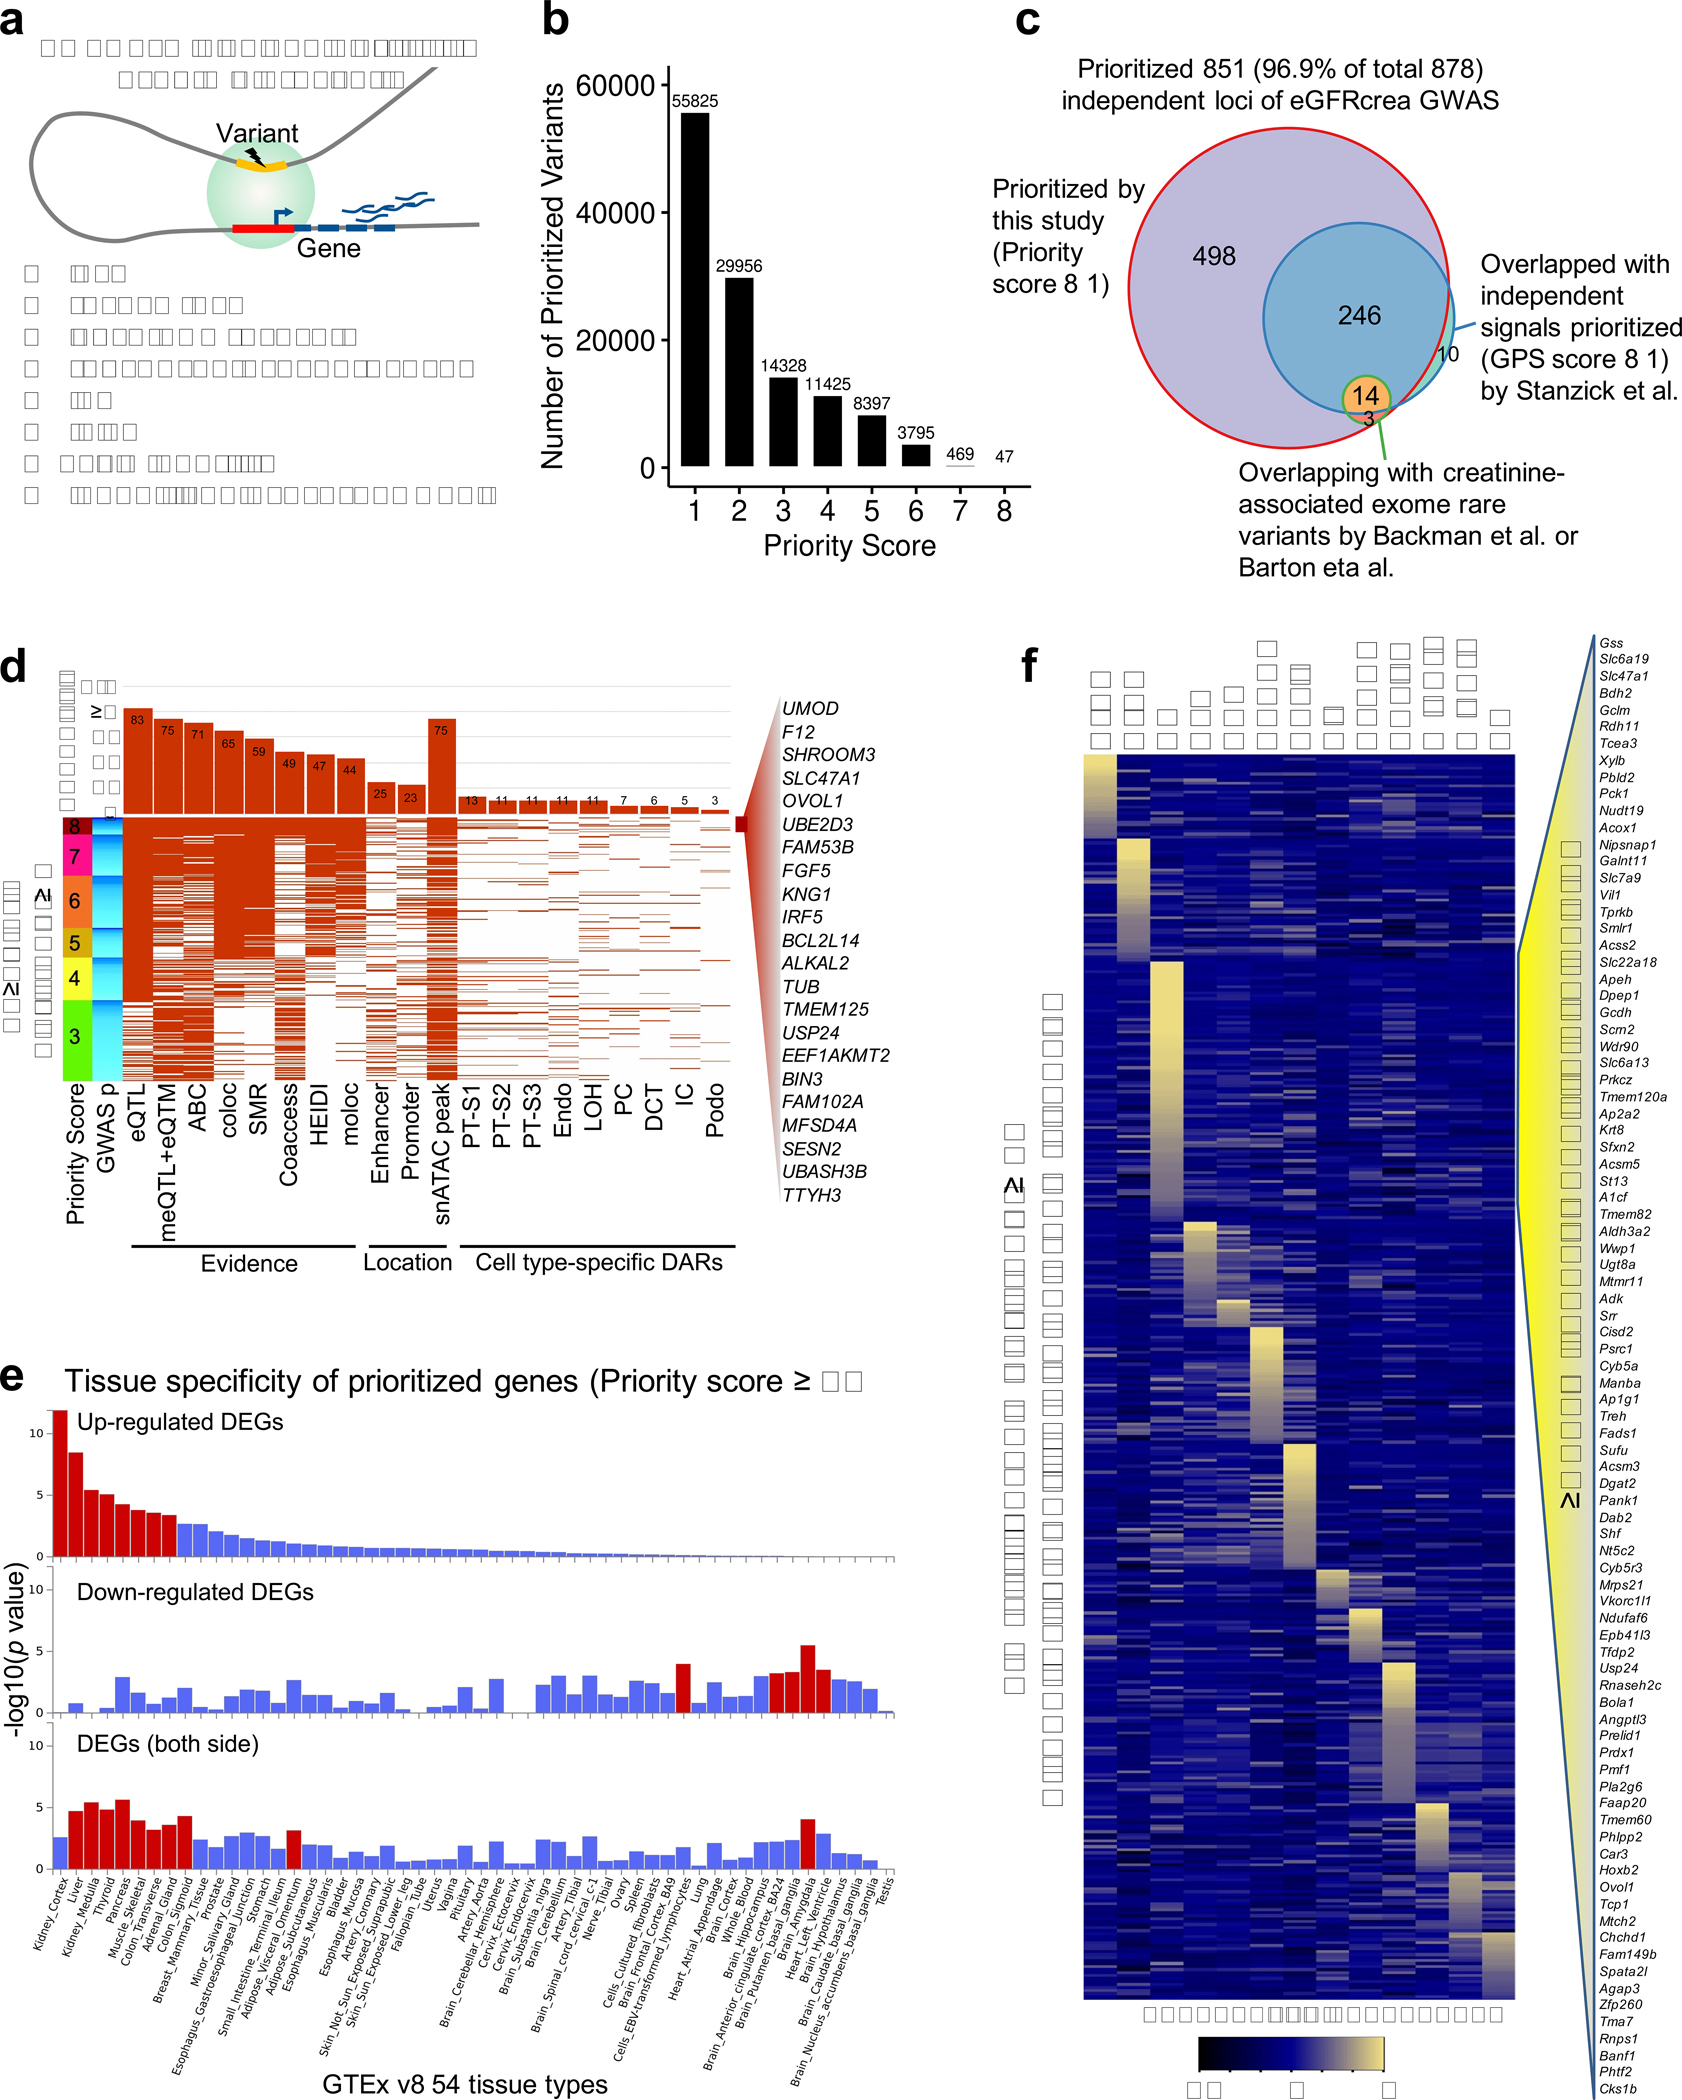
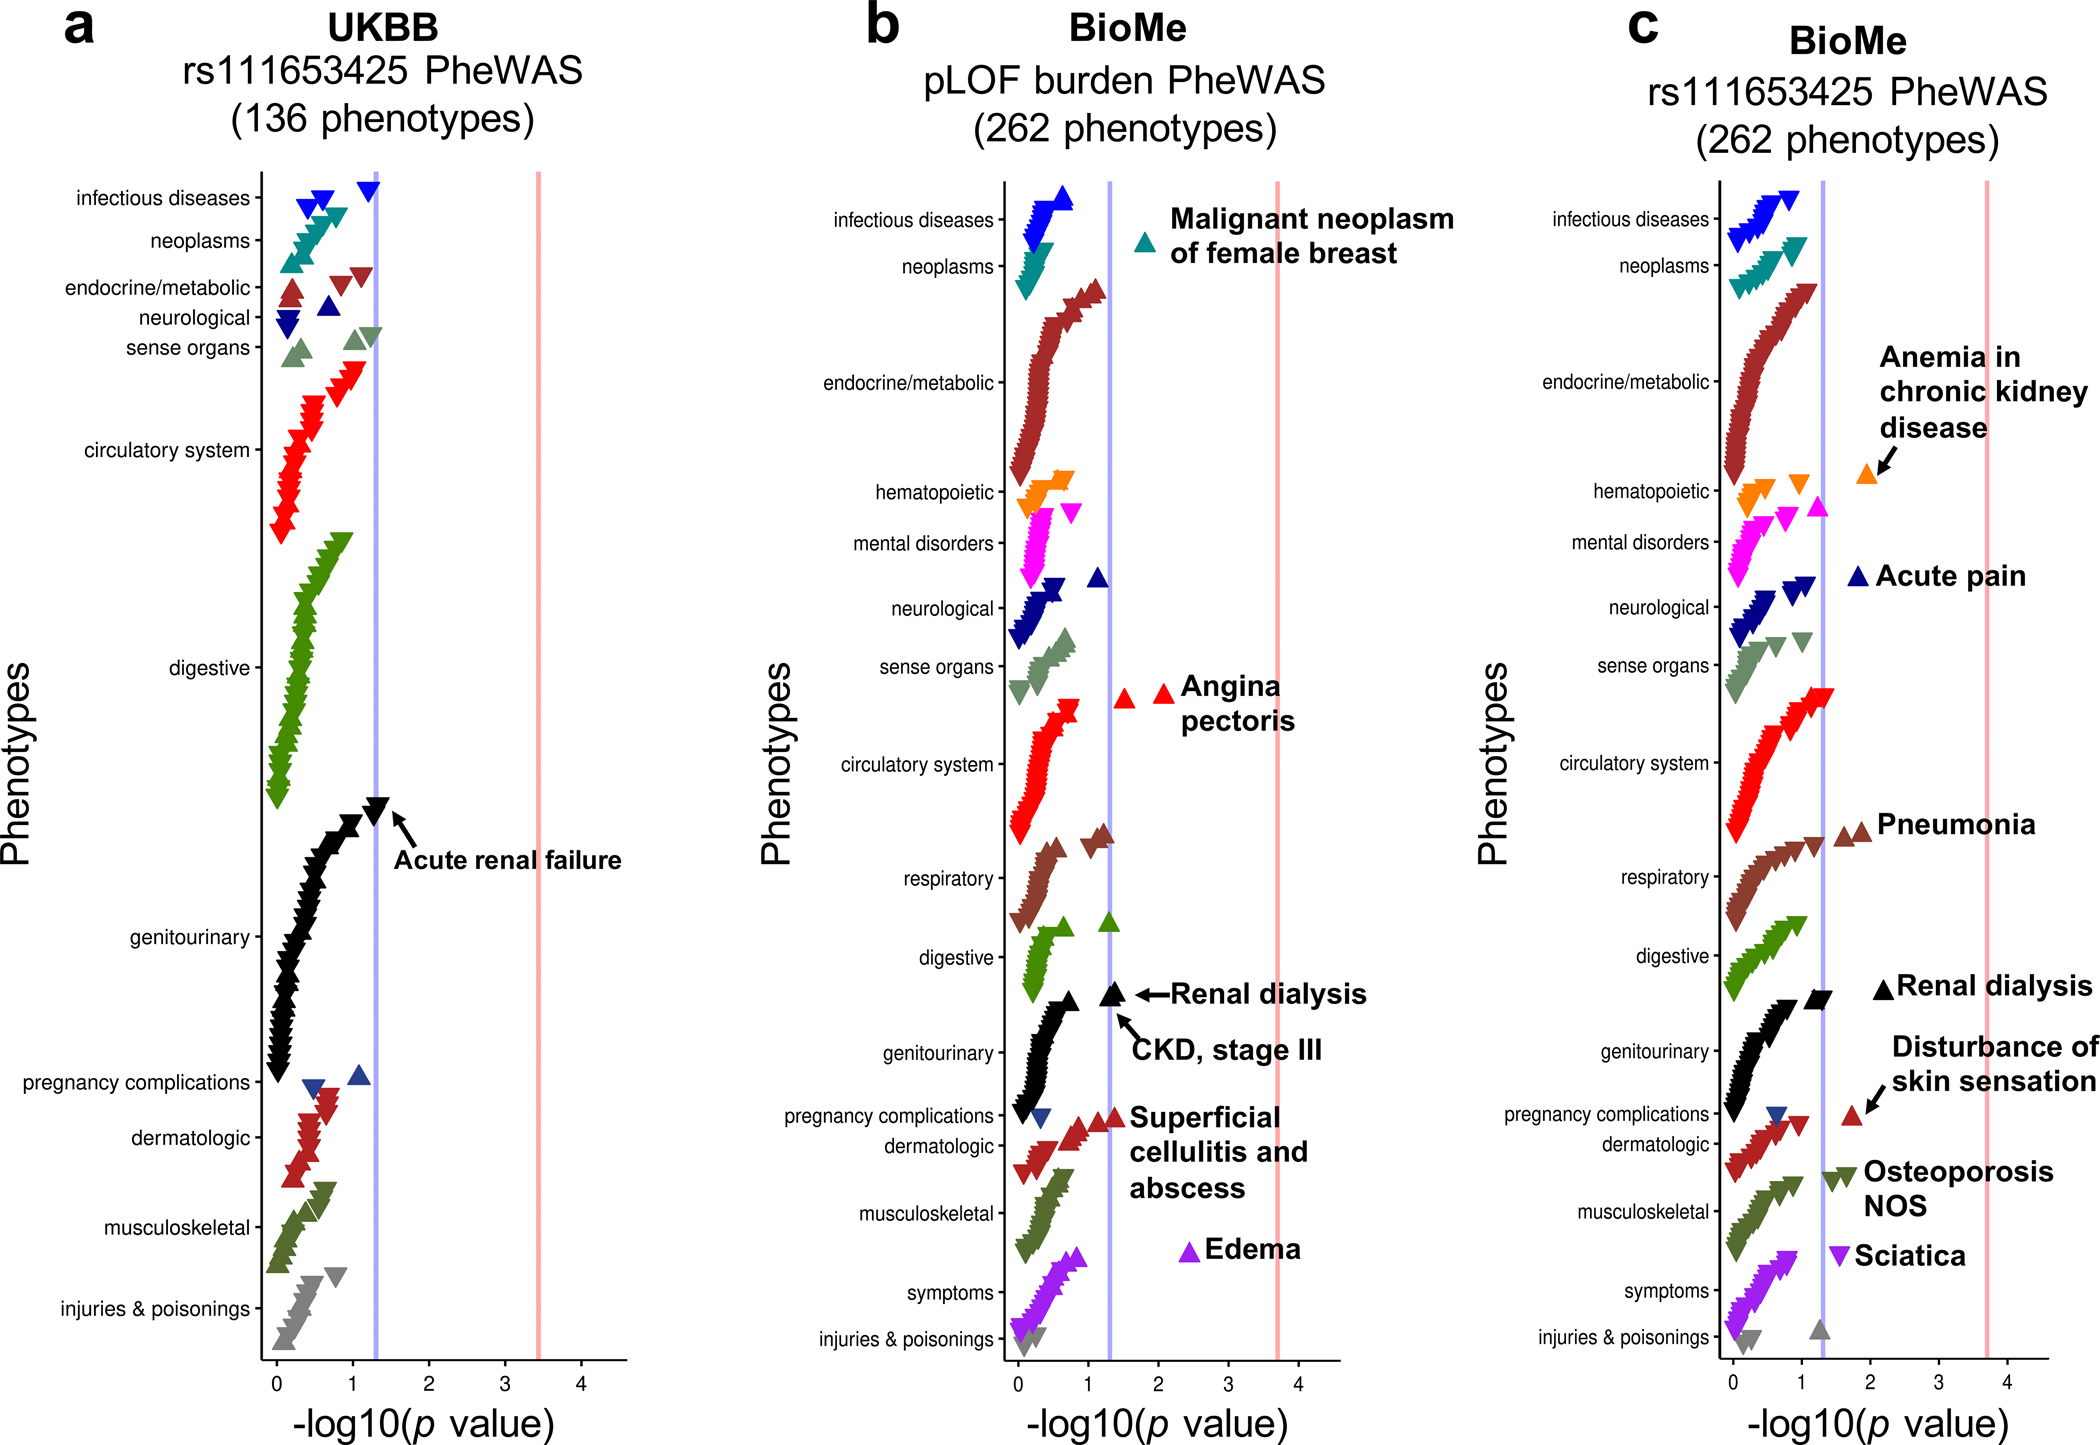
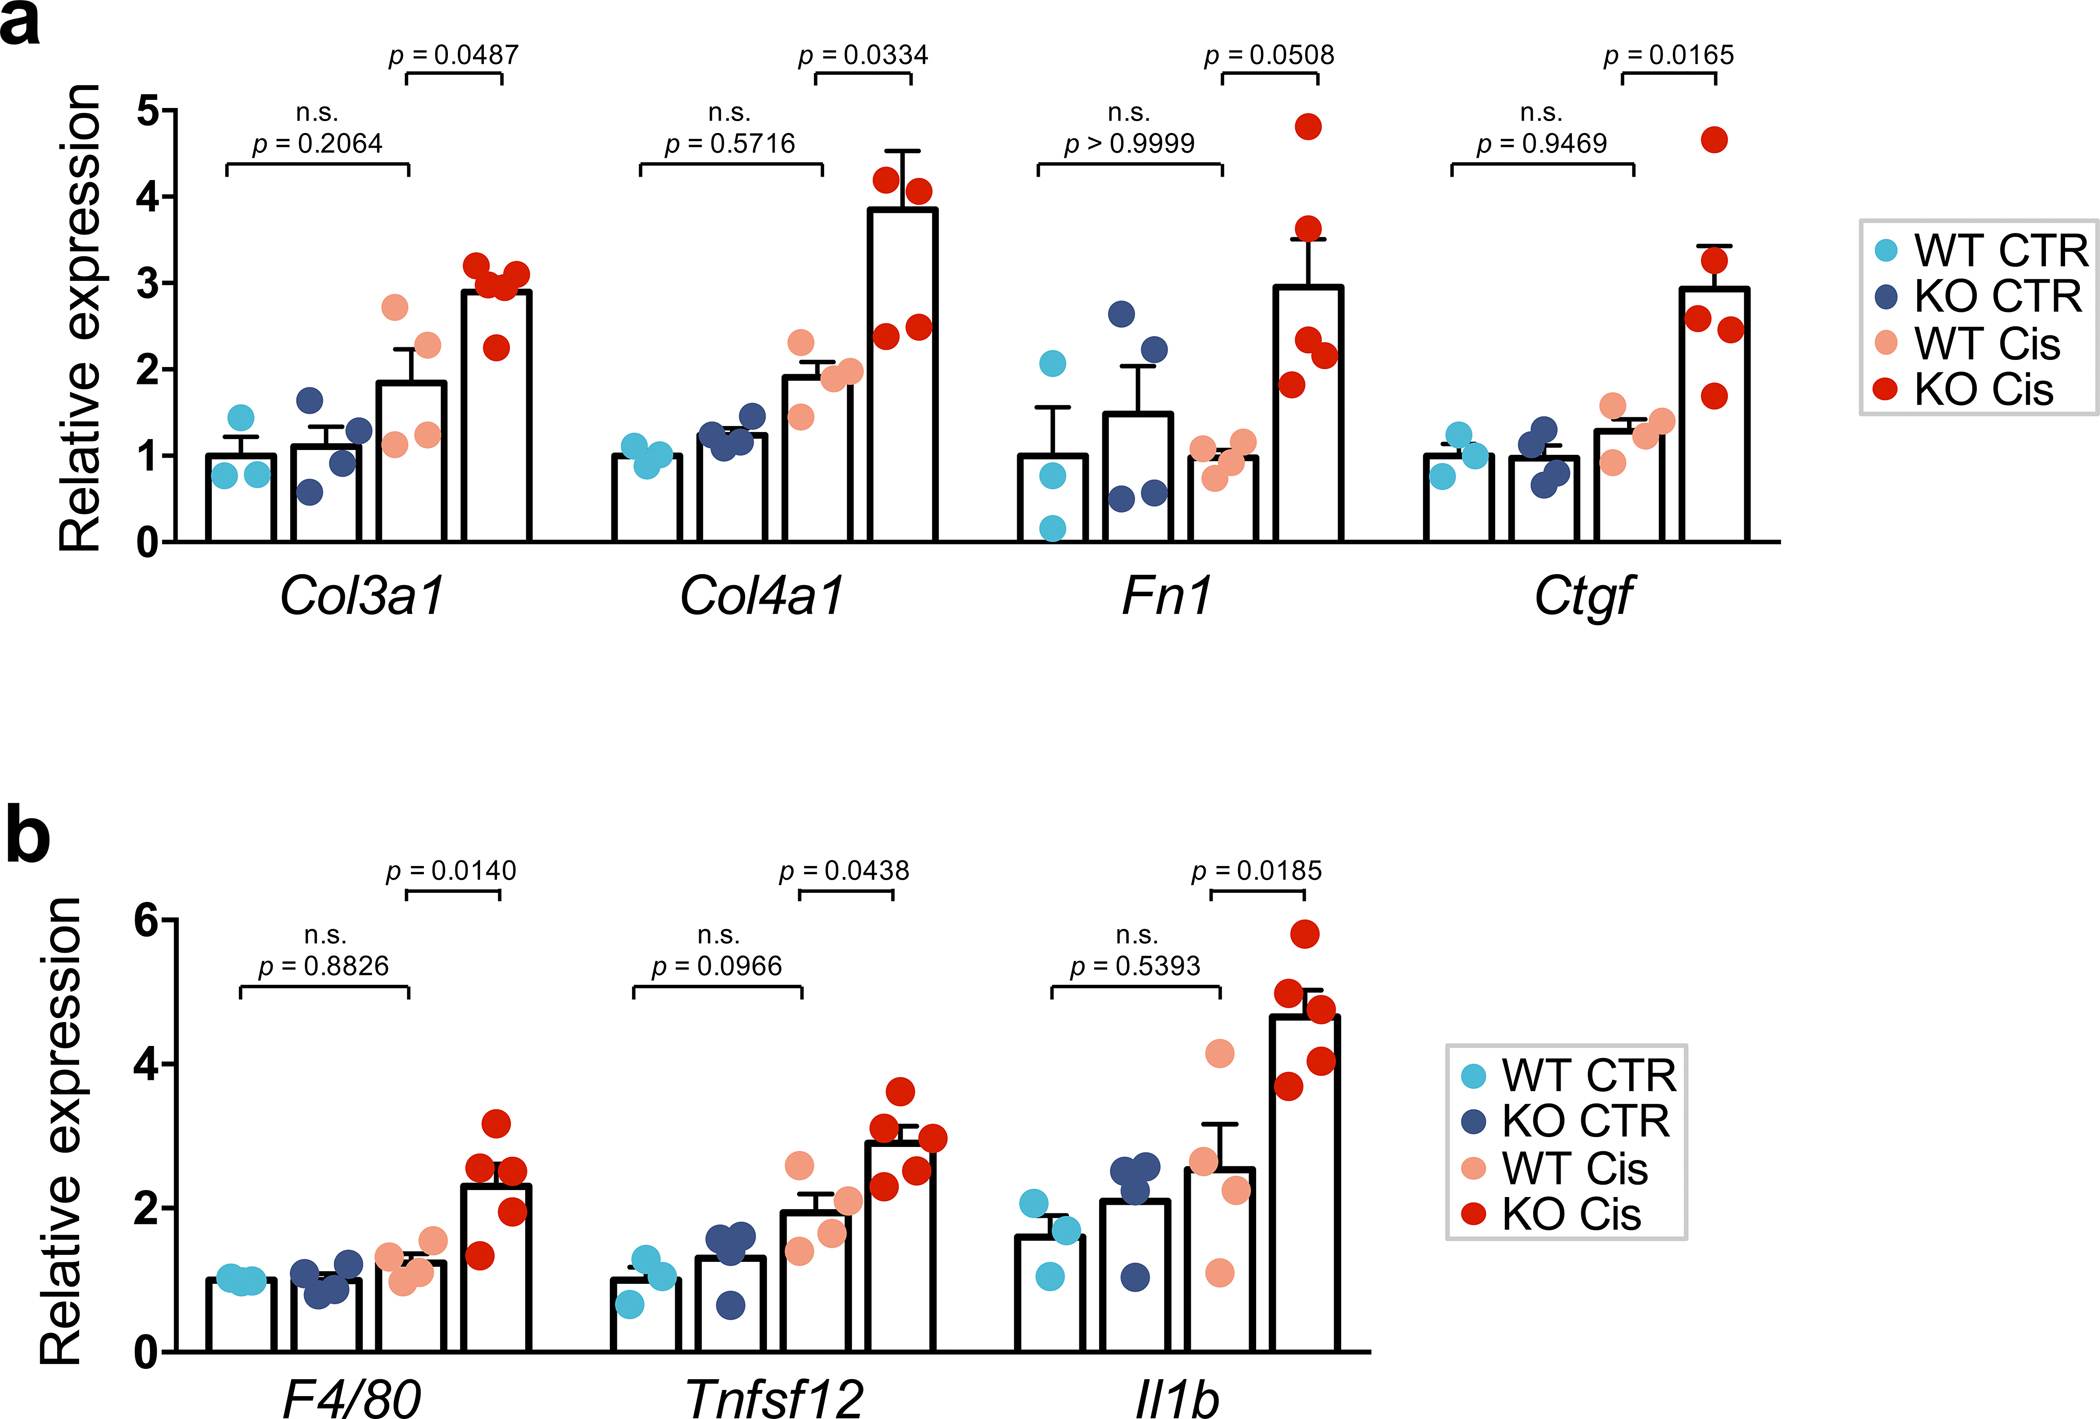
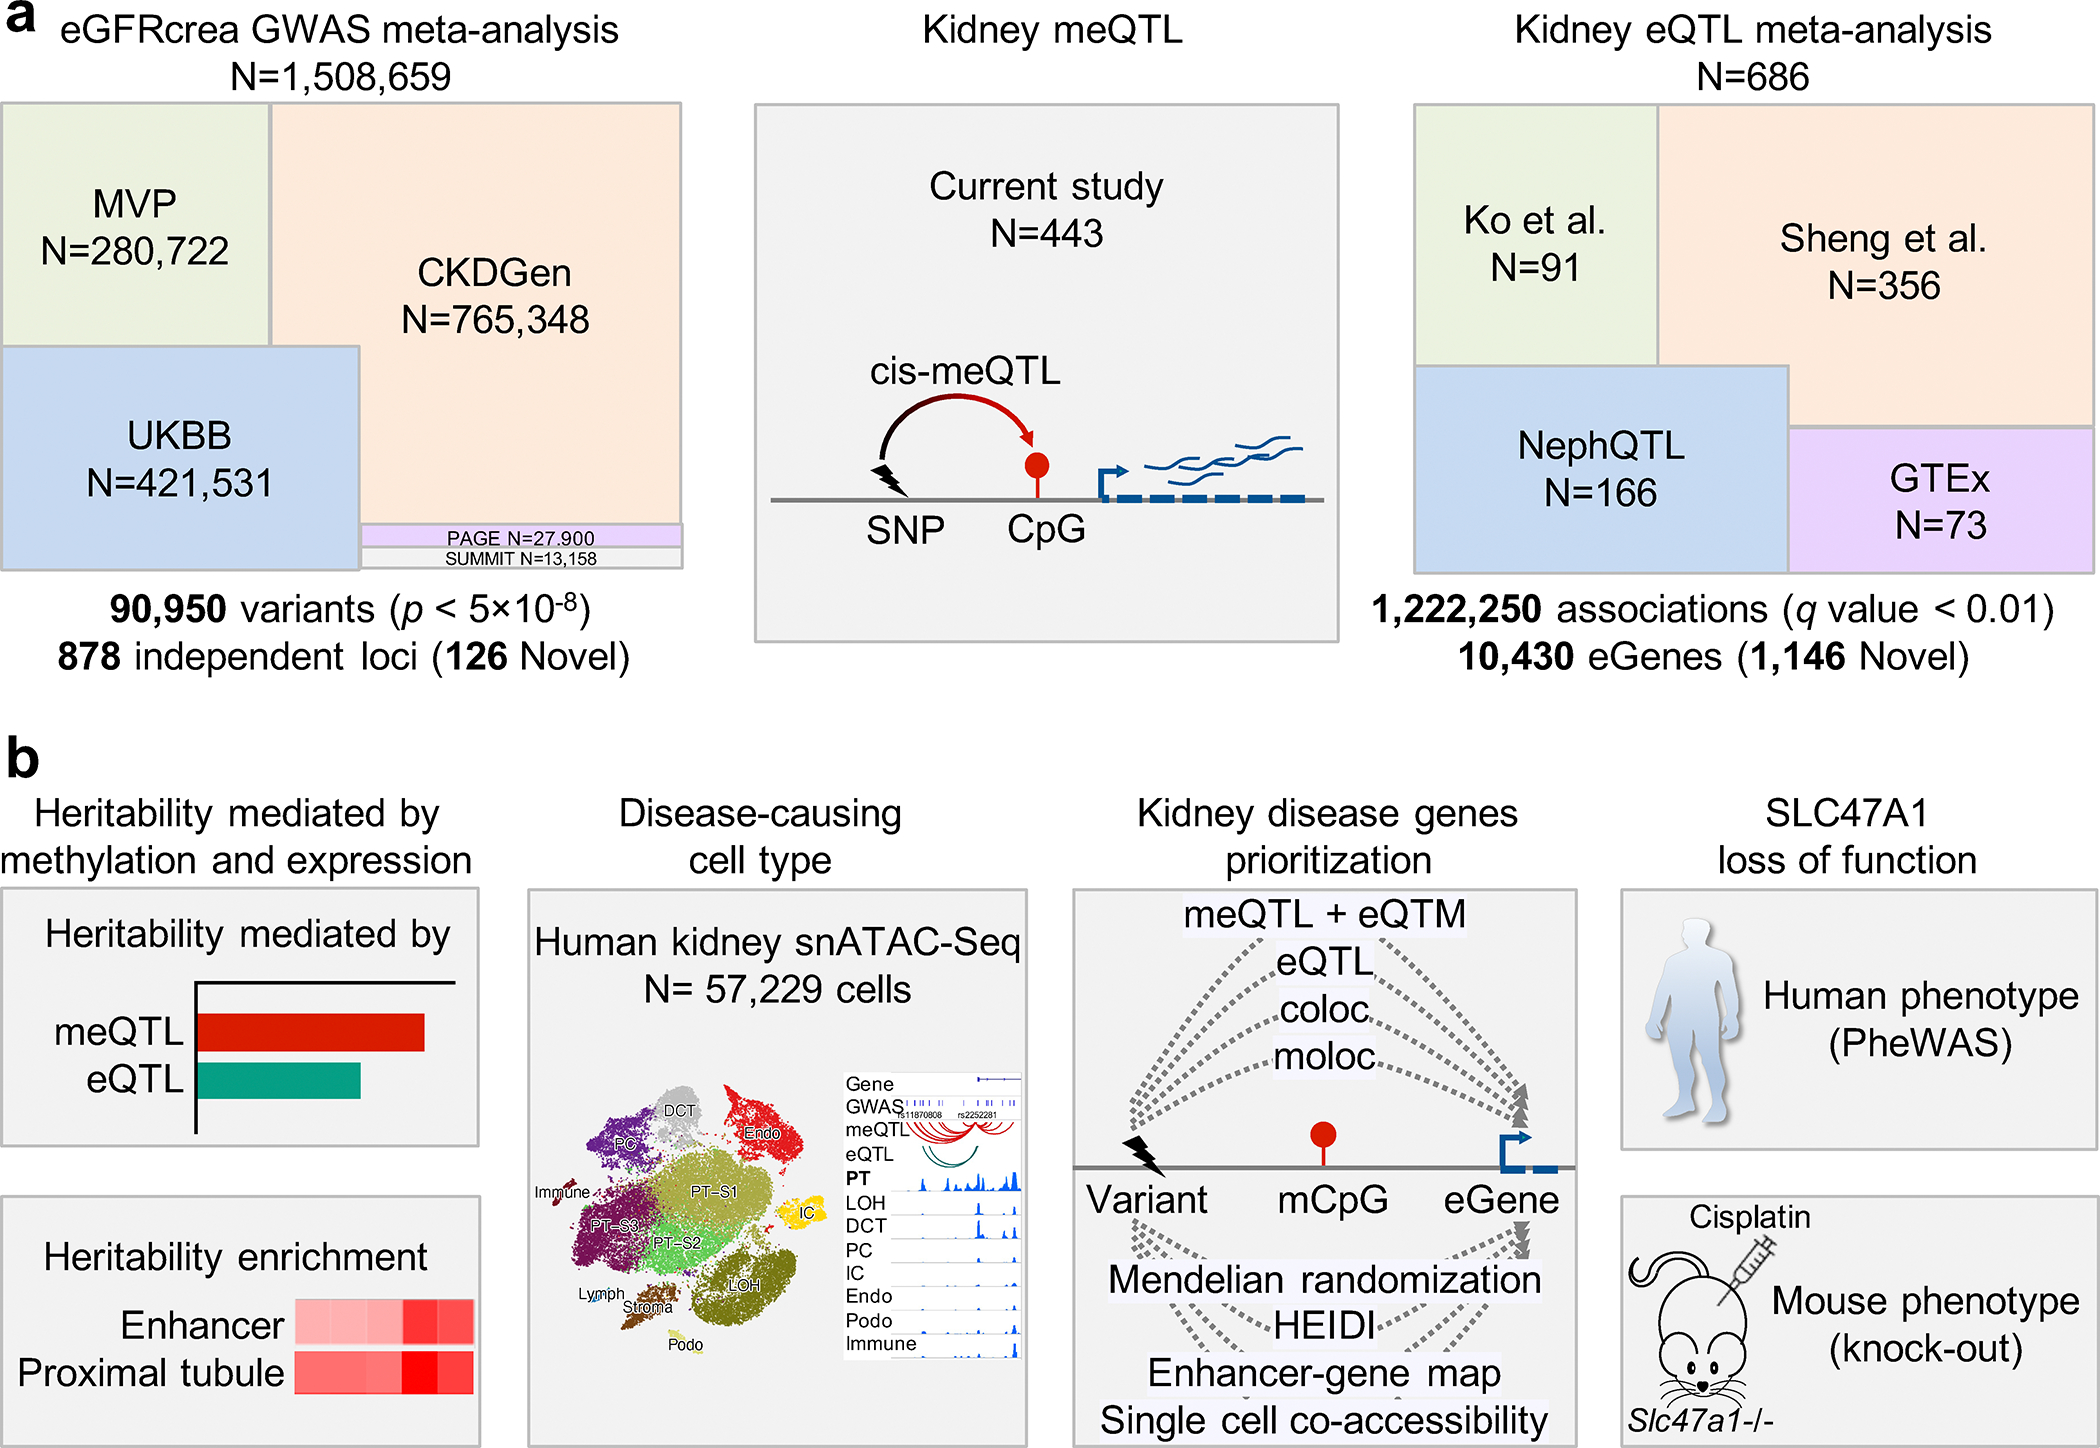
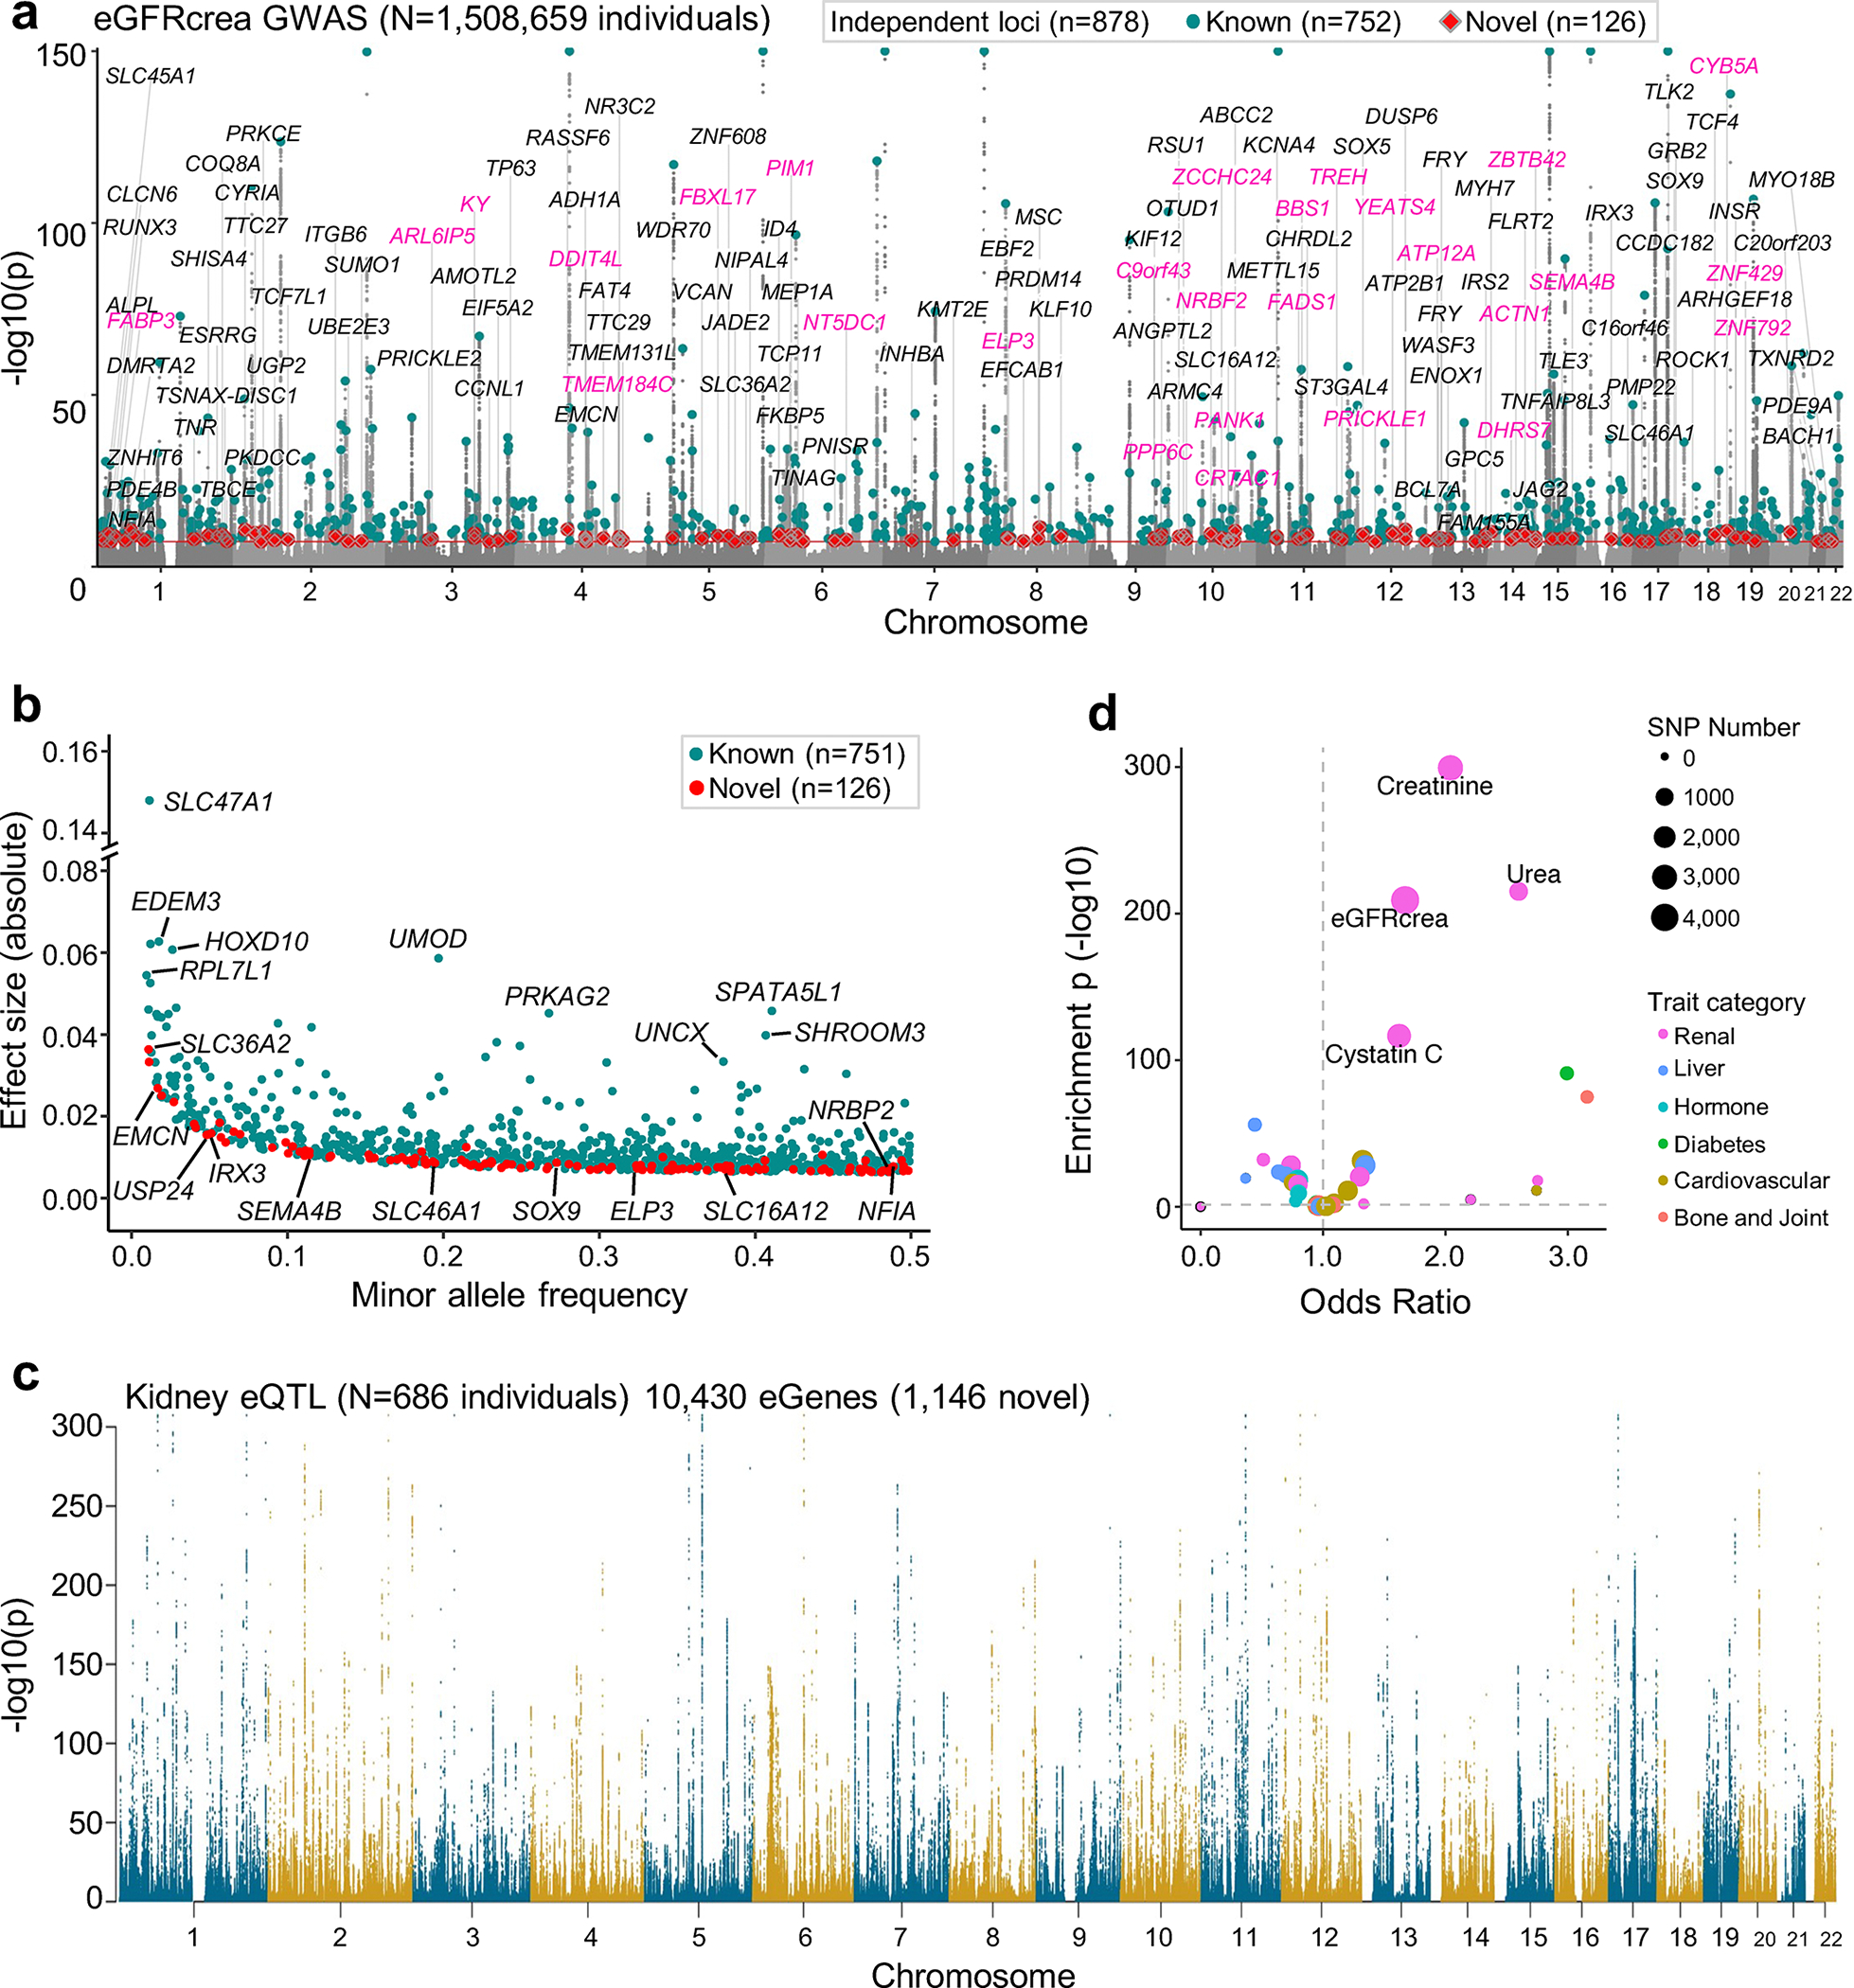
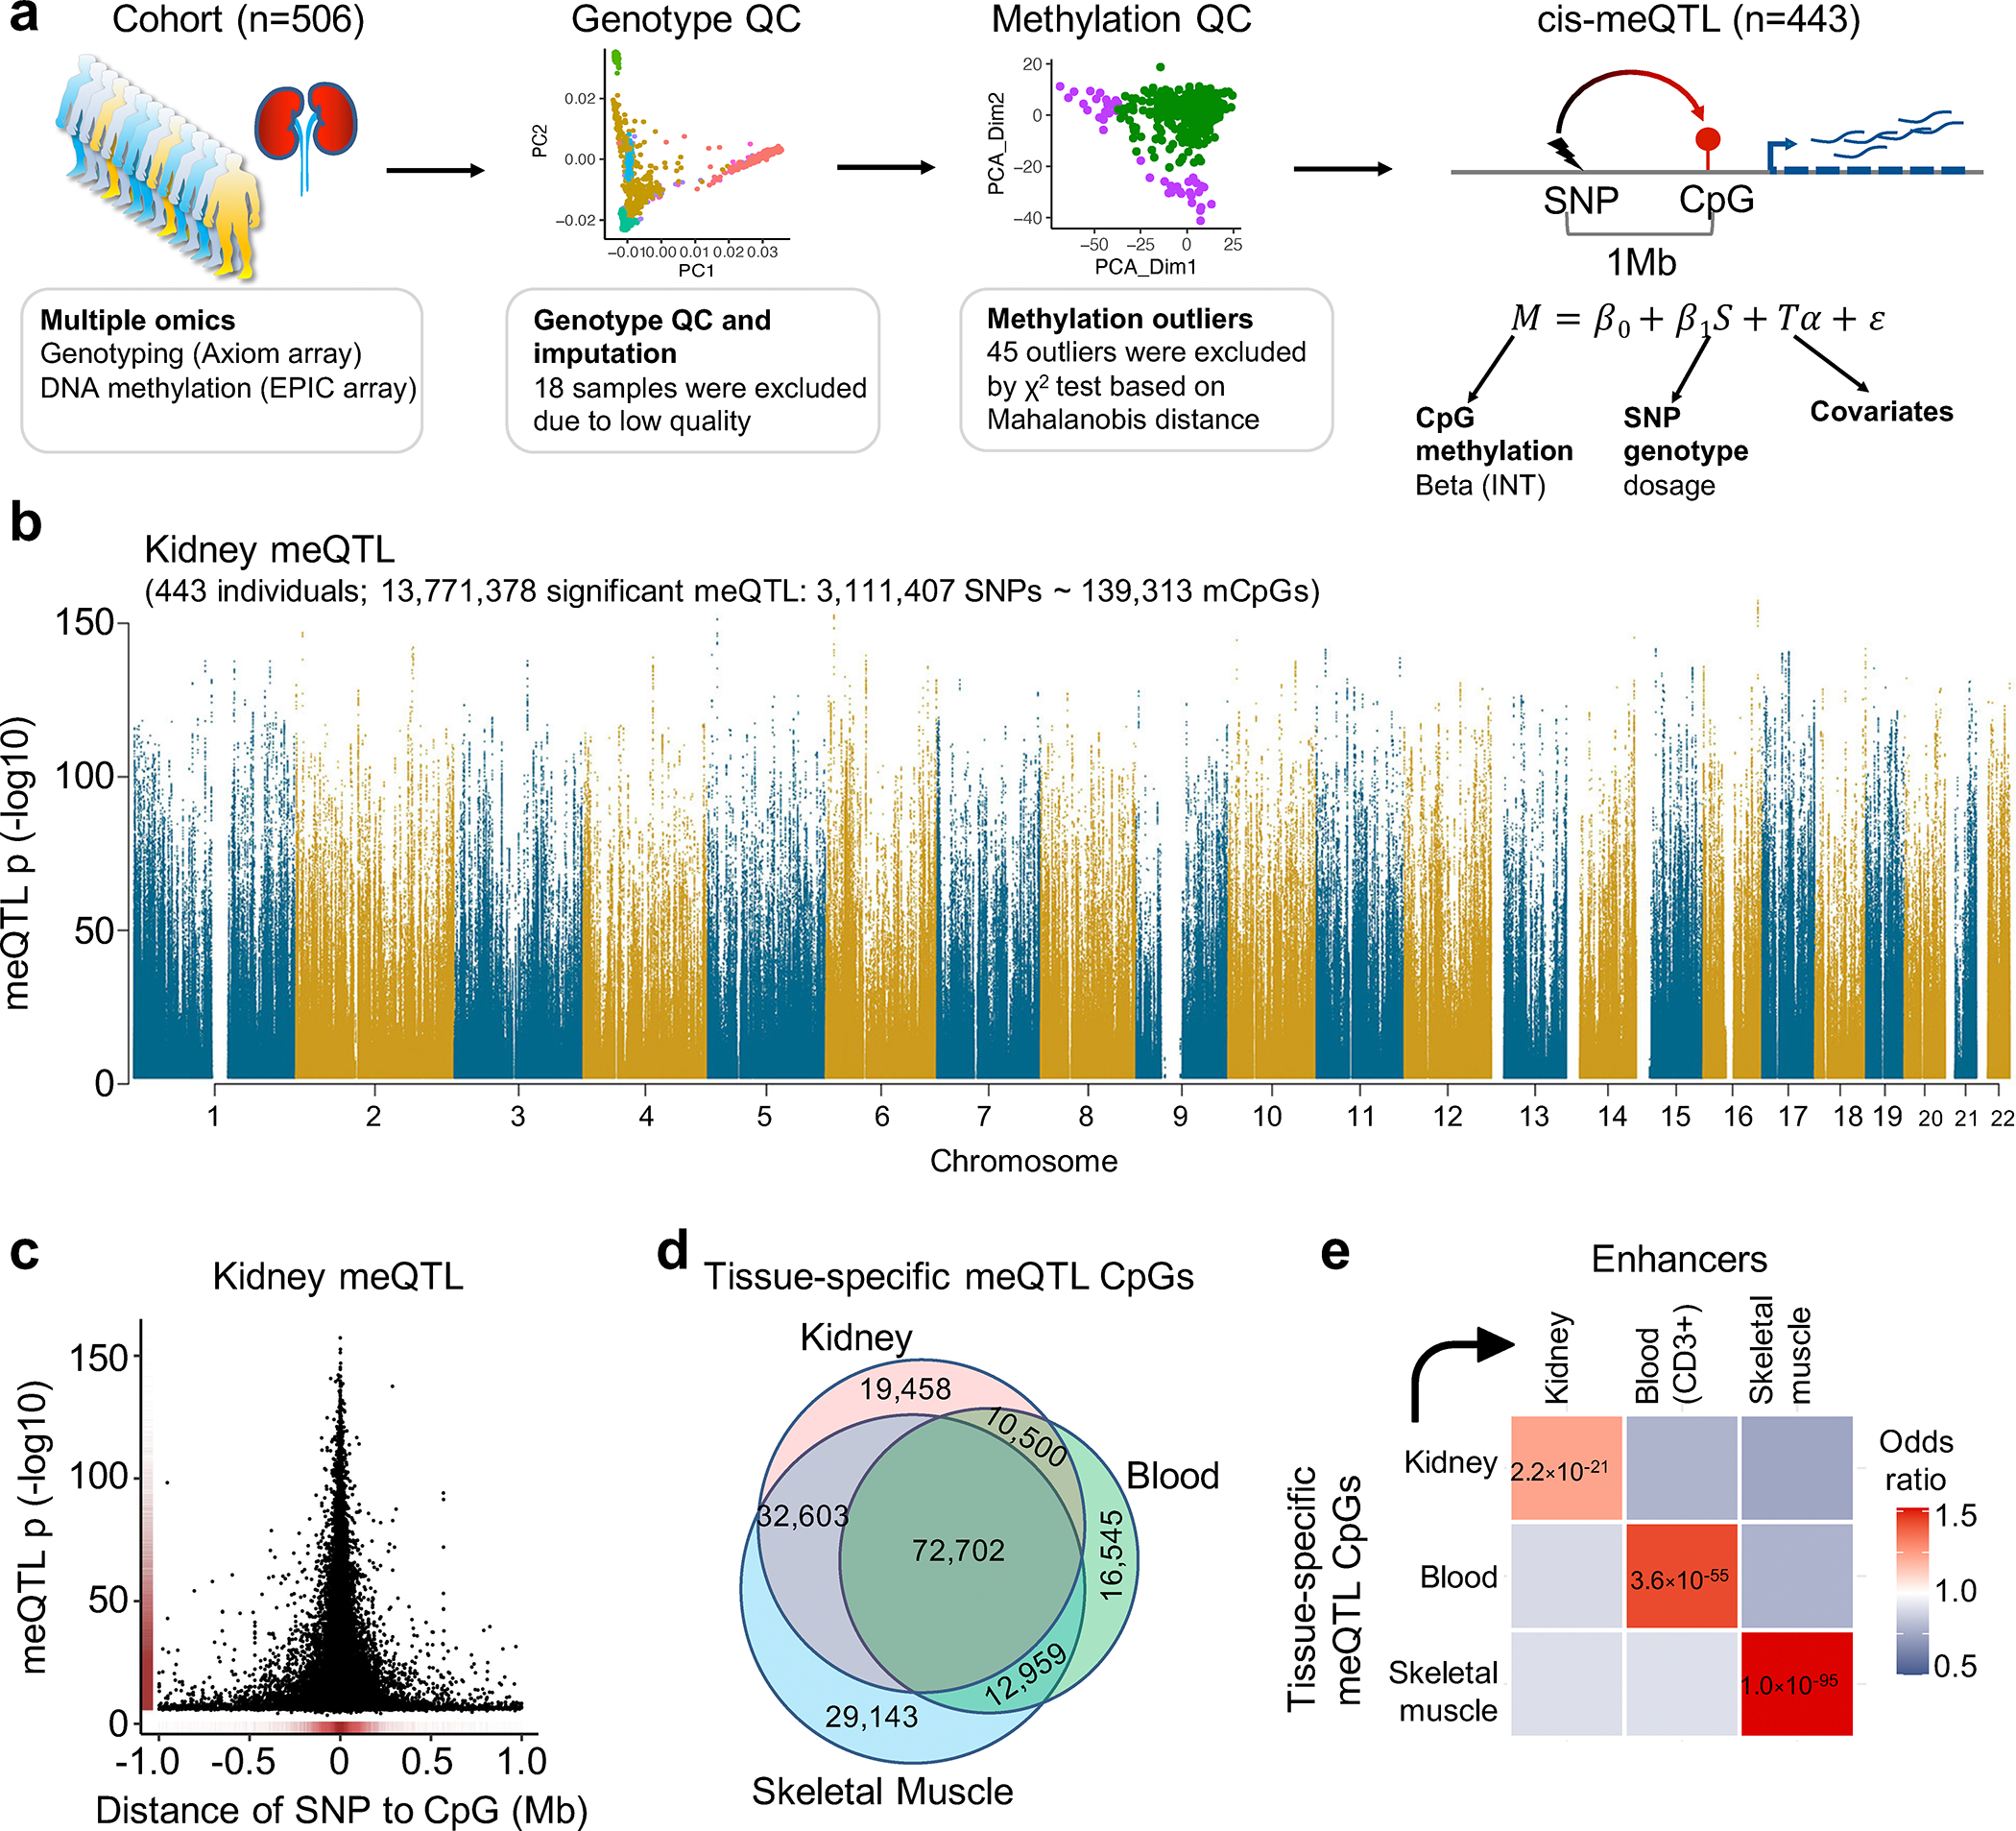
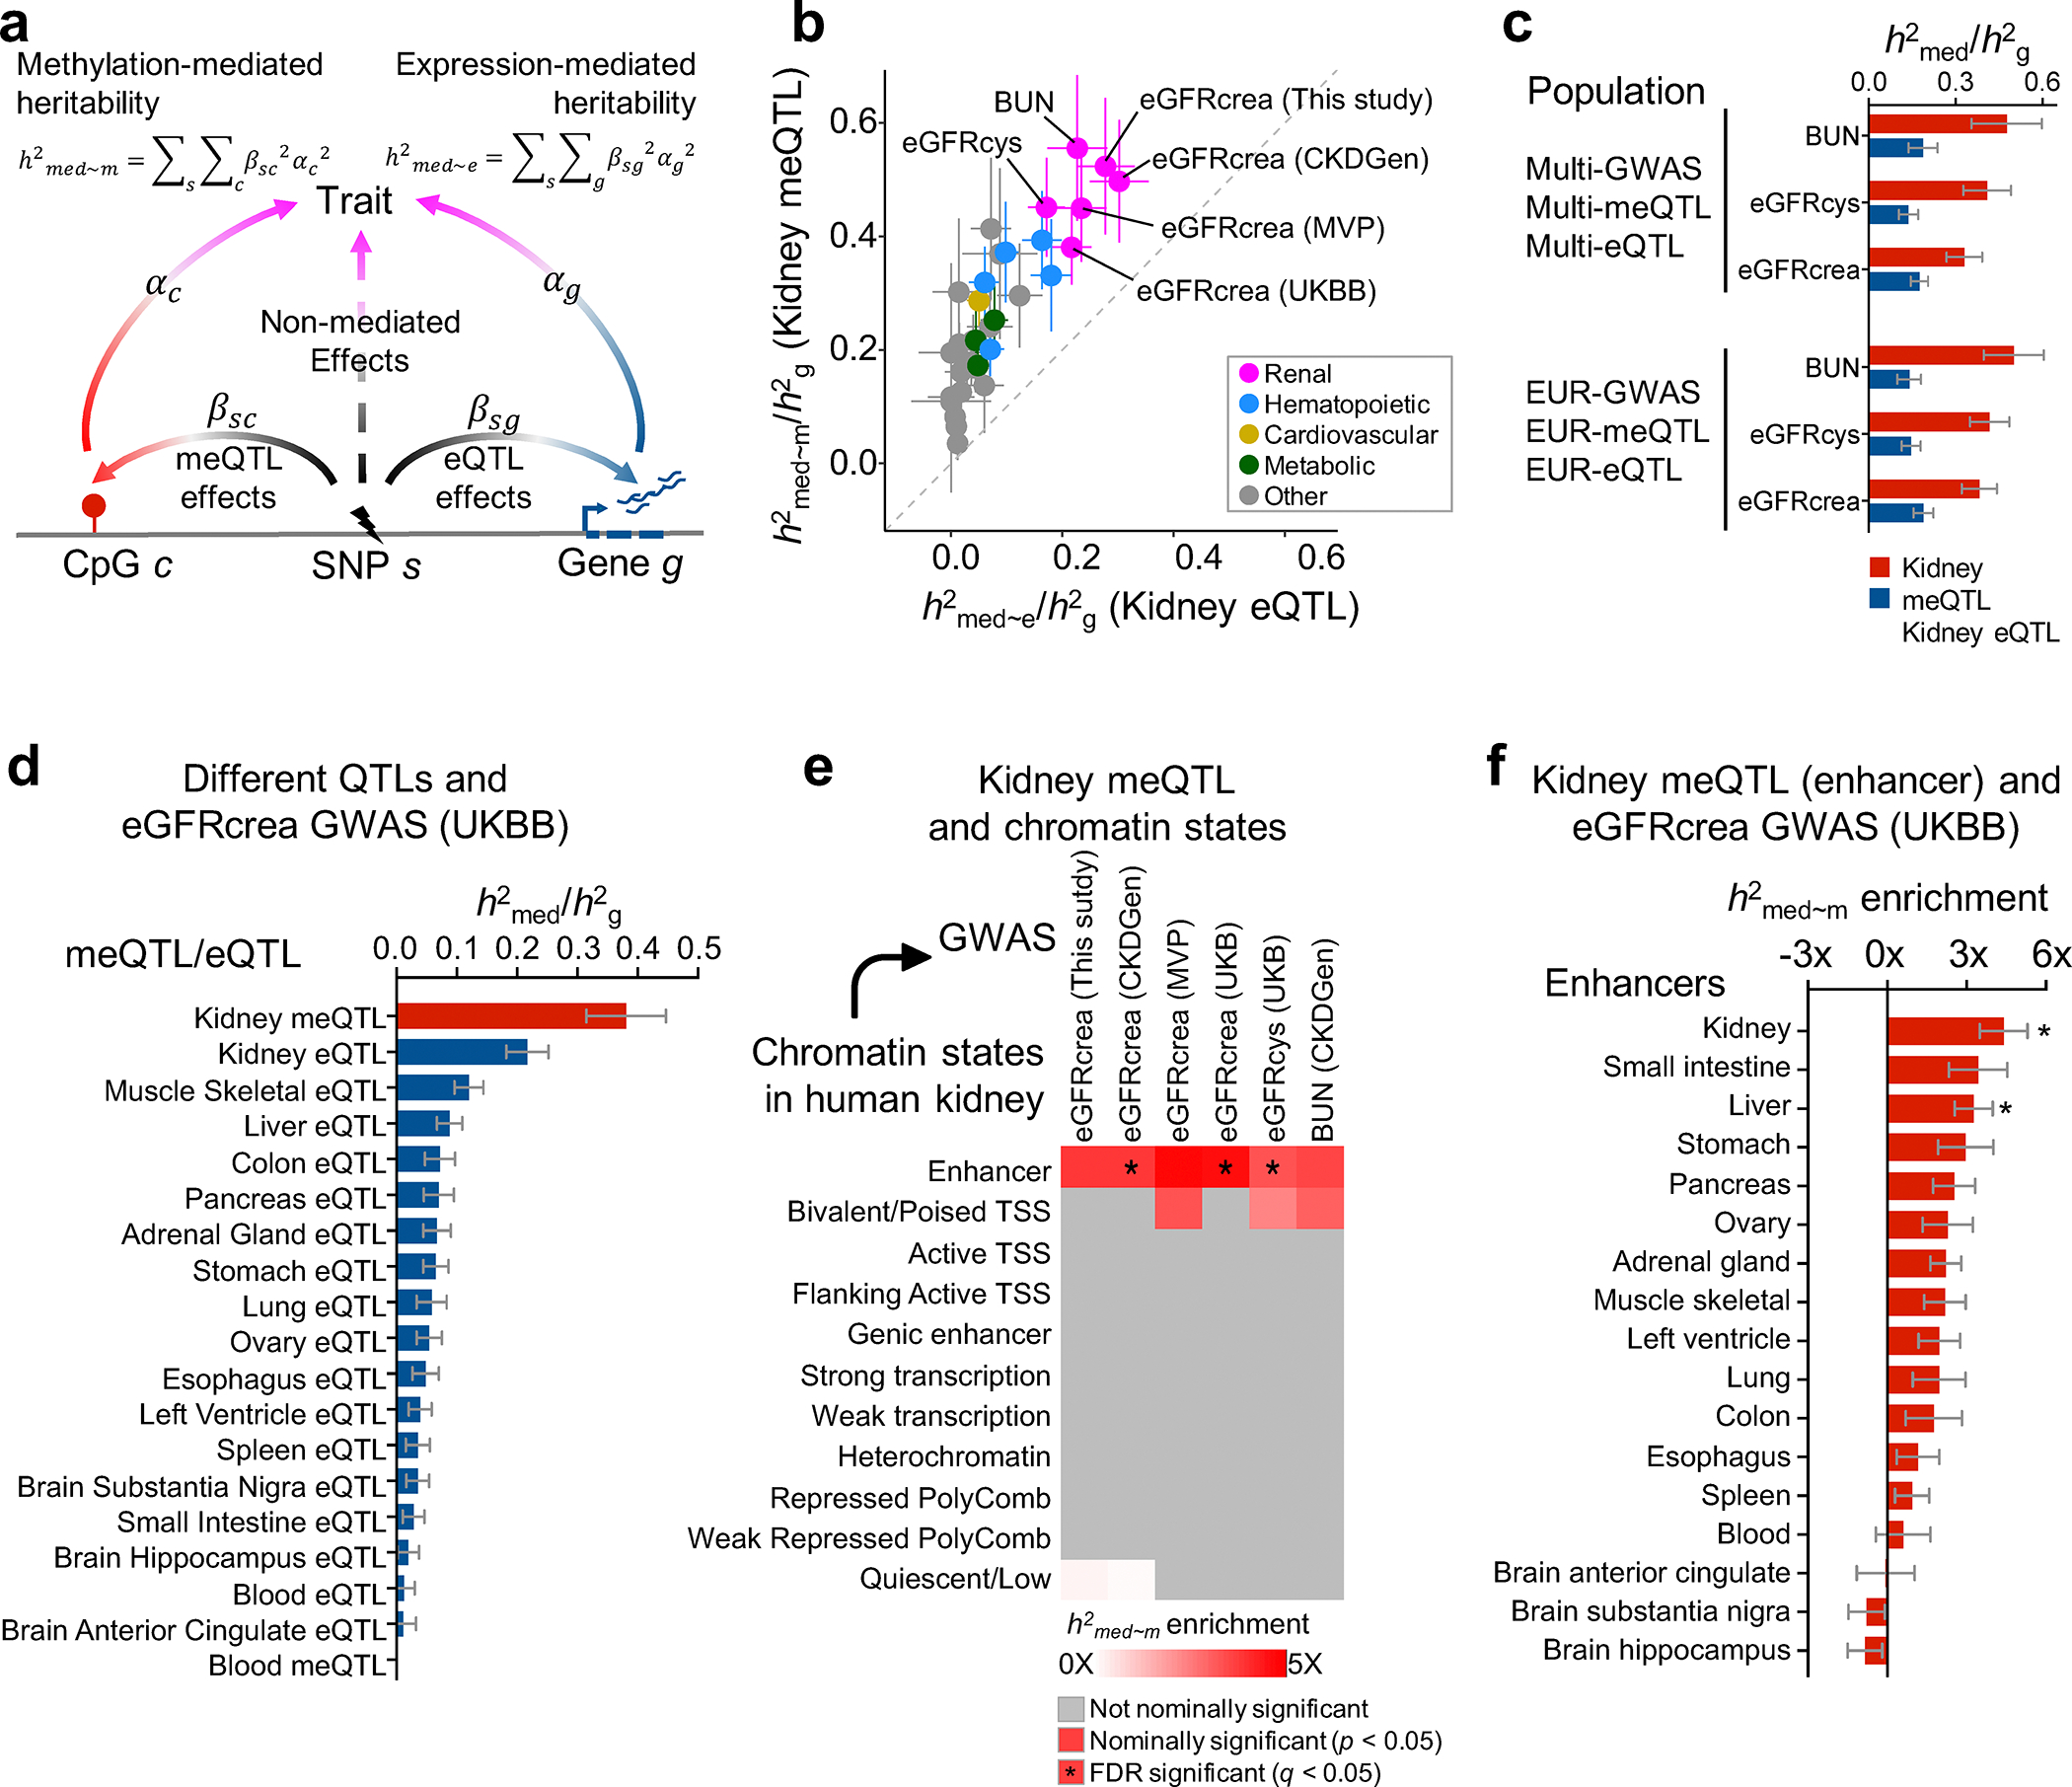
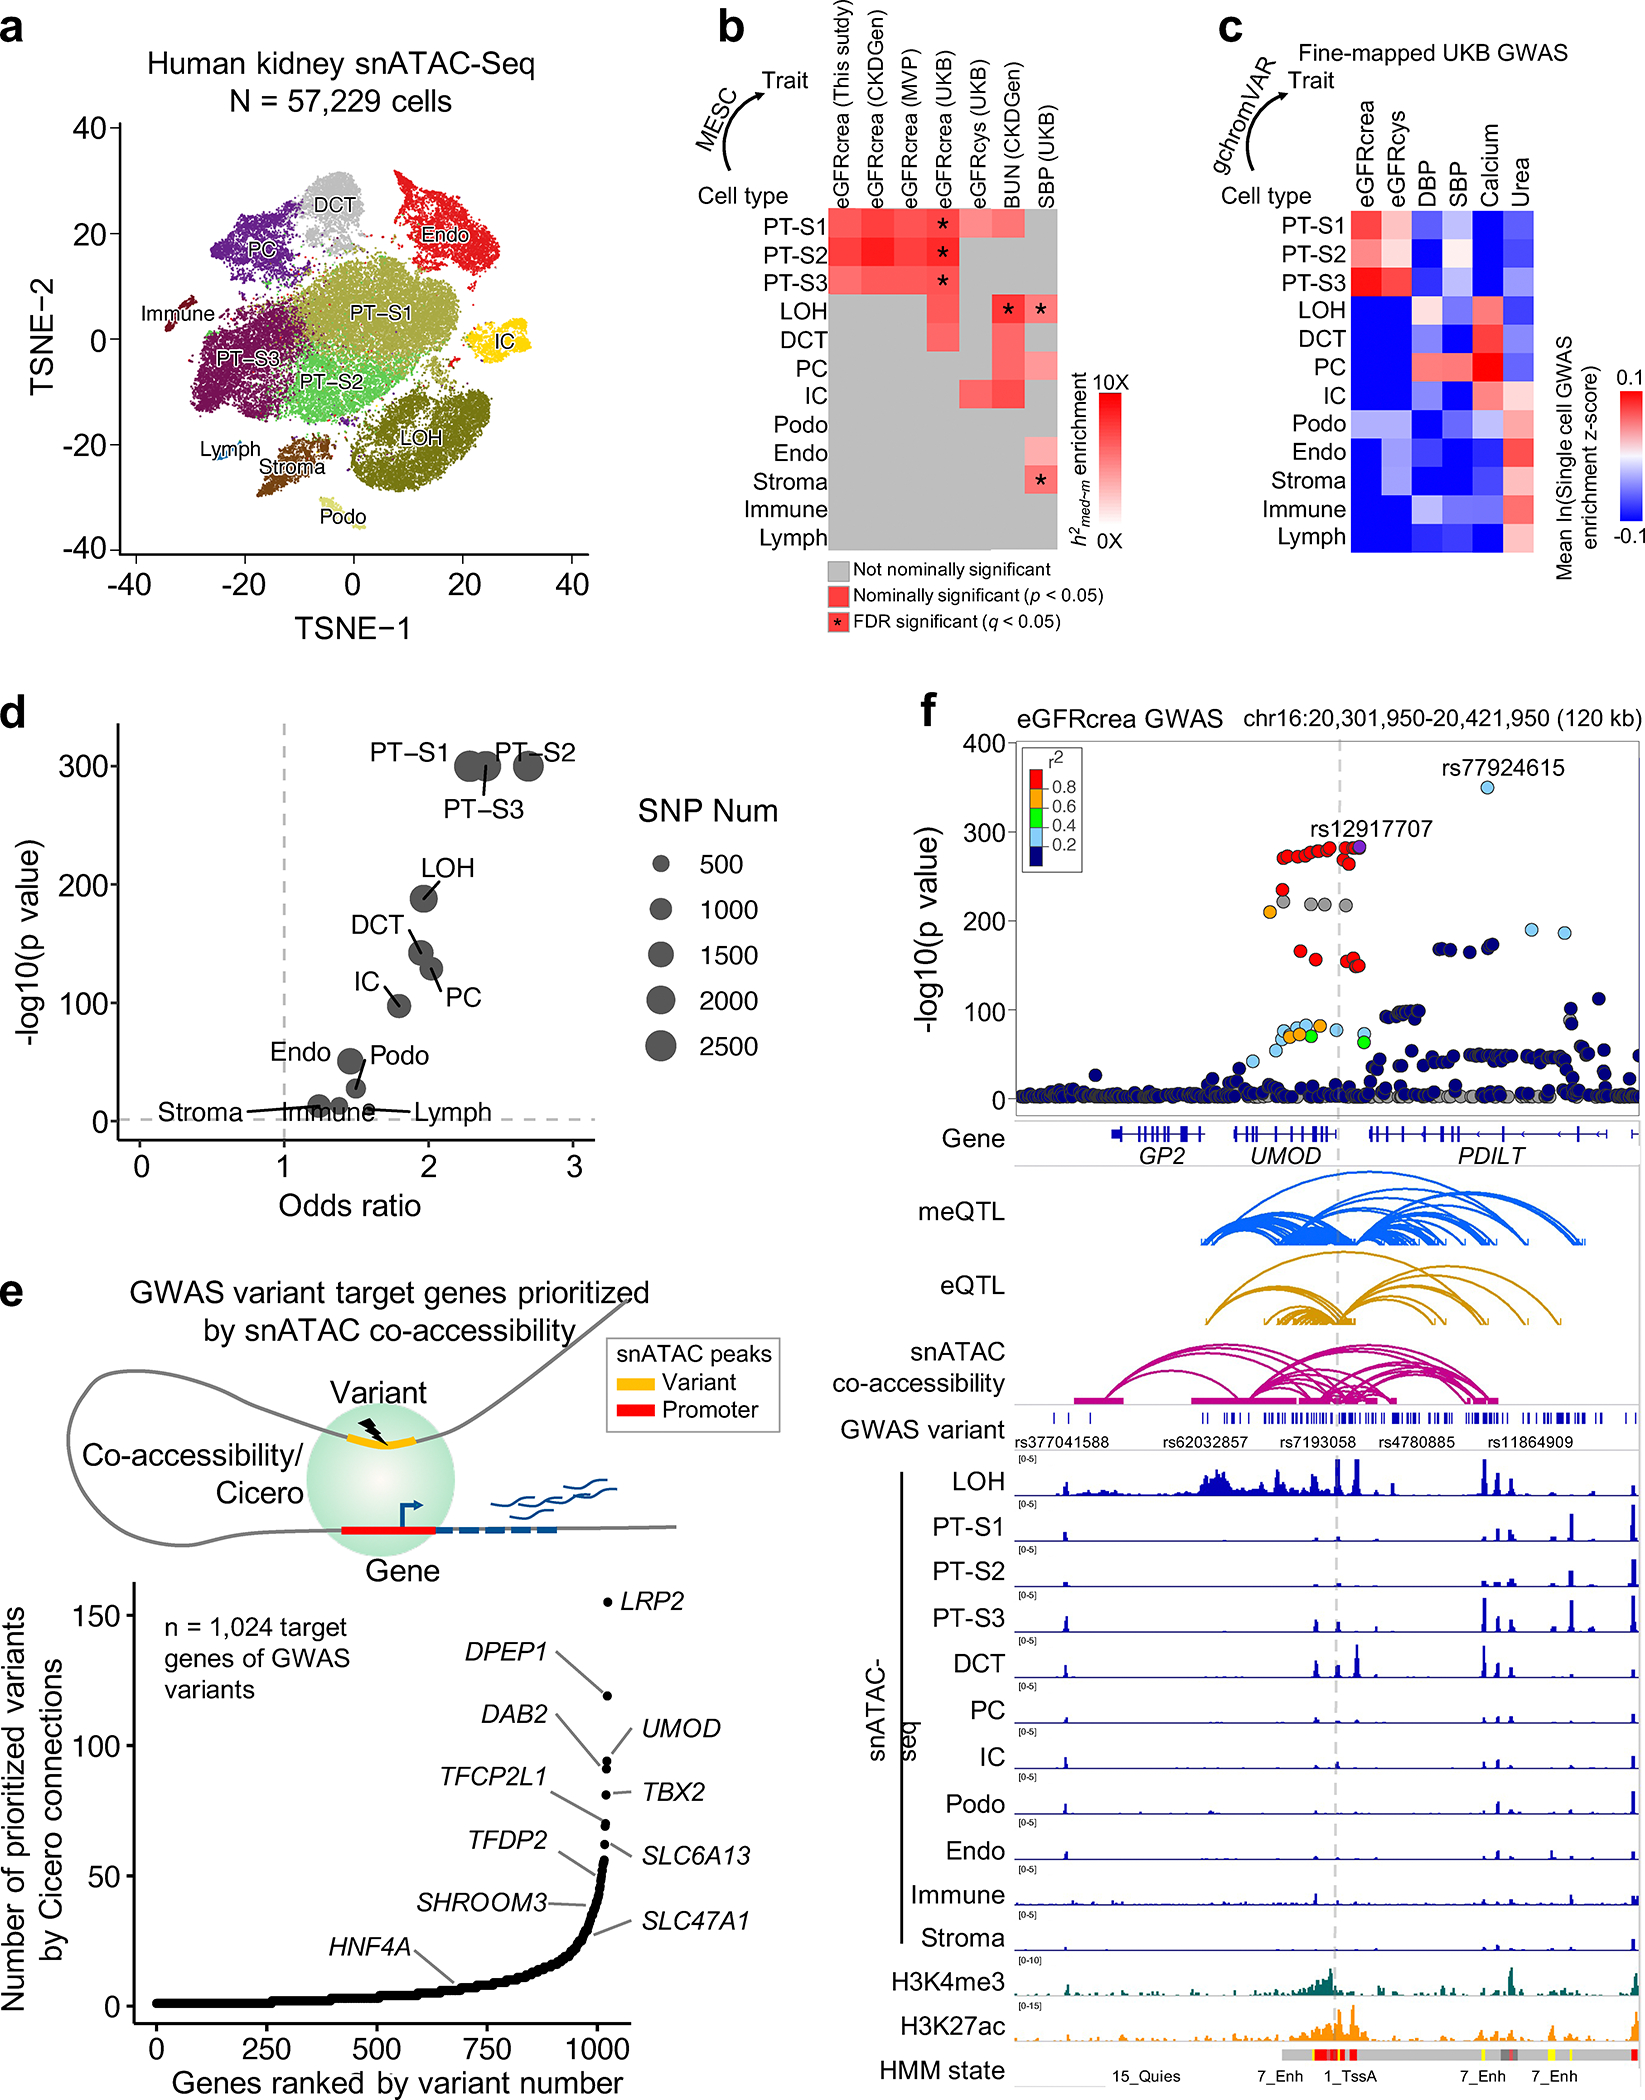
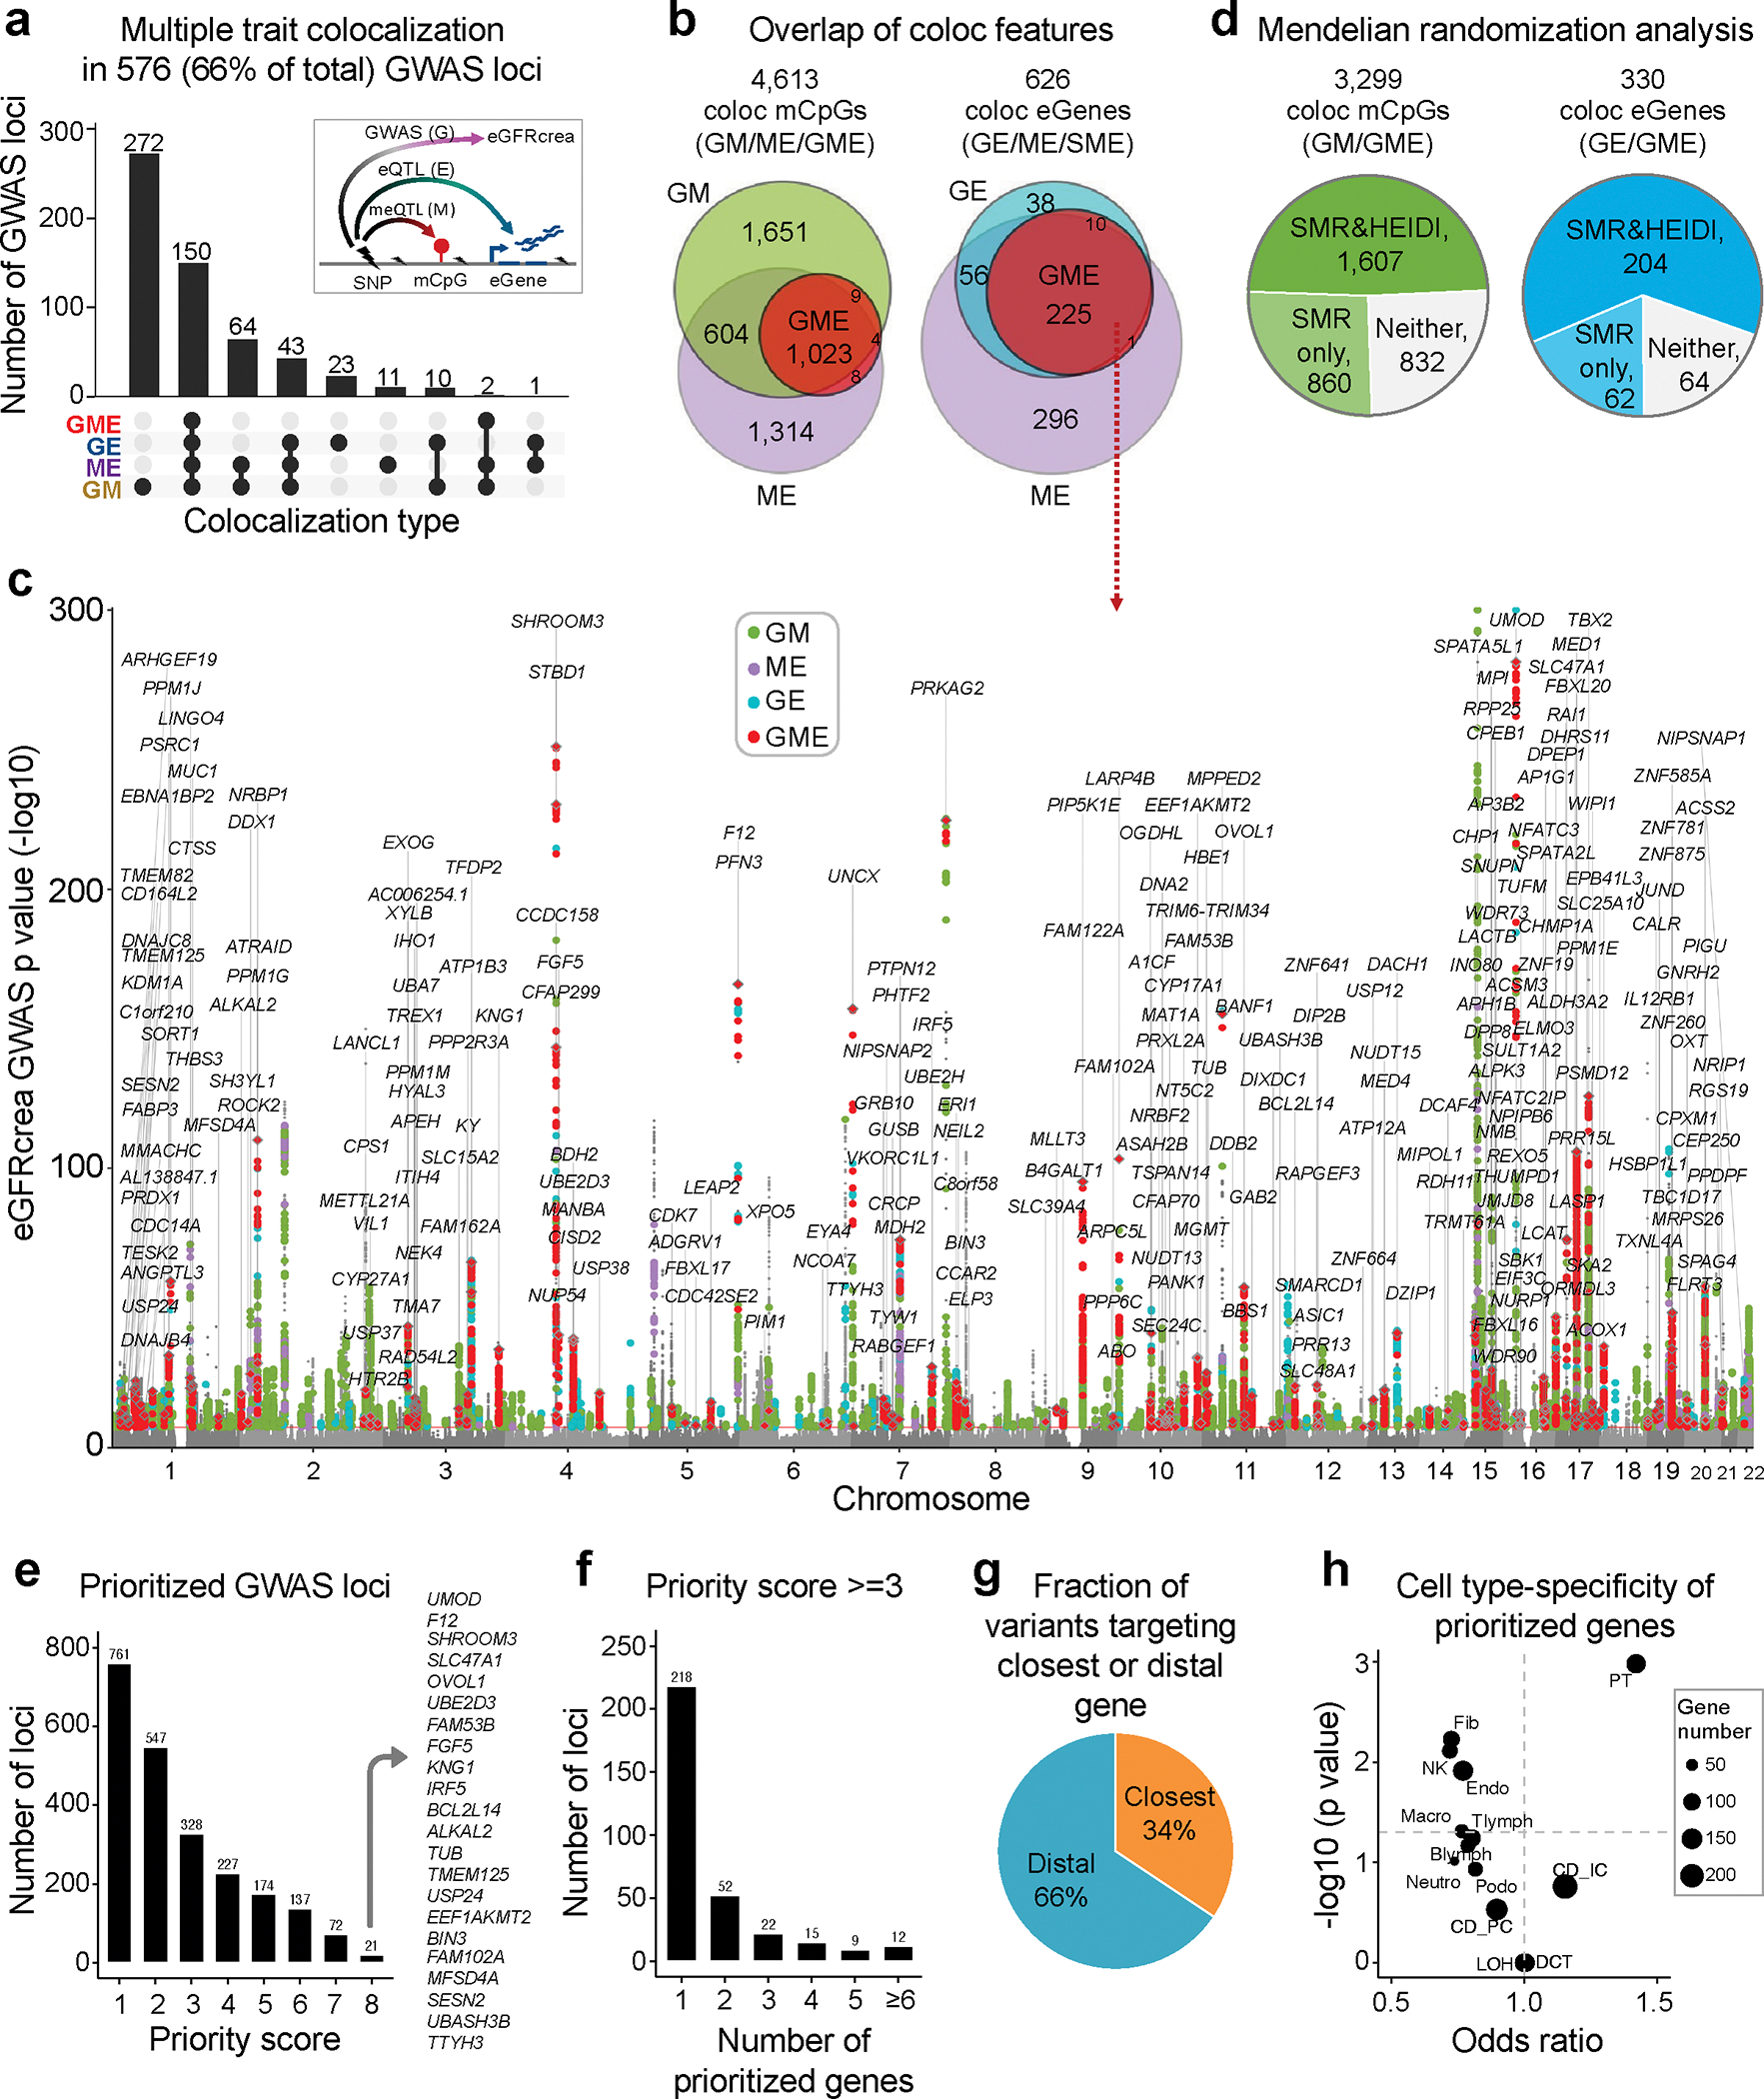
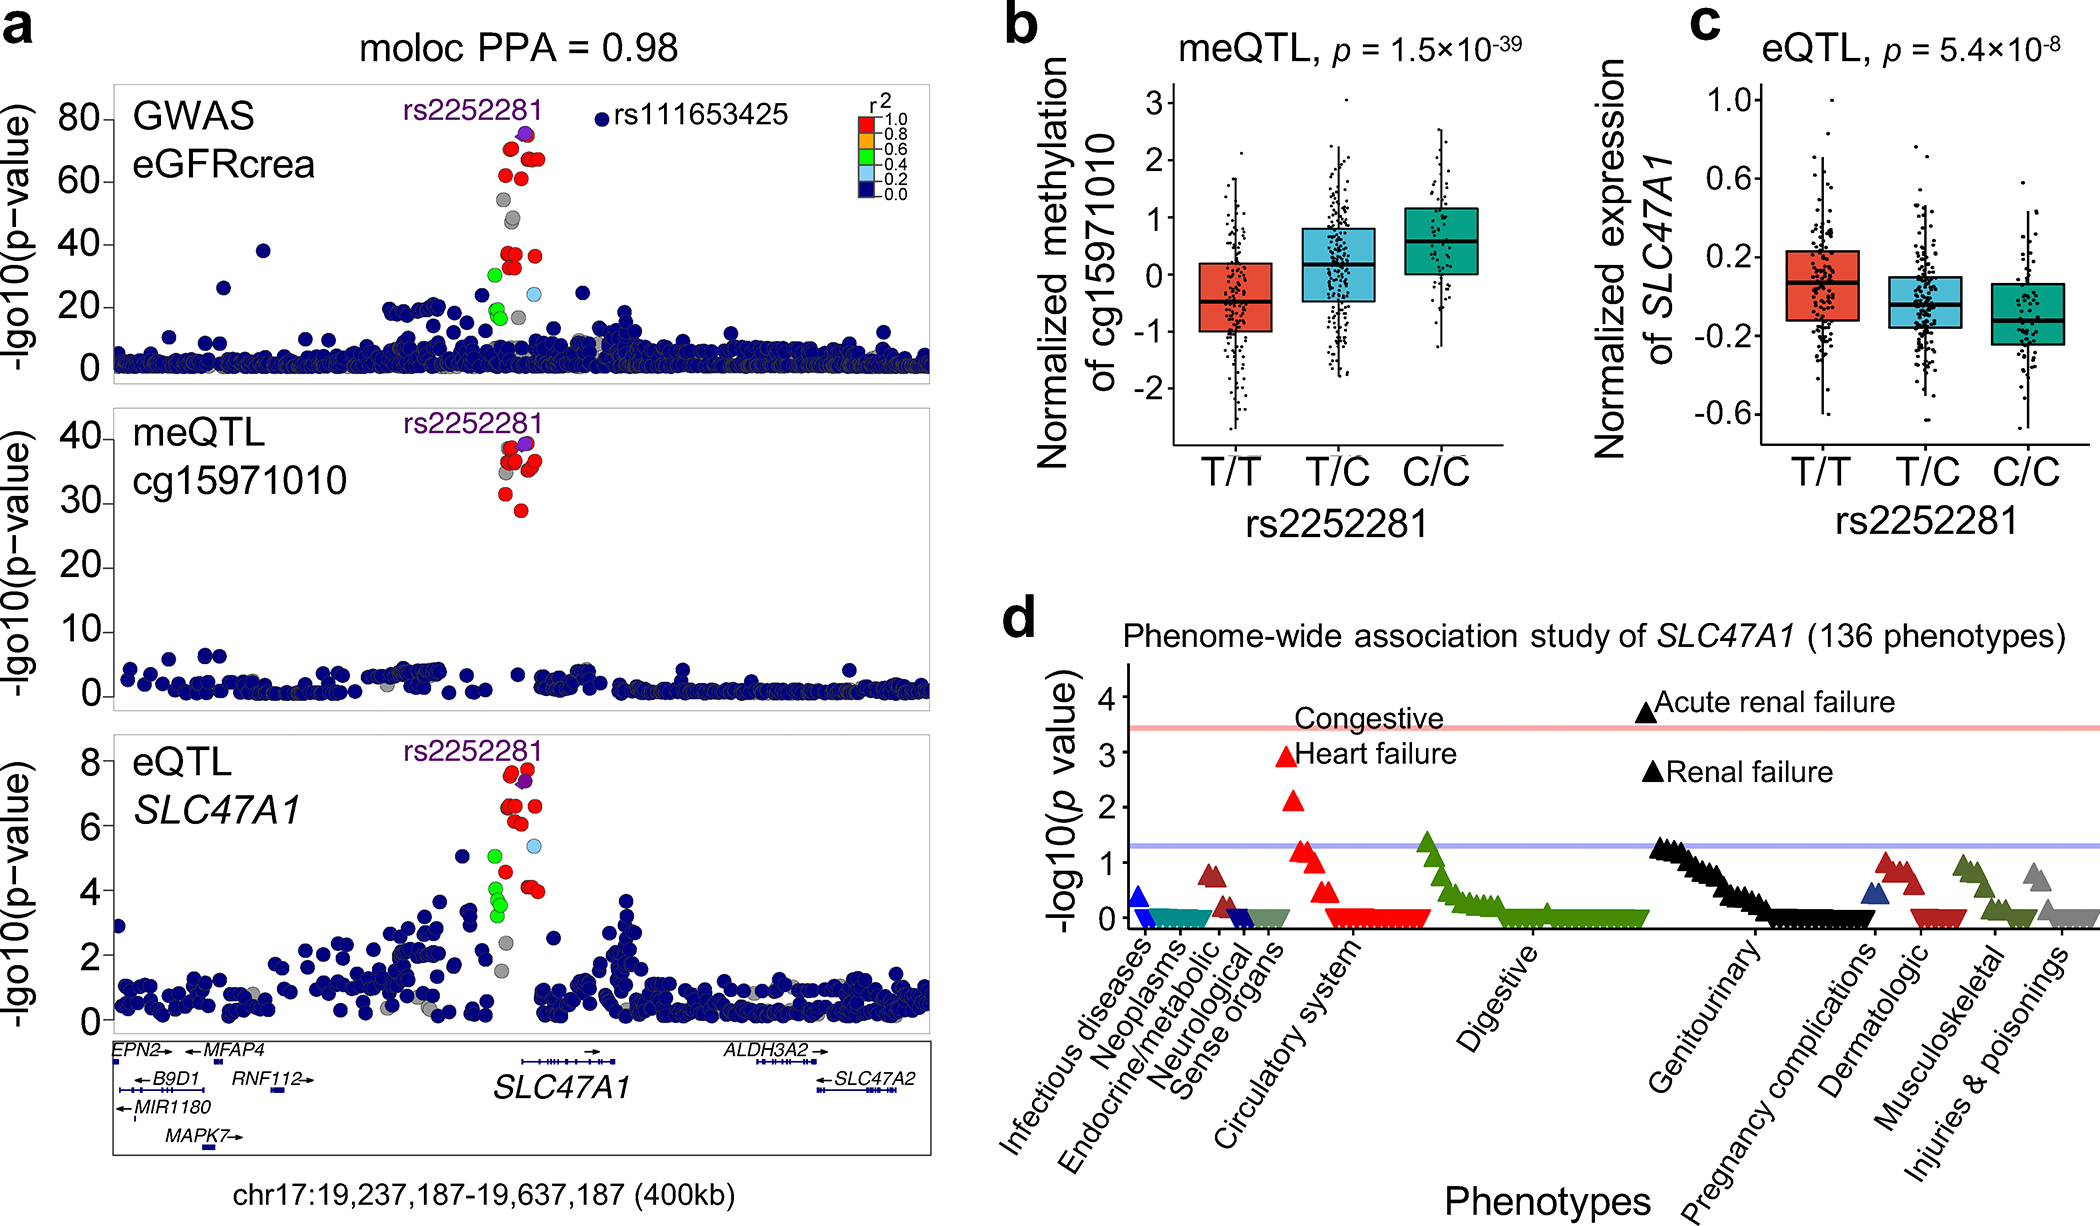
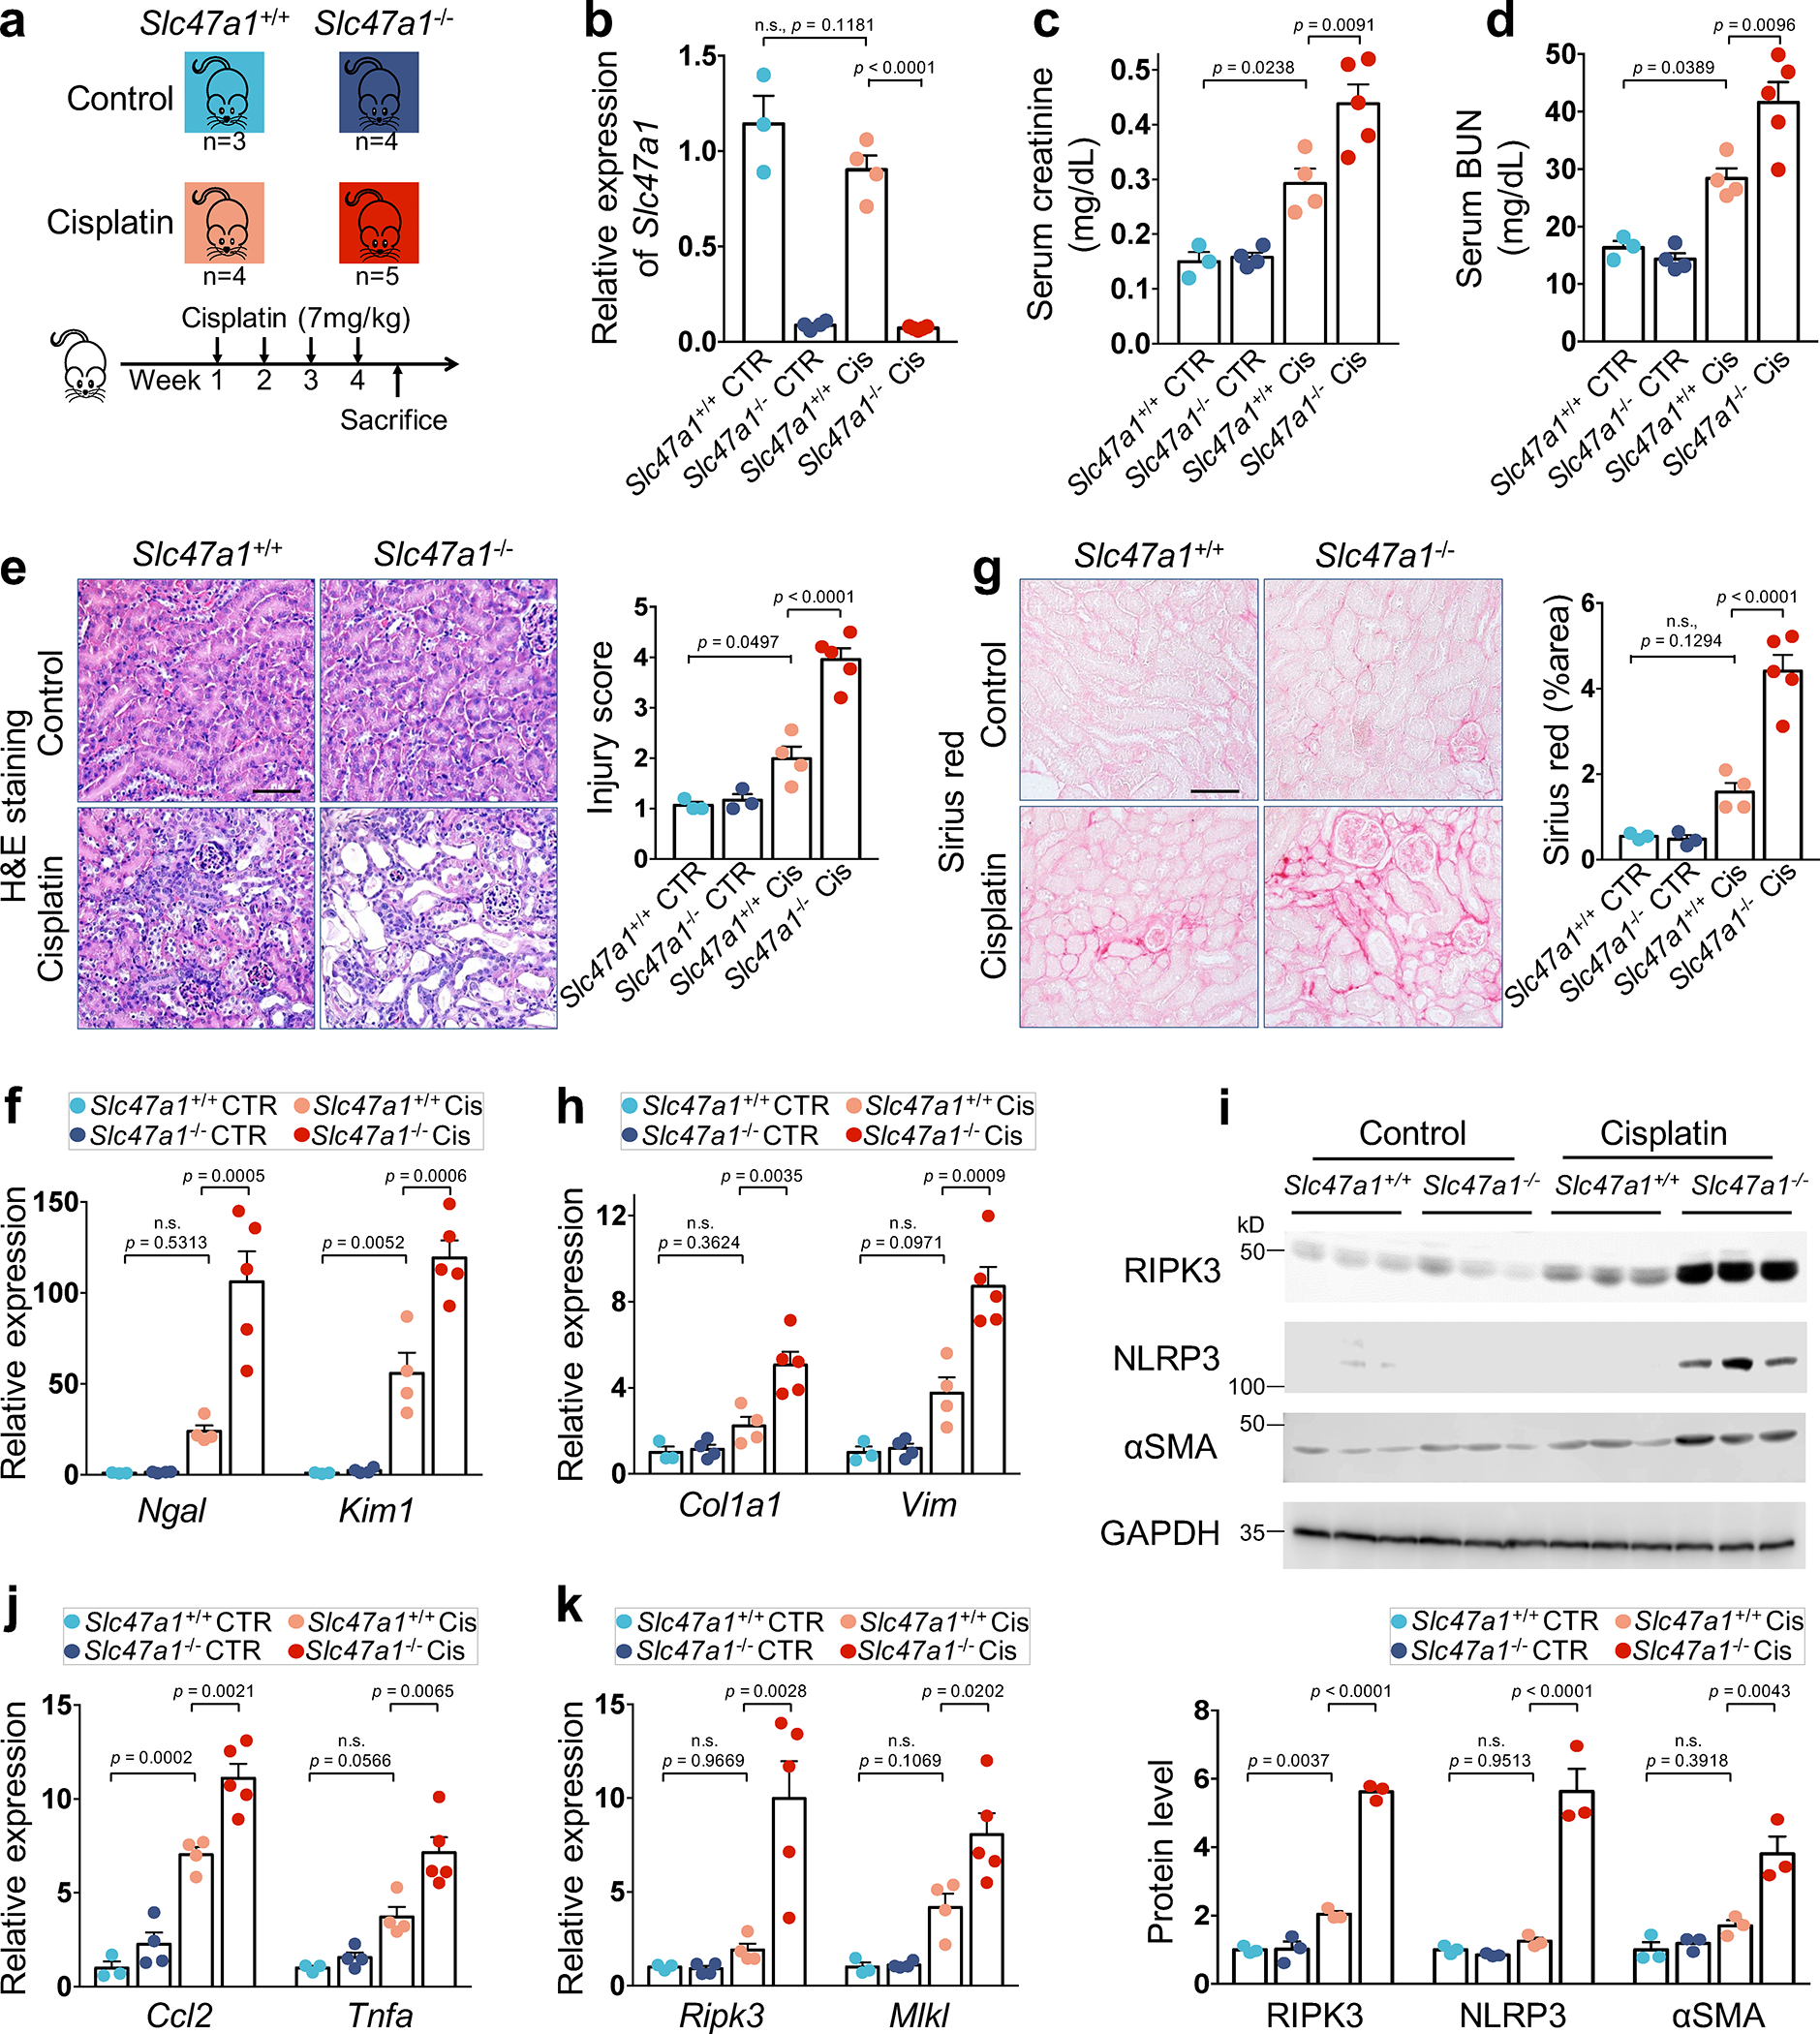
More than 800 million people suffer from kidney disease, yet the mechanism of kidney dysfunction is poorly understood. In the present study, we define the genetic association with kidney function in 1.5 million individuals and identify 878 (126 new) loci. We map the genotype effect on the methylome in 443 kidneys, transcriptome in 686 samples and single-cell open chromatin in 57,229 kidney cells. Heritability analysis reveals that methylation variation explains a larger fraction of heritability than gene expression. We present a multi-stage prioritization strategy and prioritize target genes for 87% of kidney function loci. We highlight key roles of proximal tubules and metabolism in kidney function regulation. Furthermore, the causal role of SLC47A1 in kidney disease is defined in mice with genetic loss of Slc47a1 and in human individuals carrying loss-of-function variants. Our findings emphasize the key role of bulk and single-cell epigenomic information in translating genome-wide association studies into identifying causal genes, cellular origins and mechanisms of complex traits.


Conflict of interest statement

Competing interests

The laboratory of Dr. Susztak receives funding from GSK, Regeneron, Gilead, Merck, Boehringer Ingelheim, Bayer, Novartis Maze, Jnana, Ventus and Novo Nordisk. The funders had no influence on the data analysis. Dr. Susztak serves on the SAB of Jnana pharmaceuticals and receives equity. Dr. Ritchie serves on the SAB for Goldfinch Bio and Cipherome. The other authors declare no competing interests.

Figures

Extended_Data_Fig 1.
Extended_Data_Fig 1.. Meta-analysis of eGFRcrea GWAS and validation using eGFRcys and BUN GWAS.
a. Manhattan plots of meta-analysis eGFRcrea GWAS (N=1,508,659 individuals) and eGFRcrea GWAS datasets including CKDGen, UKBB, MVP, PAGE and SUMMIT. For each panel, the x-axis is chromosomal location of SNP. The y-axis strength of association -log10(p). The two-sided p value was obtained from GWAS studies. b. Scatter plot of effect size correlation between meta-analysis eGFRcrea GWAS (x-axis) and five source eGFRcrea GWAS data from CKDGen, UKBB, MVP, PAGE and SUMMIT (y-axis). The density of dots from low to high are shown from yellow to red. Correlation coefficient was calculated using Spearman's rho (R) statistic and two-sided p value was calculated using asymptotic t approximation. c. Scatter plot of effect sizes between eGFRcrea GWAS (N=1,508,659 individuals) and eGFRcys GWAS (N=421,714 individuals). Significant eGFRcrea GWAS variants passing two-sided p < 5×10⁻⁸ in this study were used for the plot. Red dots represent validated variants showing nominally significant (two-sided GWAS p < 0.05) association with eGFRcys in the same effect direction. Correlation coefficient was calculated using Spearman's rho (R) statistic and two-sided p value was calculated using asymptotic t approximation. d. Scatter plot of effect sizes between eGFRcrea GWAS (N=1,508,659 individuals) and BUN GWAS (N=852,678 individuals). Significant eGFRcrea GWAS variants passing two-sided p < 5×10⁻⁸ in this study were used for plot. Blue dots represent validated variants showing nominally significant (two-sided GWAS p < 0.05) association with BUN in the opposite effect direction. Correlation coefficient was calculated using Spearman's rho (R) statistic and two-sided p value was calculated using asymptotic t approximation. e. Venn plot of eGFRcrea GWAS significant variants validated by eGFRcys GWAS or BUN GWAS. Y-axis is strength of GWAS association -log10(p value based of z statistic).
Extended_Data_Fig2.
Extended_Data_Fig2.. Identification and function annotation of independent eGFRcrea GWAS loci.
a. The strategy to identify independent loci and novel eGFRcrea GWAS loci. b. Pie chart of the number of independent loci categorized into different groups by comparing previously reported sentinel variants tagging independent loci. c. Pie chart of the number of novel independent loci validated by eGFRcys GWAS and/or BUN GWAS. d. Functional enrichment analysis of 126 novel independent loci annotated by GREAT. The positions of lead SNPs were inputted into GREAT (http://great.stanford.edu/public/html/), and the two nearest genes within 1Mb were used for function enrichment in mouse phenotype catalogue. The two-sided uncorrected p-value was calculated by binomial test over inputted loci, and false discovery rate q-value was calculated for multiple test correction. e. Literature-based gene function of the closest genes to the 126 novel kidney disease loci. f. Expression of the mouse orthologues of 42 kidney disease genes (of the 126 newly identified GWAS genes) in adult mouse kidney samples (GSE107585). The mean expression was calculated for each cell types and z-scores were plotted. g. LocusZoom view of three novel independent loci, MEP1A, ABCC2 and NFIA. Y-axis is strength of association -log10(two-sided p value from GWAS meta-analysis z-statistic).
Extended_Data_Fig3.
Extended_Data_Fig3.. Meta-analysis of the kidney cis-eQTL data.
a. Manhattan plot of eQTL meta-analysis by integrating four eQTL datasets consisting of a total of 686 kidney samples. X-axis is chromosomal location of SNP, and y-axis is strength of association -log10 (two-sided p value based z-statistic from eQTL meta-analysis). b. Manhattan plot of eQTLs by Sheng et al. (n=356 human kidney tubule samples). X-axis is chromosomal location of SNP, and y-axis is strength of association -log10 (two-sided p value from linear regression eQTL model). c. Manhattan plot of eQTLs by Ko et al. (n=91 human kidney cortex samples). X-axis is chromosomal location of SNP, and y-axis is strength of association -log10 (two-sided p value from linear regression eQTL model). d. Manhattan plot of eQTLs by GTEx (v8) (n= 73 human kidney cortex samples). X-axis is chromosomal location of SNP, and y-axis is strength of association -log10 (two-sided p value from linear regression eQTL model). e. Manhattan plot of eQTLs by NephQTL (n=166 human kidney tubule samples). X-axis is chromosomal location of SNP, and y-axis is strength of association -log10 (two-sided p value from linear regression eQTL model). f. Scatter plots of effect size correlation between eQTL meta-analysis and each individual eQTL datasets. The common variant-gene pairs passing eQTL p < 0.00001 in any of the two datasets were used for each plot. The density of dots from low to high was represented by yellow to red. Correlation coefficient was calculated using Spearman's rho (R) statistic and two-sided p value was calculated using asymptotic t approximation.
Extended_Data_Fig4.
Extended_Data_Fig4.. Functional annotation of kidney-specific meQTLs and mCpGs.
a. Tissue-specific and shared meQTLs across kidney, blood and skeletal muscle tissue. M value > 0.9 was used to define meQTL for each set. b. Fraction of meQTL CpGs annotated by ChromHMM chromatin states in kidney, blood (CD3+) cell and skeletal muscle. c. Transcription factor motif enrichment (HOMER) of tissue-specific mCpGs. The p value was calculated by binomial test. d. Enrichment of kidney specific meQTL CpGs to cell type-specific open chromatin regions determined by snATAC-seq in human kidney. X-axis is odds ratio and Y-axis is strength of enrichment -log10(two-sided chi-square test p). Size of the dot represents the number of kidney-specific meQTL CpG sites. e. Enrichment of kidney specific meQTL SNPs to GWAS traits. X-axis is odds ratio and Y-axis is strength of enrichment -log10(two-sided chi-square test p). Size of the dot represents the number of SNPs and colors represent the type of GWAS trait.
Extended_Data_Fig5.
Extended_Data_Fig5.. Human kidney expression quantitative trait methylation (eQTM)
a. Schematic representation of the eQTM analysis. b. eQTM discovery rate estimated by the number of identified CpG~Gene pairs using different number of PEER factors as covariates. c. Volcano plot of eQTMs. The x-axis is the beta value and y-axis the strength of association (-log10(p)). Negative and positive eQTMs are colored in blue and red, respectively. d. The fraction of identified meQTL CpGs by eQTM analysis. The red line is the global FDR, dark blue line CpG level FDR and light blue line is nominal significance threshold. The x-axis is the eQTM significance and the y-axis is the cumulative fraction of meQTL CpGs. Vertical line represents the significance cutoff 0.05. e. Validation of the eQTMs in publicly available eQTM studies. Correlation coefficient was calculated using Spearman's rho (R) statistic and two-sided p value was calculated using asymptotic t approximation. f. Scatter plot of CpG methylation (x-axis) and gene expression of PMD201 and CYP4F1 (y-axis) in 414 kidney samples. Each dot represents one kidney sample. Correlation coefficient was calculated using Spearman's rho (R) statistic and two-sided p value was calculated using asymptotic t approximation. g. IGV visualization of eQTM association at the PM20D1, CYP4F11 and TBX5 loci. h. Number and fraction of negative and positive eQTM CpGs associated with the expression of nearest or distal genes. The nearest gene was defined based on the TSS (transcription start site) to eQTM CpG distance. The distal gene was defined if it was not the closest TSS to the eQTM CpG. Two-sided p value was calculated by chi-square test. i. Relative fraction of negative and positive eQTM CpGs localized to regulatory regions in the kidney. j. Profile plot of H3K4me3, H3K4me1, H3K27ac, and H3K27me3 histone modification across negative and positive eQTM CpGs and 5kb flanking regions.
Extended_Data_Fig6.
Extended_Data_Fig6.. Estimated proportion of heritability mediated by kidney methylation and expression.
a. Estimation of heritability (h2med/h2g) mediated by kidney meQTL, kidney eQTL and the eQTL of best non-kidney GTEx tissue for three kidney function traits based three different biomarkers (eGFRcrea, eGFRcys and BUN). Here, best non-kidney GTEx tissue refers to the non-kidney tissue whose eQTL resulted in the highest estimates of h2med/h2g compared to all other non-kidney tissues. The x-axis represents different QTL groups and y-axis for h2med/h2g estimated for three kidney function traits Data are presented as mean ± SD. P values were calculated by one-tailed paired t test. b-c. Estimation of eGFRcrea GWAS heritability (h2med/h2g) mediated by methylation and expression for different number of human kidneys using multi-ancestry datasets (b) and European-ancestry datasets(c). The x-axis represents sample sizes used for the meQTL and eQTL, and y-axis for h2med/h2g estimated for eGFRcrea GWAS. d. Estimation of eGFRcrea and eGFRcys GWAS heritability mediated by meQTL and eQTL from different tissues. The x-axis represents h2med/h2g, while the y-axis represents eQTL or meQTL data obtained from different tissues. meQTL data is shown in red and eQTL in blue. e. Estimation of heritability mediated by kidney eQTL and non-kidney eQTL for six kidney function traits and 28 independent non-kidney GWAS traits. The x-axis represents h2med/h2g, while the y-axis represents different GWAS traits. For each trait, kidney eQTL data is shown in blue and best non-kidney GTEx tissue in gray. Here, best non-kidney GTEx tissue refers to the non-kidney tissue whose eQTL resulted in the highest estimates of h2med/h2g compared to all other non-kidney tissues. (b-e) For each bar plot, the centre of error bar represents the value of h2med/h2g, and error bar represent jackknife standard error estimated for h2med/h2g.
Extended_Data_Fig7.
Extended_Data_Fig7.. Enrichment of GWAS trait heritability mediated by enhancer methylation in 128 tissues/cell types.
a. GWAS heritability mediated by kidney methylation categorized as enhancers in 128 tissues/cell types. The x-axis shows the GWAS traits, while the y-axis shows tissue enhancers in kidney and 127 other tissue samples from the Roadmap project ChromHMM data. Gray, non-significant, while white to red indicates significant enrichment (nominal two-sided p < 0.05 calculated by MESC). Asterisk indicates h2med enrichment passing FDR q < 0.05 (accounting for 4,352 tests for 128 enhancer CpG sets and 34 GWAS traits). b. GWAS heritability mediated by blood methylation categorized as enhancers in 128 tissues/cell types. The x-axis shows the GWAS traits, while the y-axis shows tissue enhancers in kidney and 127 other tissue samples from the Roadmap project ChromHMM data. Gray, non-significant, while white to red indicates significant enrichment (nominal two-sided p < 0.05 calculated by MESC). Asterisk indicates h2med enrichment passing FDR q < 0.05 (accounting for 4,352 tests for 128 enhancer CpG sets and 34 GWAS traits).
Extended_Data_Fig8.
Extended_Data_Fig8.. Gene prioritization for eGFRcrea GWAS variants and functional annotation
a. Schematic representation of gene prioritization strategy based on eight prioritization datasets and methods. b. Number of eGFRcrea GWAS variants prioritized using different priority score threshold. c. eGFRcrea GWAS independent loci prioritized by this study (priority score ≥ 1) and previous studies. The number represents the number of independent loci overlapping with independent signals prioritized (GPS score ≥ 1) by Stanzick et al. and/or creatinine-associated exome rare variants by Backman et al. or Barton et al. d. Features of the top variants prioritized for the 328 loci with priority score ≥ 3. Each row shows the top variant for each locus. Loci were ordered from top to bottom based on priority scores from 8 to 3. Loci with the same priority score were ordered by GWAS significance from strongest (dark blue) to lowest (light blue). Each column represents a feature overlapped with the variant. For each feature, the fraction of overlapping variants is shown in the upper panel. 22 top prioritized genes supported by all eight datasets and methods were listed. e. Tissue specificity of 566 prioritized genes (priority score ≥ 3) in 54 tissue types (GTEx v8) using GENE2FUNC of FUMA. The x-axis is the 54 tissue types ordered according to significance of enrichment in up-regulated differentially expressed gene sets. Y-axis represents enrichment significance -log10(p value calculated by hypergeometric test). Tissue with Bonferroni p value < 0.05 is shown in red. f. Heatmap of the expression of 417 mouse orthologues of prioritized genes in adult mouse kidney single cell dataset. The mean expression was calculated for each cell types and z-scores were plotted. Right panel shows 87 genes with the highest level of expression in proximal tubule cells.
Extended_Data_Fig9.
Extended_Data_Fig9.. PheWAS analysis of rs111653425 SLC47A1 variants in UKBB and BioMe Biobanks
a. Single variant (rs111653425) PheWAS analysis of SLC47A1 in UKBB dataset. The x-axis is the strength of association -log10(p value calculated by linear regression PheWAS model). Blue line is p = 0.05 and red line is Bonferroni adjusted p = 0.05. The y-axis is the analyzed phenotype. b. SLC47A1 pLOF burden pheWAS analysis in BioMe dataset. The x-axis is the strength of association -log10(p value calculated by linear regression PheWAS model). Blue line is p = 0.05 and red line is Bonferroni adjusted p = 0.05. The y-axis is the analyzed phenotype. c. Single variant (rs111653425) pheWAS analysis of SLC47A1 in BioMe dataset. The x-axis is the strength of association -log10(p value calculated by linear regression PheWAS model). Blue line is p = 0.05 and red line is Bonferroni adjusted p = 0.05. The y-axis is the analyzed phenotype.
Extended_Data_Fig10.
Extended_Data_Fig10.. Slc47a1 loss confers kidney disease risk in mice
a. The relative expression of fibrosis markers; Collagen3 (Col3a1), Collagen4 (Col4a1), Fibronectin (Fn1), and Connective tissue growth factor (Ctgf) in kidney of control or cisplatin treated Slc47a1+/+and Slc47a1−/− mice. Data are presented as mean ± SD. P values were calculated by one-way ANOVA with post hoc Tukey test. n.s., not significant. n=4 biologically independent Slc47a1+/+ cisplatin mice examined over n=3 independent Slc47a1+/+ control; n=5 biologically independent Slc47a1−/− cisplatin mice examined over n=4 independent Slc47a1+/+ cisplatin mice). b. Relative expression of markers of inflammation; Adhesion G protein-coupled receptor E1 (Adgre1), Tumor necrosis factor ligand (Tnfsf12), Interleukin 1beta (Il1b) in kidneys of control or cisplatin treated Slc47a1+/+and Slc47a1−/− mice. Data are presented as mean ± SD. P values were calculated by one-way ANOVA with post hoc Tukey test. n.s., not significant. n=4 biologically independent Slc47a1+/+ cisplatin mice examined over n=3 independent Slc47a1+/+ control; n=5 biologically independent Slc47a1−/− cisplatin mice examined over n=4 independent Slc47a1+/+ cisplatin mice).
Fig. 1.
Fig. 1.. Graphical summary of new datasets created, and analyses performed in this study.
a. Overview of the different genome-wide association and quantitative trait (GWAS, meQTL and eQTL) datasets generated and used in this study. Cohort abbreviations and details found in Supplementary Table 1. b. Schematic representation of our methods and datasets for prioritization and function analysis of kidney disease genes by integrating genetic, human kidney epigenetic, transcriptomics, and human kidney single-nuclear open chromatin information.
Fig. 2.
Fig. 2.. eGFRcrea GWAS of 1.5 million individuals and kidney eQTL for 686 samples.
a. Manhattan plot of eGFRcrea GWAS of 1,508,659 individuals. X-axis is chromosomal location of SNP. Y-axis is strength of association -log10(p value, GWAS meta-analysis) (the scale is capped at 150). Lead SNPs for 878 independent loci are highlighted. Cyan represents loci overlapping or nearby (within 500kb or LD R2 > 0.001) previously reported sentinel variants, and red represents novel loci. Prioritized genes (score at least 3, in purple color) or closest genes (in black color) for the 126 novel loci are shown. b. Scatter plot of minor allele frequency and effect size (absolute) of lead variants from 878 eGFRcrea GWAS loci. Cyan represents loci overlapping or nearby (within 500kb or LD R2 > 0.001) previously reported sentinel variants, and red represents novel loci. c. Human kidney eQTL Manhattan plot (n= 686 kidney samples). X-axis is chromosomal location of SNP. Y-axis is strength of eQTL association -log10(p value eQTL meta-analysis). d. Enrichment of kidney specific eQTL SNPs to GWAS traits. X-axis is odds ratio and Y-axis is strength of enrichment -log10(two-sided chi-square test p). Size of the dot represents the number of SNPs and colors represent the type of GWAS trait.
Fig. 3.
Fig. 3.. Robust identification of human kidney meQTL
a. Samples and analytical workflow for the meQTL analyses. b. Manhattan plot of human kidney meQTL data (n=443). X-axis is chromosomal location. Y-axis strength of association -log10(two-sided p). The two-sided p value was calculated by linear regression meQTL model. Only meQTLs with p < 0.01 are shown in the Manhattan plot. c. The strength of association (-log10(two-sided p), y-axis) of the best mSNPs (the lead meQTL for each mCpG) decreases with the increasing distance (x-axis) from the CpG sites. d. Overlap of meQTL CpGs between kidney, blood, and skeletal muscle. e. Enrichment of tissue-specific meQTL CpGs in tissue enhancers. X-axis tissue enhancer, y-axis tissue meQTLs. The color shows the enrichment odds ratio from low (blue) to high (red), while the p-value (two-sided chi-square test) is listed in the box.
Fig. 4.
Fig. 4.. Methylation variation explains a larger fraction of GWAS heritability than gene expression variation
a. Schematic representation for estimation of heritability mediated by DNA methylation and gene expression using mediated expression score regression (MESC) analysis. b. Estimated proportion of heritability (h2med/h2g) mediated by DNA methylation and gene expression in 414 kidneys across 34 GWAS traits. The y-axis represents h2med/h2g mediated by methylation, while the x-axis h2med/h2g mediated by expression. The color represents the type of the GWAS trait, error bars represent jackknife standard errors estimated for h2med/h2g mediated by methylation and expression, respectively. c. Estimated proportion of heritability (h2med/h2g) by multi-ancestry and European (only) ancestry datasets for kidney function GWAS traits (eGFRcrea, eGFRcys and BUN). The x-axis represents h2med/h2g. For each bar plot, the center of error bar represents the value of h2med/h2g, and error bar represent jackknife standard error. d. Estimated proportion of heritability mediated by meQTLs and eQTLs from kidney and other tissue for eGFRcrea GWAS (n = 421,531 UKBB individuals). The x-axis represents h2med/h2g, while the y-axis represents eQTL or meQTL data obtained from different tissues. meQTL data are shown in red and eQTL in blue. For each bar plot, the center of error bar represents the value of h2med/h2g, and error bar represents jackknife standard error. See estimates of h2med/h2g for other QTLs in Extended Data Fig. 6d. e. Enrichment of kidney methylation-mediated heritability for kidney function GWAS traits (x-axis) in different ChromHMM regulatory elements (y-axis). White to red indicates h2med enrichment (nominal two-sided p < 0.05 calculated by MESC). Asterisk indicates h2med enrichment passing FDR q < 0.05 (accounting for 374 tests for 11 chromatin state CpG sets and 34 GWAS traits, Supplementary Fig. 7). TSS, transcription start site. f. Enrichment of kidney methylation-mediated heritability (x-axis) for eGFRcrea GWAS (n = 421,531 UKBB individuals) in enhancers of different tissues (y-axis). For each bar plot, the center of error bar represents the enrichment score, and error bar represents jackknife standard error. Asterisk indicates h2med enrichment passing FDR q < 0.05 (accounting for 4,352 tests for 128 enhancer CpG sets and 34 GWAS traits, Extended Data Fig. 7a).
Fig. 5.
Fig. 5.. Single cell chromatin accessibility map enables target cell type and gene prioritization for GWAS variants
a. Single cell resolution accessibility maps for 57,229 human kidney cells by snATAC-seq. The x-axis and y-axis represent t-SNE dimension 1 and 2, respectively. Each dot represents a cell and color represents cell type such as PT-S1–3: proximal tubule S1–3 segment, LOH: loop of Henle, DCT: distal convoluted tubule, PC: principal cell of collecting duct, IC: intercalated cell of collecting duct, Endo: endothelial cells, Podo: Podocyte, Immune cell, Lymph cells, and Stroma cell. b. Enrichment of kidney methylation-mediated heritability for kidney function GWAS traits (x-axis) in kidney cell type-specific accessible regions (y-axis). White to red indicates h2med enrichment (nominal p < 0.05 calculated by MESC). Asterisk indicates h2med enrichment passing FDR q < 0.05 (accounting for 408 tests for 12 cell type CpG sets and 34 GWAS traits, Supplementary Fig. 8a). c. Single cell GWAS trait enrichment in human kidney cells by gchromVAR. X-axis shows fine-mapped GWAS traits, and y-axis cell types. The single cell GWAS enrichment z-score mean value of all cells in each cell type is represented by blue (low) to red (high). See estimates for all 63 GWAS traits in Supplementary Fig. 8b. d. Enrichment of eGFRcrea GWAS variants in kidney cell type-specific accessible regions. X-axis is odds ratio, and y-axis is strength of enrichment -log10(p value of two-sided chi-square test). Dot size represents the number of variants overlapping with differentially accessible regions in given cell type. e. GWAS variant target genes prioritized by Cicero co-accessibility. Upper panel is schematic representation of target gene prioritization using Cicero connections. Lower panel indicates 1,024 target genes (x-axis) ordered by number of prioritized variants (y-axis). f. Upper panel. LocusZoom plot of eGFRcrea GWAS associations (n = 1,508,659 individuals) at the UMOD locus. Y-axis is strength of association -log10(p value calculated using z statistic from GWAS meta-analysis). The top variant (rs12917707) tagging the independent signal closest to UMOD was selected as the index variant to calculate LD (r2) with other variants, represented from low (blue) to high (red). Lower panel includes meQTL, eQTL, eGFRcrea GWAS variants, Cicero connections, snATAC-seq chromatin accessibility, histone modifications by ChIP-seq, and chromatin states.
Fig. 6.
Fig. 6.. Integrative analysis of epigenetic and gene expression data improves kidney disease target gene prioritization
a. Number of eGFRcrea GWAS independent loci showing colocalization across eGFRcrea GWAS, meQTL and eQTL. The x-axis showed different combination of colocalization types and the y-axis is number of loci with given colocalization types. b. Venn diagram showing number of mCpGs and eGenes with different colocalization types across eGFRcrea GWAS, meQTL and eQTL. c. Manhattan plot highlighting 330 genes with evidence of multiple traits colocalization. The x-axis is chromosomal location of the SNP. The y-axis is strength of association -log10(p value calculated using z statistic from GWAS meta-analysis) (the scale is capped at 300). The color indicates different type of colocalizations; green: GWAS and methylation; purple: methylation and expression; blue: GWAS and expression; red: GWAS, methylation and expression. d. Number of colocalization mCpGs and eGenes passing SMR and/or HEIDI tests in Mendelian randomization analysis across eGFRcrea GWAS, meQTL and eQTL. e. Number of eGFRcrea GWAS independent loci prioritized based on different priority scores. The y-axis is number of independent loci including at least one prioritized gene with equal or higher priority score (number of supporting evidence) given on the x-axis. The list shows genes with priority score of 8. f. Number of genes prioritized for eGFRcrea GWAS loci by priority score ≥ 3. g. Fraction of variants targeting closest gene or distal gene (priority score ≥ 3). For each variant, its target gene is defined as the closest gene if the target gene’s transcript start site is the closest one to the variant. h. Mouse kidney cell type expression enrichment of prioritized genes (priority score ≥ 3). The x-axis represented the odds ratio and the y-axis represented enrichment significance (-log10 of hypergeometric test p) for the prioritized genes and cell type-specific gene overlap.
Fig. 7.
Fig. 7.. Identification of SLC47A1 as a kidney disease risk gene
a. LocusZoom plots of GWAS (genotype and eGFRcrea association, n = 1,508,659), kidney CpG cg15971010 meQTL (genotype and cg15971010 methylation association, n = 443) and kidney SLC47A1 eQTLs (genotype and SLC47A1 expression association, n = 686). The y axis shows -log10(p) of association tests from GWAS, meQTL and eQTL. Highlighted variants are rs2252281 with top priority score and rs111653425 (a rare coding variant with MAF 1.1%) with top GWAS association. b. Genotype (rs2252281, x-axis) and normalized CpG methylation (cg15971010, y-axis) association in human kidneys (n=443). Each dot represents a sample. Center lines show the medians; box limits indicate the 25th and 75th percentiles; whiskers extend to the 5th and 95th percentiles. p value was calculated by linear regression meQTL model. c. Genotype (rs2252281 x-axis) and normalized gene expression (SLC47A1, y-axis) association in human kidney tubule samples (n=356). Each dot represents a sample. Center lines show the medians; box limits indicate the 25th and 75th percentiles; whiskers extend to the 5th and 95th percentiles. p value was calculated by eQTL meta-analysis in 686 samples. d. Manhattan plot of phenome-wide association study of predicted loss-of-function (pLOF) variants in SLC47A1 in UKBB. The x-axis represents phenotypes ordered by p-value within each disease group and the y-axis the strength of association -log10(p) value calculated by linear regression PheWAS model. Blue line is p = 0.05 and red line is Bonferroni adjusted p = 0.05.
Fig. 8.
Fig. 8.. Slc47a1 loss confers kidney disease risk in mice
a. Experimental scheme of the cisplatin-induced kidney injury model in wild type (Slc47a1+/+) and Slc47a1 knockout (Slc47a1−/−) mice. b. The relative expression of Slc47a1 (y-axis) in kidneys of Slc47a1+/+and Slc47a1−/− mice treated with cisplatin (Cis) or sham (CTR). c. Serum creatinine levels (y-axis) in control or cisplatin treated Slc47a1+/+and Slc47a1−/− mice. d. Serum BUN levels (y-axis) in control or cisplatin treated Slc47a1+/+and Slc47a1−/− mice. e. Representative image (left panel) and quantification (right panel) of Hematoxylin and eosin (H&E) stained kidney sections of control or cisplatin treated Slc47a1+/+and Slc47a1−/− mice. Scale bars: 20μm. f. The relative expression of injury markers Lipocalin 2 (Ngal) and kidney injury molecule 1 (Kim1) (y-axis) in kidneys of control or cisplatin treated Slc47a1+/+and Slc47a1−/− mice. g. Representative image (left panel) and quantification (right panel) of Sirius red stained kidney sections of control or cisplatin treated Slc47a1+/+and Slc47a1−/− mice. Scale bar: 20μm. h. The relative expression of fibrosis markers; Collagen 1 (Col1a1) and Vimentin (Vim) in kidneys of control or cisplatin treated Slc47a1+/+and Slc47a1−/− mice. i. Representative western blot image (top panel) and quantification (bottom panel) of Receptor interacting serine/threonine kinase 3 (RIPK3), NLR family pyrin domain containing 3 (NLRP3), Actin alpha 2 (aSMA) in kidney of control or cisplatin treated Slc47a1+/+and Slc47a1−/− mice. GAPDH was used as a control. j. Relative expression of markers of inflammation; Chemokine ligand 2 (Ccl2) and Tumor necrosis factor (Tnfa) in kidneys of control or cisplatin treated Slc47a1+/+and Slc47a1−/− mice. k. Relative expression of cell death and inflammation marker genes; Receptor interacting serine/threonine kinase 1 (Ripk1), Ripk3 and Mixed lineage kinase domain like pseudokinase (Mlkl) in kidney from Slc47a1+/+and Slc47a1−/− mice treated with or without repeated cisplatin. P values were calculated by one-way ANOVA with post hoc Tukey test (b-k, n=4 biologically independent Slc47a1+/+ cisplatin mice examined over n=3 independent Slc47a1+/+ control; n=5 biologically independent Slc47a1−/− cisplatin mice examined over n=4 independent Slc47a1+/+ cisplatin mice). n.s., not significant. Quantitative data are presented as mean ± SD.

Comment in

References

    1. Collaboration GBDCKD Global, regional, and national burden of chronic kidney disease, 1990–2017: a systematic analysis for the Global Burden of Disease Study 2017. Lancet 395, 709–733 (2020). - PMC - PubMed
    1. Kottgen A et al. Multiple loci associated with indices of renal function and chronic kidney disease. Nat Genet 41, 712–7 (2009). - PMC - PubMed
    1. Pattaro C et al. Genetic associations at 53 loci highlight cell types and biological pathways relevant for kidney function. Nat Commun 7, 10023 (2016). - PMC - PubMed
    1. Wuttke M et al. A catalog of genetic loci associated with kidney function from analyses of a million individuals. Nat Genet 51, 957–972 (2019). - PMC - PubMed
    1. Hellwege JN et al. Mapping eGFR loci to the renal transcriptome and phenome in the VA Million Veteran Program. Nat Commun 10, 3842 (2019). - PMC - PubMed

Methods-only references

    1. Purcell S et al. PLINK: a tool set for whole-genome association and population-based linkage analyses. Am J Hum Genet 81, 559–75 (2007). - PMC - PubMed
    1. Delaneau O, Zagury J-F & Marchini J Improved whole-chromosome phasing for disease and population genetic studies. Nature methods 10, 5 (2013). - PubMed
    1. Howie BN, Donnelly P & Marchini J A flexible and accurate genotype imputation method for the next generation of genome-wide association studies. PLoS genetics 5, e1000529 (2009). - PMC - PubMed
    1. Howie B, Marchini J & Stephens M Genotype imputation with thousands of genomes. G3 (Bethesda) 1, 457–70 (2011). - PMC - PubMed
    1. Zhou W, Triche TJ Jr., Laird PW & Shen H SeSAMe: reducing artifactual detection of DNA methylation by Infinium BeadChips in genomic deletions. Nucleic Acids Res 46, e123 (2018). - PMC - PubMed

Publication types