. 2022 Aug;28(8):1715-1722.
doi: 10.1038/s41591-022-01877-1. Epub 2022 Jun 16.

Rapid evaluation of COVID-19 vaccine effectiveness against symptomatic infection with SARS-CoV-2 variants by analysis of genetic distance

Affiliations

Rapid evaluation of COVID-19 vaccine effectiveness against symptomatic infection with SARS-CoV-2 variants by analysis of genetic distance

Lirong Cao et al. Nat Med. 2022 Aug.

Abstract

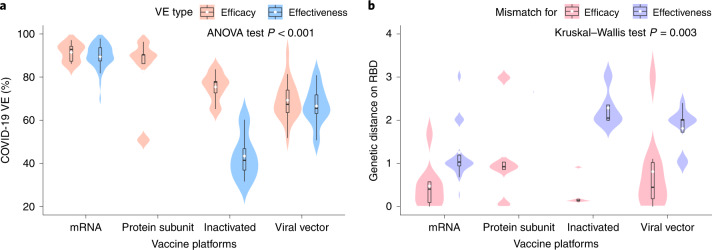
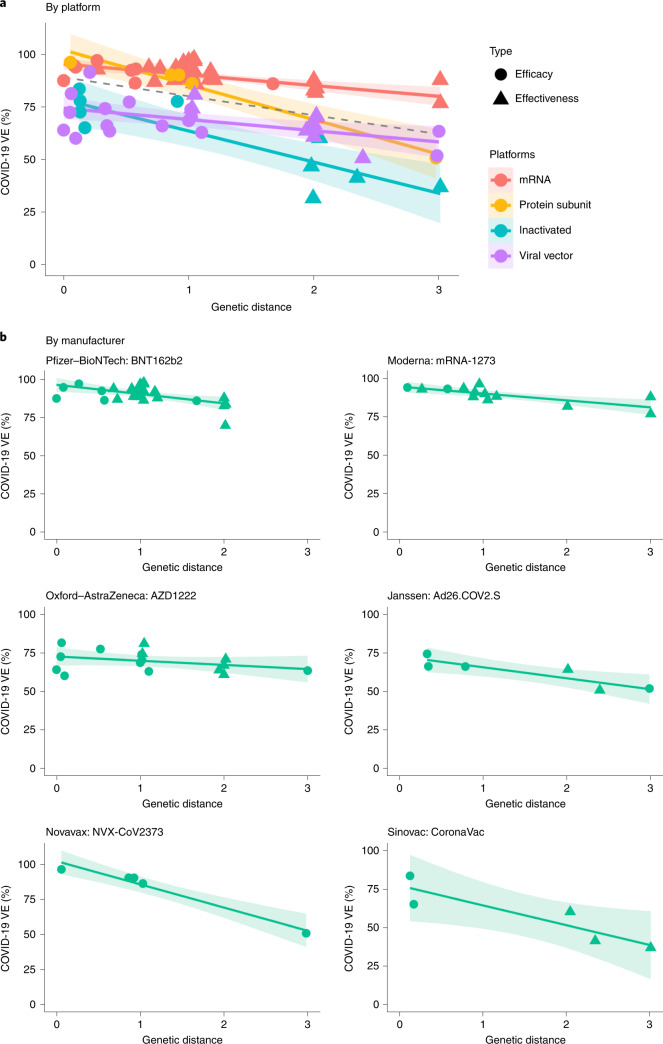
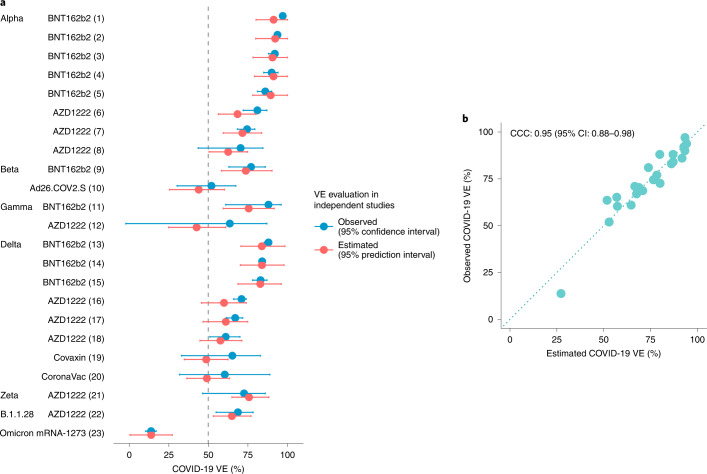
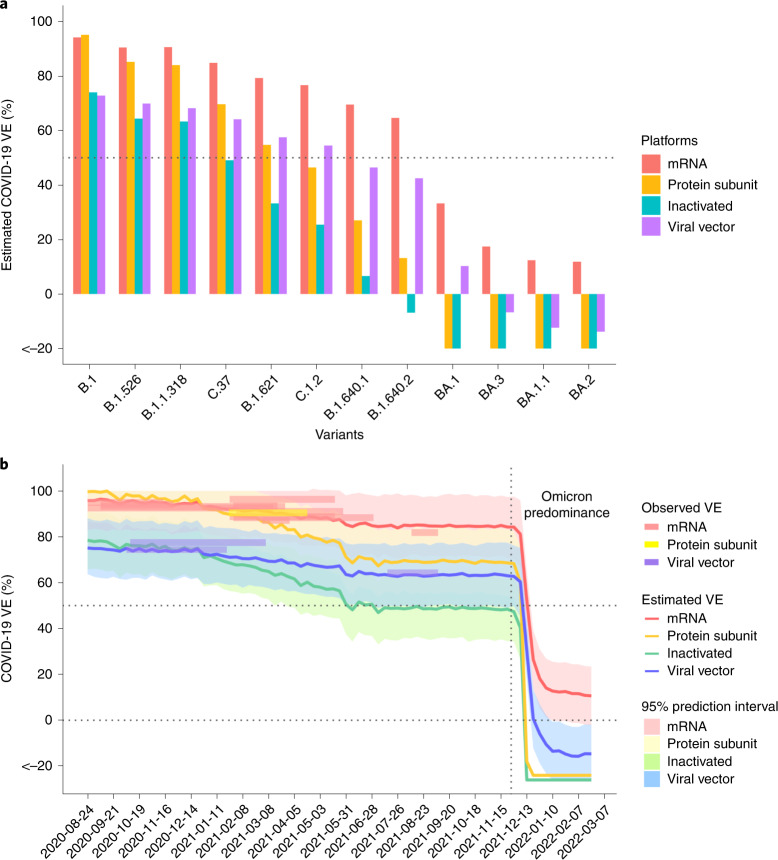
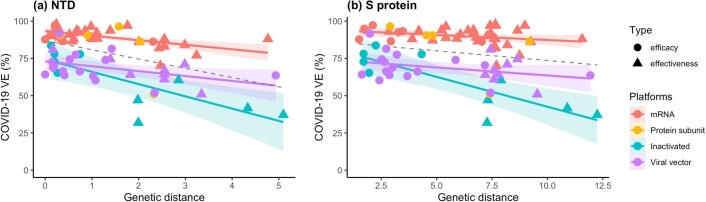
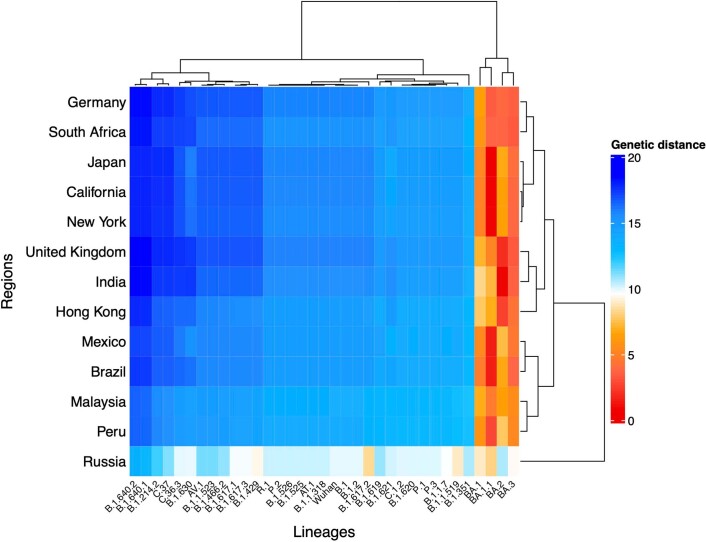
Timely evaluation of the protective effects of Coronavirus Disease 2019 (COVID-19) vaccines against severe acute respiratory syndrome coronavirus 2 (SARS-CoV-2) variants of concern is urgently needed to inform pandemic control planning. Based on 78 vaccine efficacy or effectiveness (VE) data from 49 studies and 1,984,241 SARS-CoV-2 sequences collected from 31 regions, we analyzed the relationship between genetic distance (GD) of circulating viruses against the vaccine strain and VE against symptomatic infection. We found that the GD of the receptor-binding domain of the SARS-CoV-2 spike protein is highly predictive of vaccine protection and accounted for 86.3% (P = 0.038) of the VE change in a vaccine platform-based mixed-effects model and 87.9% (P = 0.006) in a manufacturer-based model. We applied the VE-GD model to predict protection mediated by existing vaccines against new genetic variants and validated the results by published real-world and clinical trial data, finding high concordance of predicted VE with observed VE. We estimated the VE against the Delta variant to be 82.8% (95% prediction interval: 68.7-96.0) using the mRNA vaccine platform, closely matching the reported VE of 83.0% from an observational study. Among the four sublineages of Omicron, the predicted VE varied between 11.9% and 33.3%, with the highest VE predicted against BA.1 and the lowest against BA.2, using the mRNA vaccine platform. The VE-GD framework enables predictions of vaccine protection in real time and offers a rapid evaluation method against novel variants that may inform vaccine deployment and public health responses.


Conflict of interest statement

M.H.W. and B.C.Y.Z. are shareholders of Beth Bioinformatics Co., Ltd. B.C.Y.Z. is a shareholder of Health View Bioanalytics Ltd. S.Y.C. and J.L. are employees of Beth Bioinformatics Co., Ltd. All other authors declare no competing interests.

Figures

Fig. 1
Fig. 1. Comparison of COVID-19 VE and genetic mismatch across vaccine platforms.
a, Distribution of the VE estimates for different platforms. The VE of mRNA and protein subunit vaccines are higher than other vaccines (two-sided ANOVA test P = 2.2 × 10−14, n = 78). b, Distribution of genetic mismatch on RBD for different vaccine technologies. Genetic mismatch is the lowest for mRNA vaccines (two-sided Kruskal–Walls test P = 0.003, n = 78). In the box plots, the middle bar indicates the median; the white dot indicates the mean; and the boundaries are Q1 and Q3. Whiskers of the box plot are extended to Q3 + 1.5× interquartile range (IQR) and Q1 − 1.5× IQR.
Fig. 2
Fig. 2. The relationship between VE and GD of the circulating SARS-CoV-2 strains to the vaccine strain on RBD.
a, Negative linear relationships between VE and GD for different vaccine platforms (P = 0.038, R2 = 86.3%). The dashed line was fitted by all data points. b, Negative linear relationship between VE and GD for each vaccine product (P = 0.006, R2 = 87.9%). The two-sided P value was obtained from the mixed-effects model. The colored lines were fitted by data points of each platform. The shaded area indicates 95% CI.
Fig. 3
Fig. 3. Prediction of VE based on GD.
The VE-GD model was trained using all non-variant-specific VEs, and estimations were made on all (n = 23) variant-specific VEs. a, Estimated and observed VE for variants by vaccine product. Source of the VE data is indexed behind vaccine product names, available in Supplementary Table 5. b, Calibration plot for the prediction outcome in validation data. The predicted VEs are close to the observed VEs with a CCC of 0.95 (95% CI: 0.88–0.98).
Fig. 4
Fig. 4. Prediction for SARS-CoV-2 genetic variants with unknown VEs including the Omicron sublineages and in serial cross-sectional sequencing data.
a, Predicted VEs for specific variants/sublineages without observed VEs. Omicron sublineages: BA.1, BA.1.1, BA.2 and BA.3. b, VEs in California were estimated at weekly intervals for different vaccine platforms. The surveyed VEs from clinical trials or observational studies during the same period are overlaid on the trend curve as colored rectangles for reference. The declining trend of estimated VE captures the influence of virus evolution on population-level immune protection. During the Omicron predominance period, a cliff-like drop of VE is depicted. The shaded areas are 95% prediction interval. The vertical dashed line marks the date of 26 November 2021, which is the earliest time of the Omicron appearance in these data. The top horizontal dashed line marks the 50% efficacy threshold.
Fig. 5
Fig. 5. Clustering of regions by GD between circulating strains and candidate vaccine strains during January and February 2022.
The candidate strain that gives a lowest genetic mismatch for geographical regions is highlighted in the green box. Rows: target geographical regions; columns: candidate vaccine strain (B.1.617.2: Delta; BA.1–BA.3: Omicron sublineages). The figure shows that the Omicron sublineages can match to the epidemic viruses in most regions, but the dominant sublineages are not the same.
Extended Data Fig. 1
Extended Data Fig. 1. Distribution of genetic mismatch on the NTD and complete S protein.
The genetic mismatch on the NTD and S protein was measured. The results show that the genetic mismatch is lowest for mRNA vaccines (Kruskal-Wallis test: two-sided P of NTD = 0.006, two-sided P of S protein = 0.065; n = 78). In the box plots, the middle bar indicates the median, the white dot indicates the mean, and the boundaries are Q1 and Q3. Whiskers of the box plot are extended to Q3 + 1.5×IQR and Q1 − 1.5×IQR.
Extended Data Fig. 2
Extended Data Fig. 2. Scatterplot of the observed VE and genetic distance on the non-S proteins of SARS-CoV-2.
The same analysis under the null hypothesis to explore the association of VE with genetic distance was performed on the structural proteins containing envelope (E), membrane (M) and nucleocapsid (N); ORF1ab; accessory proteins containing ORF3a, ORF6, ORF7a, ORF7b, ORF8 and ORF10 proteins. No significant relationship with VE was observed.
Extended Data Fig. 3
Extended Data Fig. 3. Scatterplot of the observed VE and genetic distance on the non-structural proteins (NSPs).
The ORF1ab polyprotein is composed of 16 non-structural proteins (NSPs). The genetic distance of each NSP was also calculated and no relationship with VE was observed.
Extended Data Fig. 4
Extended Data Fig. 4. The relationship between VE and genetic distance on the NTD and S protein.
Panels (a-b): negative linear relationships between VE and genetic mismatch for NTD (P = 0.086, R2 = 75.8%), and full-length sequence (P = 0.082, R2= 78.4%), respectively. The two-sided P was obtained from the mixed-effects model. The colored lines were fitted by data points of each platform. The shaded area indicates 95% CI.
Extended Data Fig. 5
Extended Data Fig. 5. Clustering of regions by circulating strains similarities to SARS-CoV-2 genetic variants.
Genetic mismatch of genetic variants to the local circulating virus during January and February 2022. The best candidate vaccine antigen for a geographical region measured by genetic distance is shown by dark red. Rows: target geographical regions; columns: candidate vaccine strains. The figure shows that the Omicron sublineages can match to the epidemic viruses in most regions, but the dominant sublineages are not the same.

References

    1. Basta, N. E. & Moodie, E. M. M., on behalf of the VIPER (Vaccines, Infectious disease Prevention, and Epidemiology Research) Group COVID-19 Vaccine Development and Approvals Tracker Team. COVID-19 Vaccine Tracker. https://covid19.trackvaccines.org/
    1. Polack FP, et al. Safety and efficacy of the BNT162b2 mRNA Covid-19 vaccine. N. Engl. J. Med. 2020;383:2603–2615. doi: 10.1056/NEJMoa2034577. - DOI - PMC - PubMed
    1. Andrews, N. et al. Covid-19 vaccine effectiveness against the Omicron (B.1.1.529) variant. N. Engl. J. Med. 386, 1532–1546 (2022). - PMC - PubMed
    1. Dai L, Gao GF. Viral targets for vaccines against COVID-19. Nat. Rev. Immunol. 2021;21:73–82. doi: 10.1038/s41577-020-00480-0. - DOI - PMC - PubMed
    1. Jackson LA, et al. An mRNA vaccine against SARS-CoV-2—preliminary report. N. Engl. J. Med. 2020;383:1920–1931. doi: 10.1056/NEJMoa2022483. - DOI - PMC - PubMed

Publication types

Supplementary concepts