. 2022 Jul;28(7):1412-1420.
doi: 10.1038/s41591-022-01869-1. Epub 2022 Jun 16.

Genome-wide polygenic score to predict chronic kidney disease across ancestries

Affiliations

Genome-wide polygenic score to predict chronic kidney disease across ancestries

Atlas Khan et al. Nat Med. 2022 Jul.

Abstract

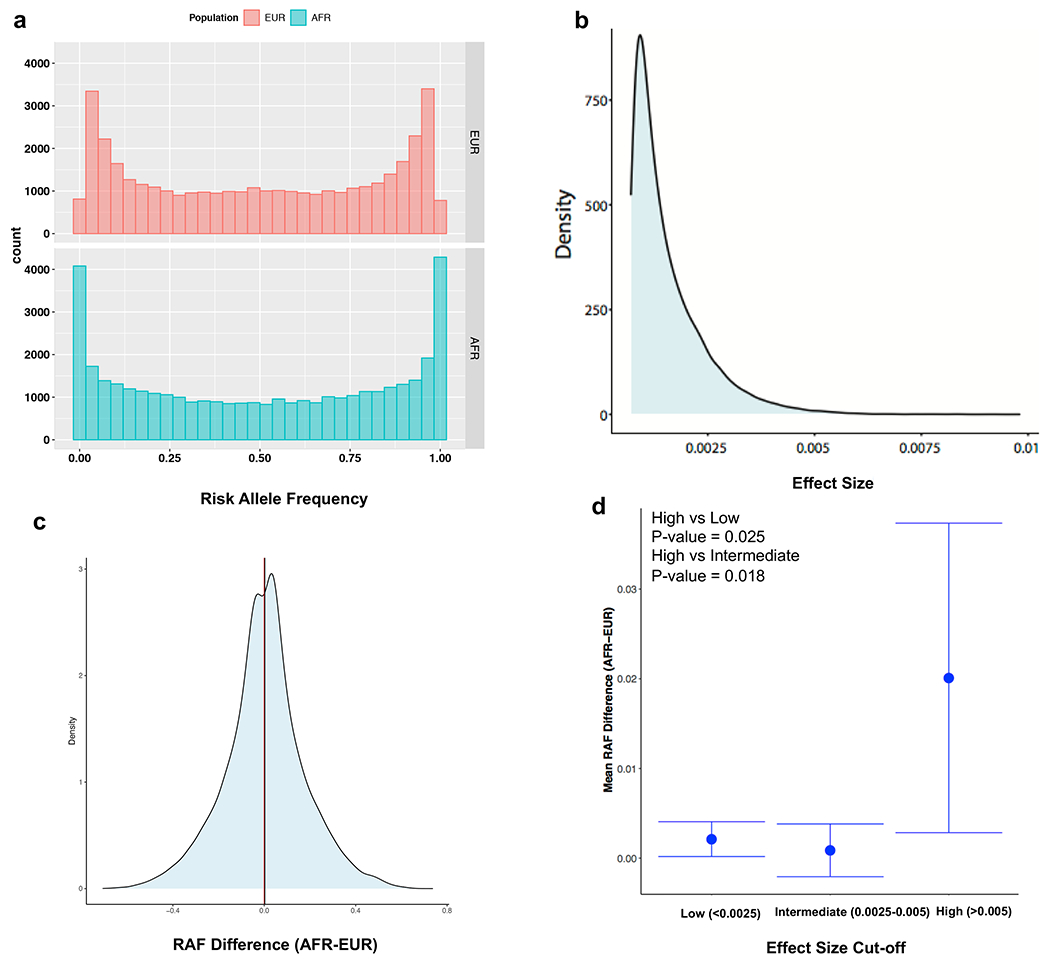
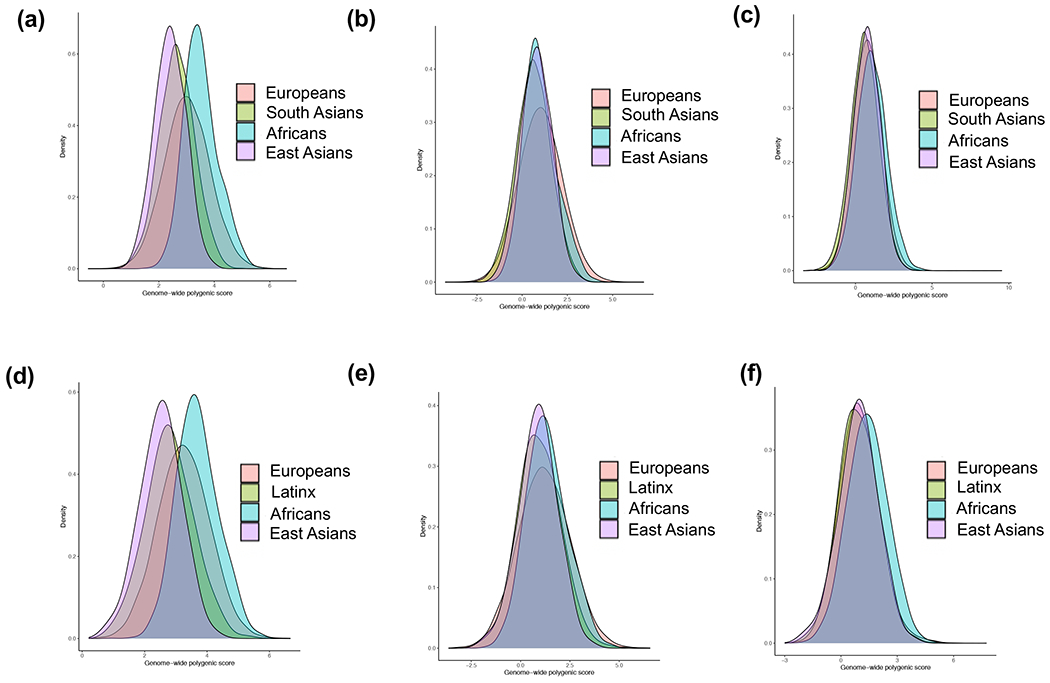
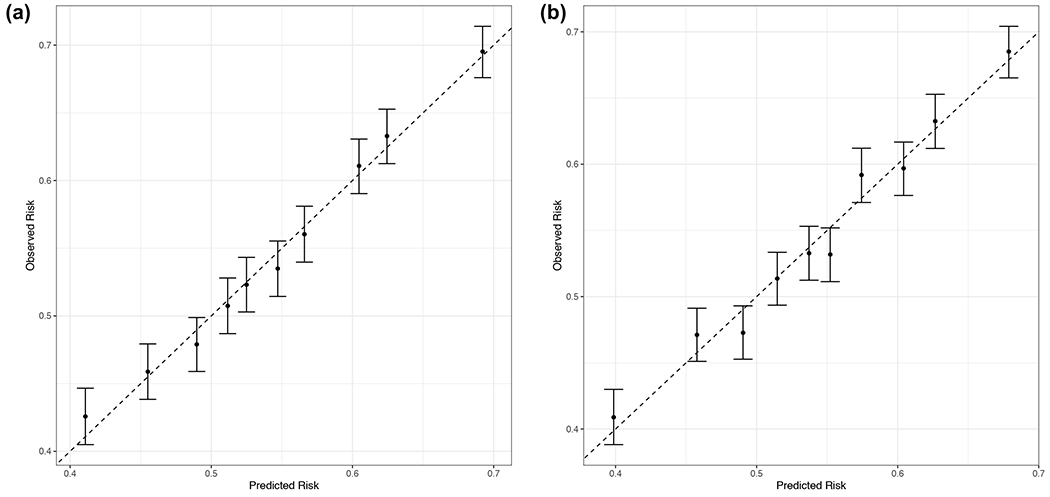
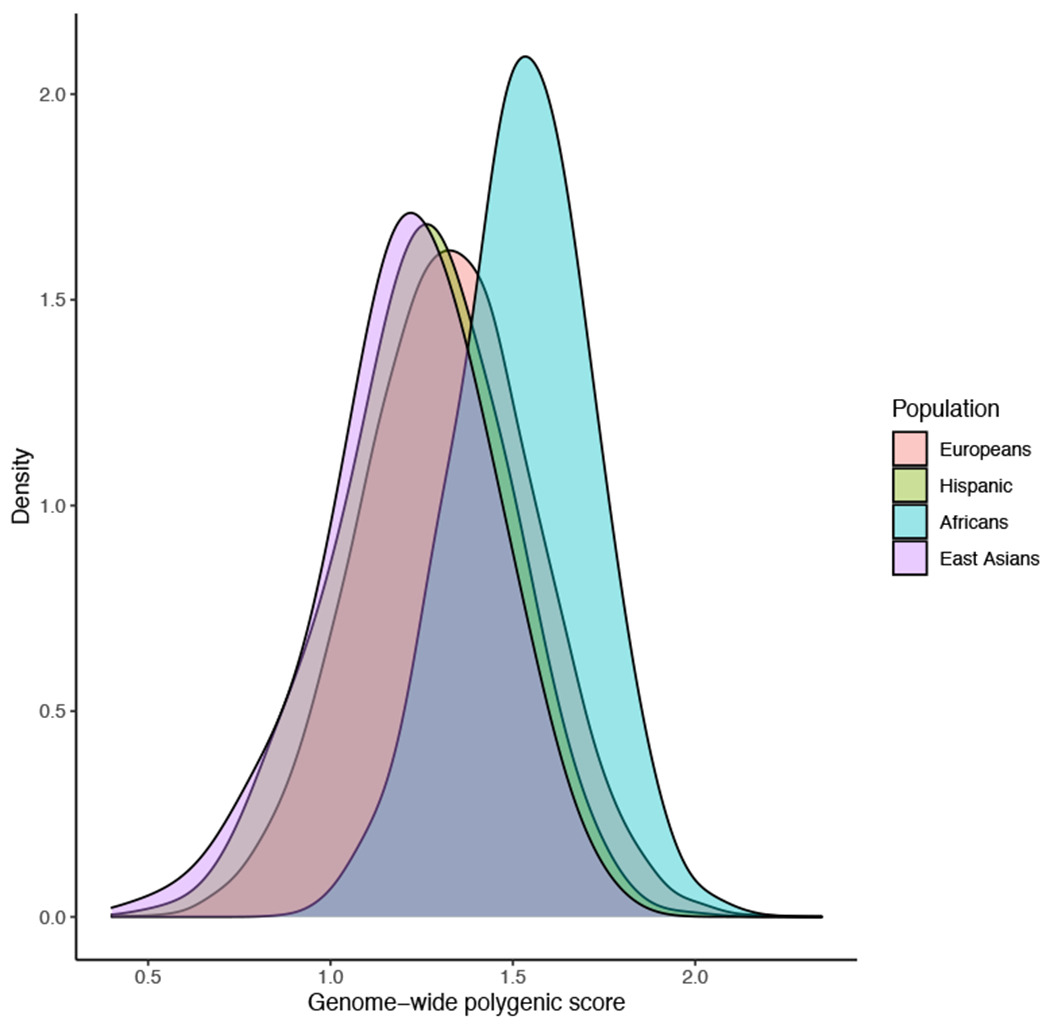
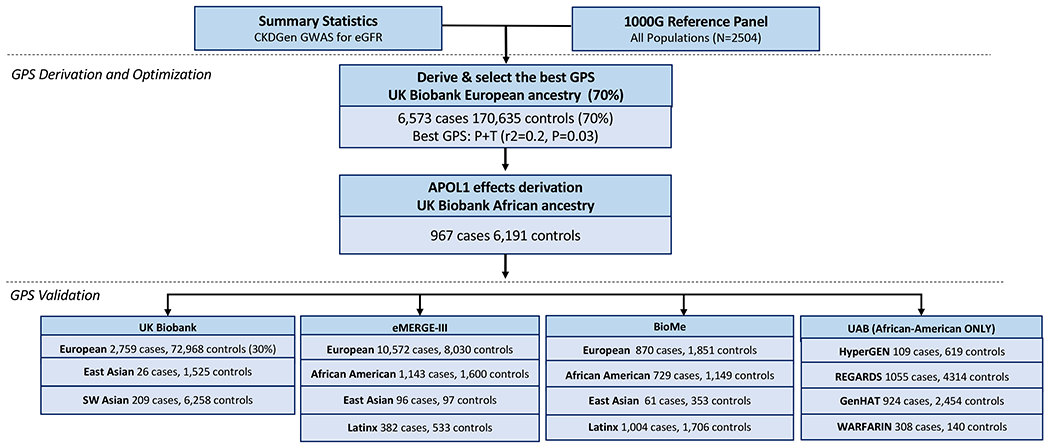
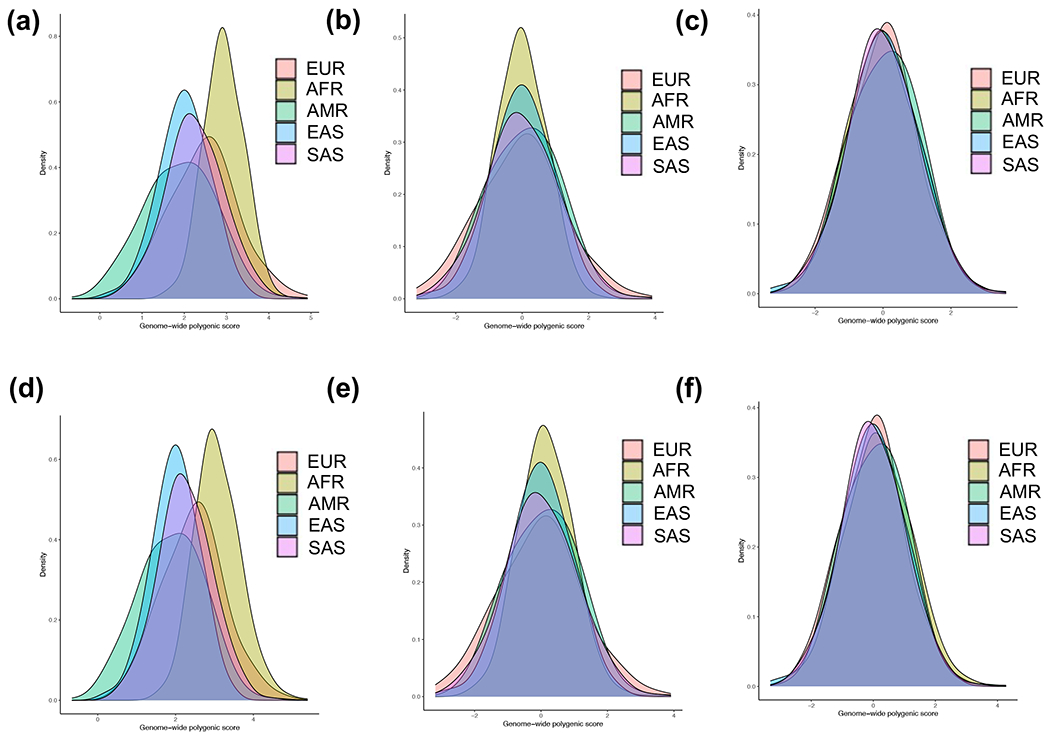
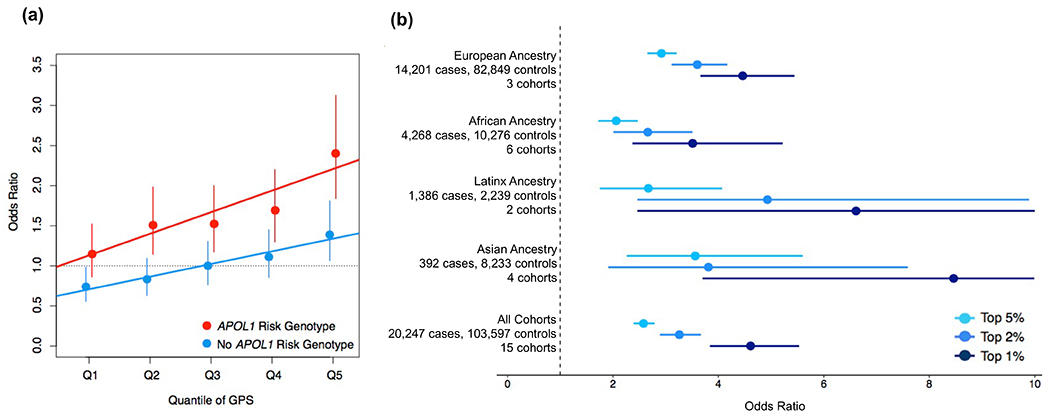
Chronic kidney disease (CKD) is a common complex condition associated with high morbidity and mortality. Polygenic prediction could enhance CKD screening and prevention; however, this approach has not been optimized for ancestrally diverse populations. By combining APOL1 risk genotypes with genome-wide association studies (GWAS) of kidney function, we designed, optimized and validated a genome-wide polygenic score (GPS) for CKD. The new GPS was tested in 15 independent cohorts, including 3 cohorts of European ancestry (n = 97,050), 6 cohorts of African ancestry (n = 14,544), 4 cohorts of Asian ancestry (n = 8,625) and 2 admixed Latinx cohorts (n = 3,625). We demonstrated score transferability with reproducible performance across all tested cohorts. The top 2% of the GPS was associated with nearly threefold increased risk of CKD across ancestries. In African ancestry cohorts, the APOL1 risk genotype and polygenic component of the GPS had additive effects on the risk of CKD.


Conflict of interest statement

Competing Interests Statement

The authors declare no existing competing interest.

Figures

Extended Data Fig. 1
Extended Data Fig. 1. Distribution of risk allele frequencies (RAF) and their effect sizes for the variants included in the GPS.
(a) comparison of RAF distributions for the risk variants included in the CKD GPS demonstrates higher frequency of rare (RAF<0.01) and common (RAF>0.99) risk alleles in African compared to European genomes (based on 1000G reference populations); this may be explained by the exclusion of variants with MAF<0.01 in European discovery GWAS; (b) highly skewed effect size (weight) distribution for the variants included in the GPS for CKD; (c) Distribution of RAF difference (AFR-EUR) demonstrating higher average frequency of risk alleles in African genomes (mean RAF difference = 0.002) and a slight rightward shift of the RAF difference distribution from the expected mean of 0; (d) Mean RAF difference (AFR-EUR) as a function of effect size binned into three categories (high, intermediate, and low) based on the observed distribution of effects sizes in panel b, demonstrating that the risk alleles with larger effect size have higher average frequency in African compared to European genomes. EUR: European (N=503) and AFR: African (N=661). The bars represent 95% confidence intervals around the mean RAF difference estimate for each bin; two-sided P-values were calculated using t-test.
Extended Data Fig. 2
Extended Data Fig. 2. Risk score distributions in eMERGE-III (N=22,453) and UKBB (N=77,584) validation datasets.
(a) the distribution of raw polygenic score without APOL1 in UKBB by ancestry; (b) the distribution of ancestry-adjusted polygenic score (method 1: mean-adjusted) in UKBB by ancestry; (c) the distribution of ancestry-adjusted polygenic score (method 2: mean and variance-adjusted) in UKBB by ancestry. Panels (d), (e) and (f) show the same analyses for the eMERGE-III dataset, respectively.
Extended Data Fig. 3
Extended Data Fig. 3. Final GPS calibration analysis in eMERGE-III cohorts combined (N=22,453).
predicted risk (X-axis) as a function of the observed risk (Y-axis) in the multiethnic eMERGE-III dataset after ancestry adjustment with (a) method 1 and (b) method 2. The bars represent 95% confidence intervals.
Extended Data Fig. 4
Distributions of the raw (non-standardized) genome-wide polygenic score (GPS) by Yu et al. in the eMERGE-III validation datasets by ancestry.
Extended Data Fig. 5
Extended Data Fig. 5. PCA projections of the study participants from the UKBB (top) and eMERGE-III (bottom) against the 1000G reference populations.
(a) UKBB (N=77,584) and (b) eMERGE-III (N=22,453) participants plotted against the reference 1000G populations (N=2,504); (b, e) plotted by self-reported race/ethnicity; and (c, f) plotted by final ancestry group assignment. X-axis: PC1; Y-axis: PC2; AFR: African; AMR: Native American; EAS: East Asian; EUR: European; and SAS: South Asian.
Figure 1:
Figure 1:. Overview of the study design.
The CKD GPS was designed based on CKDGen GWAS summary statistics for eGFR and a cosmopolitan LD reference panel of 1000 Genomes (all populations); optimization was performed in two stages using UKBB participants of European (optimization 1) and African (optimization 2) ancestries; GPS performance validation was conducted in 15 additional independent testing cohorts of diverse ancestries.
Figure 2:
Figure 2:. Risk score distributions in five 1000 Genomes populations:
(a) raw polygenic score without APOL1; (b) ancestry-adjusted polygenic score without APOL1 (method 1: mean only); (c) ancestry-adjusted polygenic score without APOL1 (method 2: mean and variance); (d) raw combined GPS with APOL1; (e) ancestry-adjusted combined GPS with APOL1 (method 1) and (f) ancestry-adjusted combined GPS with APOL1 (method 2). AFR: African, AMR: Native American, EAS: East Asian, EUR: European, and SAS: South Asian.
Figure 3.
Figure 3.. Effects of the genome-wide polygenic score (GPS) for chronic kidney disease (CKD):
(a) GPS quantile effects stratified by the APOL1 risk genotype (a total N=2,020 with and N=12,526 without the APOL1 risk genotype, in red and blue, respectively). The X-axis depicts each quantile of the GPS ordered from the first (Q1) to the last (Q5) quantile. The Y-axis depicts odds ratios of CKD for each of the quantile-defined sub-groups in reference to the middle quantile (Q3) of those without the APOL1 risk genotype. The effect estimates (dots) and 95% confidence intervals (vertical bars) were derived based on a fixed-effects meta-analysis across all 6 African ancestry testing cohorts and adjusted for age, sex, diabetes, and principal components of ancestry. Regression lines were fitted for each group defined by the presence of APOL1 risk genotype. (b) GPS tail effects by ancestry. The X-axis depicts odds ratio of CKD, the Y-axis depicts testing cohort meta-analysis by ancestry (with numbers of cases, controls, and cohorts). The effect estimates (dots) and 95% confidence intervals (vertical bars) are provided for the top 5% versus bottom 95% (sky blue), top 2% versus bottom 98% (cobalt blue), and top 1% versus bottom 99% (navy blue). All effect estimates are adjusted for age, sex, diabetes, and principal components of ancestry.

Comment in

References

    1. Coresh J, et al. Prevalence of chronic kidney disease in the United States. Jama-J Am Med Assoc 298, 2038–2047 (2007). - PubMed
    1. Collaborators GBDC o.D. Global, regional, and national age-sex specific mortality for 264 causes of death, 1980-2016: a systematic analysis for the Global Burden of Disease Study 2016. Lancet 390, 1151–1210 (2017). - PMC - PubMed
    1. Chronic Kidney Disease in the United States, (n.d.). https://www.cdc.gov/kidneydisease/publications-resources/ckd-national-fa... (accessed February 21, 2022).
    1. Shang N, et al. Medical records-based chronic kidney disease phenotype for clinical care and “big data” observational and genetic studies. Npj Digit Med 4(2021). - PMC - PubMed
    1. Fox CS, et al. Genomewide linkage analysis to serum creatinine, GFR, and creatinine clearance in a community-based population: the Framingham Heart Study. J Am Soc Nephrol 15, 2457–2461 (2004). - PubMed

Methods References:

    1. Khan A, et al. Medical Records-Based Genetic Studies of the Complement System. J Am Soc Nephrol (2021). - PMC - PubMed
    1. McCarthy S, et al. A reference panel of 64,976 haplotypes for genotype imputation. Nat Genet 48, 1279–1283 (2016). - PMC - PubMed
    1. Abraham G & Inouye M Fast principal component analysis of large-scale genome-wide data. PLoS One 9, e93766 (2014). - PMC - PubMed
    1. Das S, et al. Next-generation genotype imputation service and methods. Nat Genet 48, 1284–1287 (2016). - PMC - PubMed
    1. Nadkarni GN, et al. Worldwide Frequencies of APOL1 Renal Risk Variants. N Engl J Med 379, 2571–2572 (2018). - PMC - PubMed

Publication types

MeSH terms