. 2022 Aug;6(8):1191-1204.
doi: 10.1038/s41559-022-01784-1. Epub 2022 Jun 16.

A single-cell transcriptomic atlas tracking the neural basis of division of labour in an ant superorganism

Affiliations

A single-cell transcriptomic atlas tracking the neural basis of division of labour in an ant superorganism

Qiye Li et al. Nat Ecol Evol. 2022 Aug.

Abstract

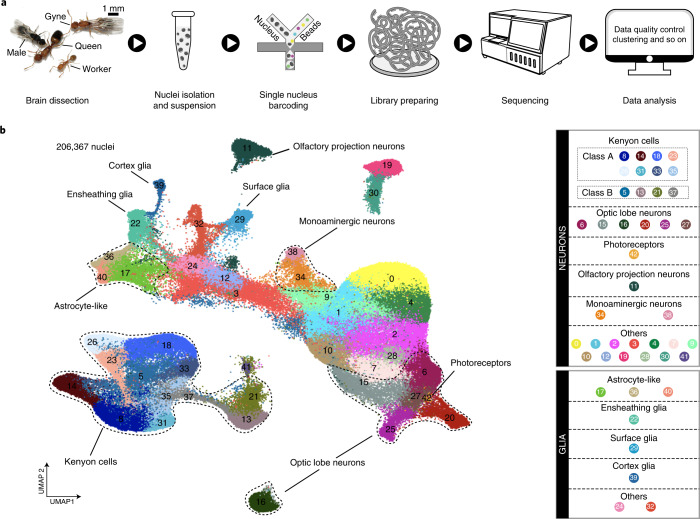
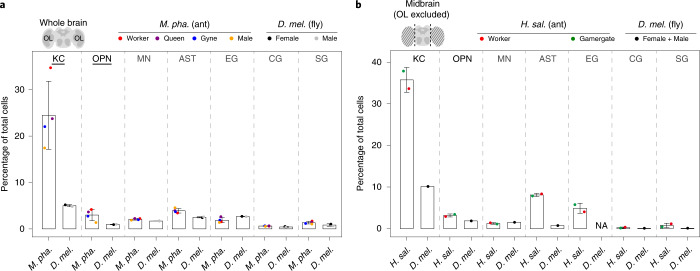
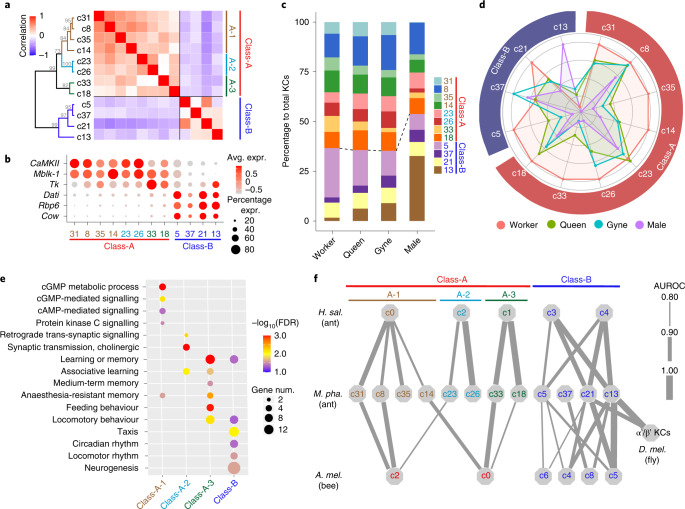
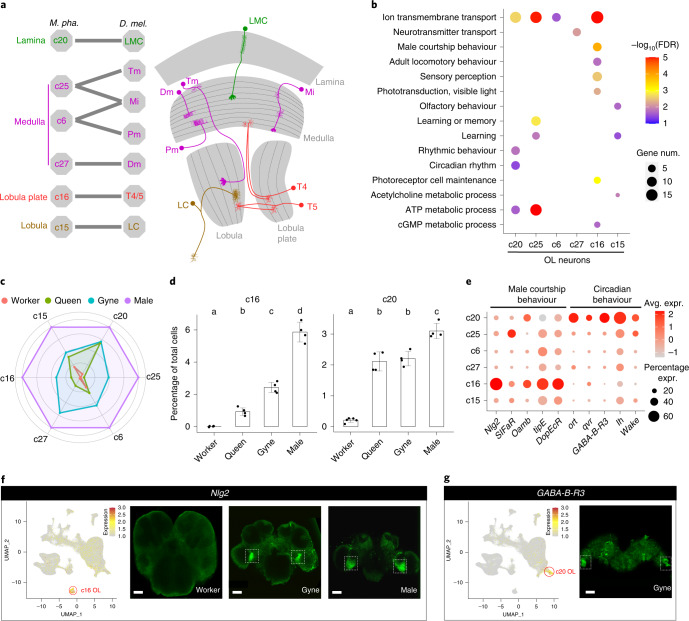
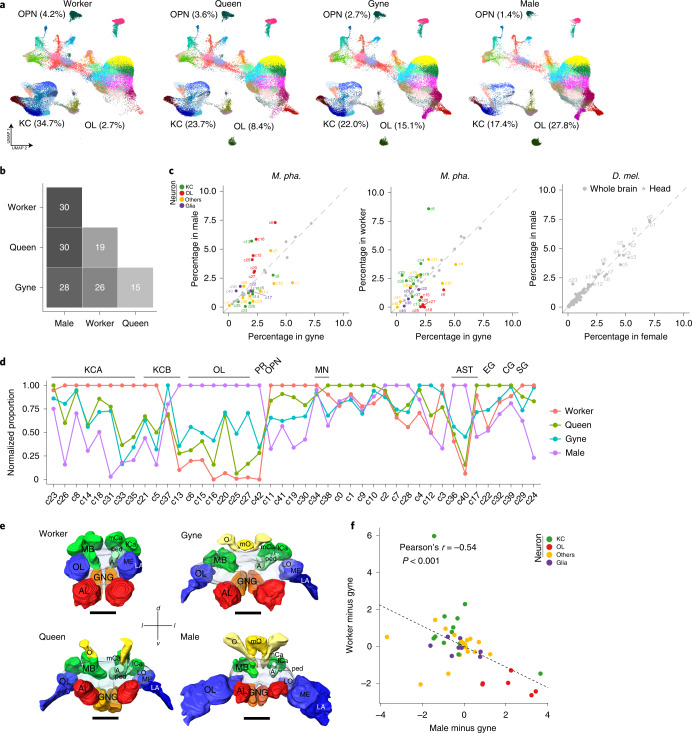
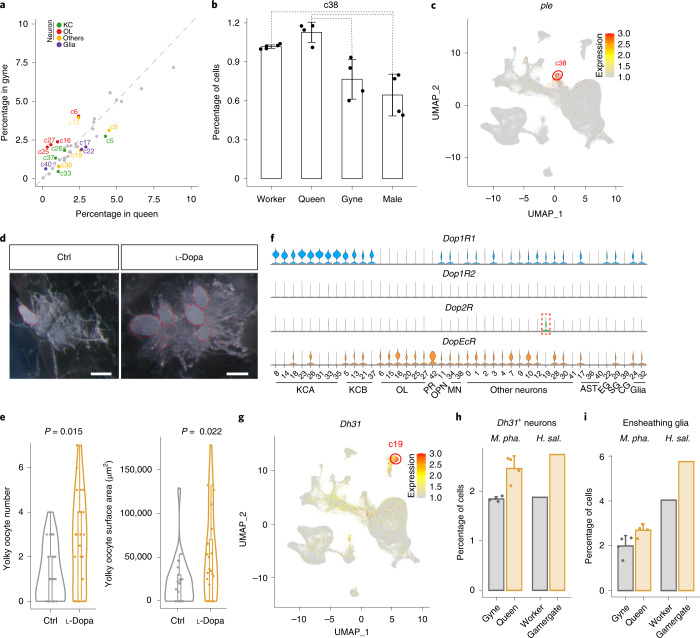
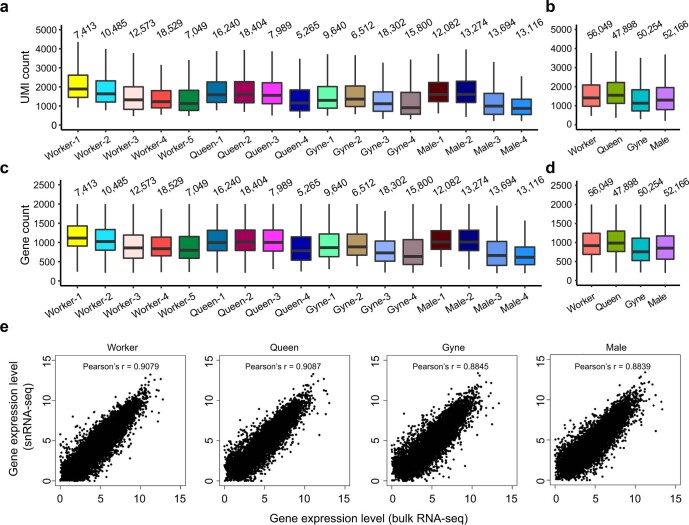
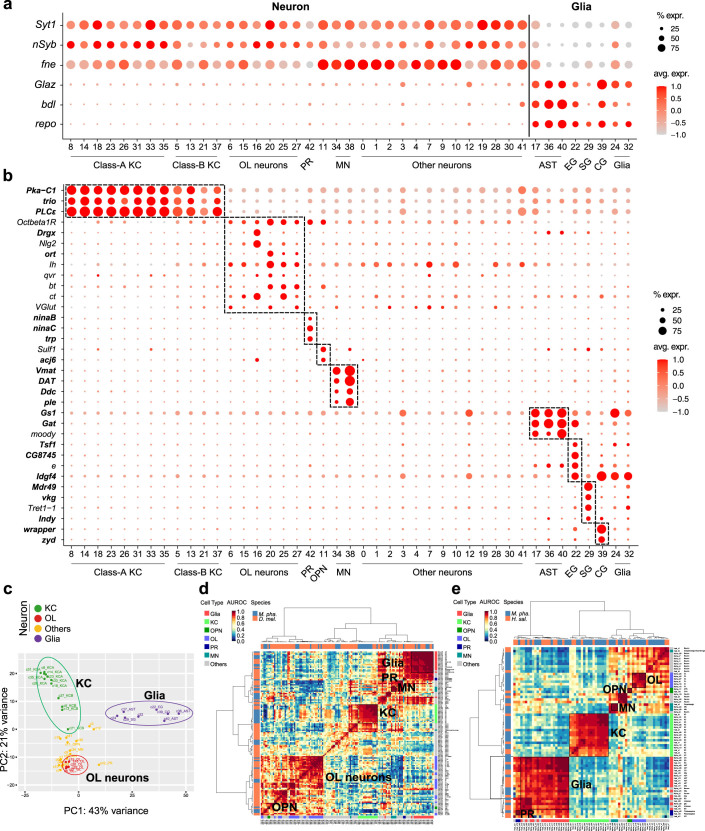
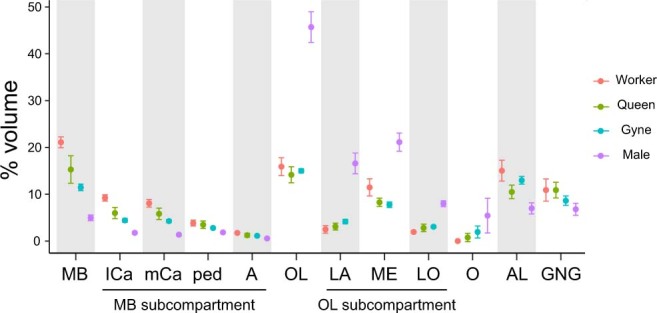
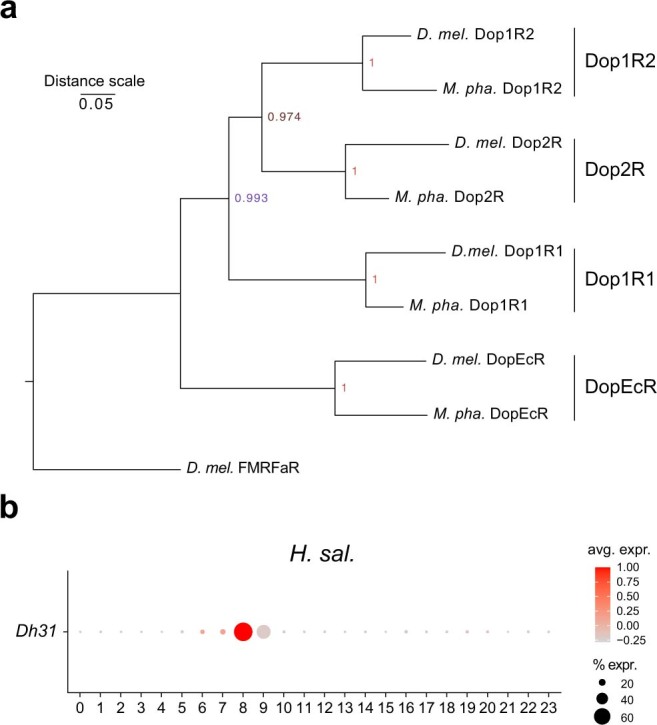
Ant colonies with permanent division of labour between castes and highly distinct roles of the sexes have been conceptualized to be superorganisms, but the cellular and molecular mechanisms that mediate caste/sex-specific behavioural specialization have remained obscure. Here we characterized the brain cell repertoire of queens, gynes (virgin queens), workers and males of Monomorium pharaonis by obtaining 206,367 single-nucleus transcriptomes. In contrast to Drosophila, the mushroom body Kenyon cells are abundant in ants and display a high diversity with most subtypes being enriched in worker brains, the evolutionarily derived caste. Male brains are as specialized as worker brains but with opposite trends in cell composition with higher abundances of all optic lobe neuronal subtypes, while the composition of gyne and queen brains remained generalized, reminiscent of solitary ancestors. Role differentiation from virgin gynes to inseminated queens induces abundance changes in roughly 35% of cell types, indicating active neurogenesis and/or programmed cell death during this transition. We also identified insemination-induced cell changes probably associated with the longevity and fecundity of the reproductive caste, including increases of ensheathing glia and a population of dopamine-regulated Dh31-expressing neurons. We conclude that permanent caste differentiation and extreme sex-differentiation induced major changes in the neural circuitry of ants.


Conflict of interest statement

The authors declare no competing interests.

Figures

Fig. 1
Fig. 1. Transcriptomic classification of cell types in ant brains.
a, The four adult phenotypes of M. pharaonis and a schematic overview of the overall experimental design. Four to five biological replicates for each adult phenotype were prepared for snRNA-seq. For a single biological replicate of an adult phenotype, nuclei for snRNA-seq were isolated from a pool of 30 to 50 whole brains. b, UMAP plot of the 43 cell clusters generated by grouping the 206,367 nuclei obtained from brains of workers, queens, gynes and males. Each dot represents one nucleus. See legend for numerical and colour coding. See also Supplementary Data 1 for the number of nuclei per cluster in each replicate of the four adult phenotypes.
Fig. 2
Fig. 2. Cell compositional differences between brains of adult ants and flies.
a,b, Abundance of different cell types relative to total cells in entire brains of Monomorium and Drosophila (a) and in midbrains of Harpegnathos and Drosophila (b). M. pha., M. pharaonis; H. sal., H. saltator and D. mel., D. melanogaster. The schematic brains on the top left corners illustrate the anatomical differences between a whole brain and a midbrain. In the plots, each dot presents the relative abundance of a cell type in an ant adult phenotype or in a Drosophila sex. The relative abundance of a focal cell type in a specific phenotype or sex was measured as the percentage of cells belonging to the focal cell type out of the total number of cells in a specific phenotype or sex after combining cells from all biological replicates (or all libraries) of the ant phenotype or Drosophila sex. Accordingly, bars are the corresponding means ± s.d. across ant adult phenotypes (n = 4 for Monomorium and 2 for Harpegnathos) or Drosophila sexes (n = 2). Cell types with significant abundance difference assessed by scCODA and with a more than twofold change in relative abundance between species are underlined in a. Note that the original Drosophila midbrain dataset mixed cells from both sexes and that EG could not be detected in this dataset (Extended Data Fig. 3), so the scCODA assessment was not available for the midbrain datasets. MN, monoaminergic neuron; AST, astrocyte; EG, ensheathing glia; CG, cortex glia; SG, surface glia and NA, not available. See also Supplementary Data 4 for data related to this figure.
Fig. 3
Fig. 3. The diversity of KCs in ant brains.
a, Pairwise Pearson correlations and hierarchical clustering of the 12 KC clusters in M. pharaonis brains based on gene expression, showing a clear division into two main classes (A and B). The grey numbers at the branches are bootstrap values. b, Dot plot showing the expression of representative DEGs between class-A and -B KCs. Dot colours represent average expression of a gene and dot sizes represent percentages of cells within each cluster expressing that gene. c, Bar plots showing the proportion of cells from each KC cluster against the total number of KCs in each of the four adult phenotypes, with the dashed line marking the boundary between class-A and -B KCs. d, Radar plot showing the variation in relative abundance of each KC subtype against total brain cells across Monomorium phenotypes. For each KC cluster, the mean across replicates for a phenotype was determined first and then divided by the maximum among the four phenotypes. See Supplementary Data 1 for the exact number of nuclei per KC cluster per phenotype. e, Representative GO terms enriched (FDR < 0.05) by the DEGs that were up-regulated in each KC (sub)class relative to the remaining KCs. Dot colours represent FDR values for each GO term, and dot sizes represent the number of DEGs associated with each GO term. f, Correspondence of KC clusters between Monomorium and Harpegnathos/Apis/Drosophila as predicted from the transcriptional similarities of orthologous genes by MetaNeighbor. A higher AUROC score means higher similarity. Each line links a Monomorium KC cluster to its top hit among the Harpegnathos/Apis/Drosophila KC clusters according to AUROC scores, with line thickness being proportional to the score. Only hits with AUROC > 0.80 are shown. A second hit is plotted as well when the difference between the top and second AUROC score was less than 0.05. AUROC scores for Drosophila α'/β' KCs are mean values across the three independent datasets (Extended Data Fig. 5d).
Fig. 4
Fig. 4. The conserved OL neurons between Monomorium and Drosophila.
a, Annotation of the Monomorium OL clusters (left) based on transcriptional similarity comparison with two independent Drosophila OL single-cell datasets, (Extended Data Fig. 6) and a schematic diagram of the Drosophila OL (right) highlighting the OL cell types conserved in Monomorium. Tm, transmedullary neuron; Mi, medulla intrinsic neuron; Pm, proximal medulla neuron and LC, lobula columnar cells. b, Representative GO terms enriched (FDR < 0.05) by the up-regulated DEGs in each OL cluster relative to the remaining OL neurons. Dot colours represent FDR values for each GO term, and dot sizes represent the number of DEGs associated with each GO term. c, Radar plot showing the variation in relative abundance of each OL cell type against total brain cells across phenotypes. For each OL cluster, the mean across replicates of a phenotype was determined first and then divided by the maximum among the four phenotypes. d, Percentage of cells from c16 (left) and c20 (right) against the total number of brain cells in each adult phenotype. Each dot presents the biological replicate value of an adult phenotype (n = 5 for workers, 4 for queens, 4 for gynes and 4 for males), bars are means ± s.d. across replicates and lowercase letters assign bars to different groups that were significantly different as assessed by scCODA. e, Expression of representative top DEGs from c16 and c20 across all OL clusters. Dot colours represent average expression level of a gene and dot sizes represent percentages of cells within each cluster expressing that gene. f,g, UMAP plot and whole-mount RNA in situ detection of Nlg2 (f) and GABA-B-R3 (g) in the brains of focal adult phenotypes. The UMAP plots are coloured by gene expression (grey is low and red is high), with red circles indicating the cell clusters that preferentially expressed the focal marker genes. White dotted boxes indicate the positions of hybridization signals in the brain images. Scale bars in f; 40, 50 and 50 μm, respectively and g, 50 μm.
Fig. 5
Fig. 5. Specialization and complementarity of Monomorium brains.
a, UMAP plots of the 43 clusters in the brains of workers, queens, gynes and males. Each dot represents one nucleus and is coloured according to cell cluster as in Fig. 1b. The relative abundances of KCs, OL neurons and OPNs against total number of brain cells in each adult phenotype are also presented. b, The number of cell clusters showing significant abundance differences, assessed by scCODA and with >1.3-fold changes, between any two of the four adult phenotypes. c, Cell clusters that displayed significant abundance differences between the sexes (left) and castes (middle) in Monomorium (corresponding to b), with the differences between female and male Drosophila brains and heads as controls (right). Coloured dots represent cell clusters with significant abundance differences and grey dots/stars represent those with no significant differences. d, The variation in relative abundance of each cell type against total brain cells across phenotypes. For each cell cluster, the phenotype-specific mean across replicates was determined first and then divided by the maximum among the four phenotypes. e, 3D brain reconstructions of a worker, queen, gyne and male using confocal microscopy image stacks (an anterior view). MB, mushroom body; mCa, medial calyx of MB; lCa, lateral calyx of MB; ped, peduncle of MB; A, alpha lobe of MB; LO, lobula of OL; ME, medulla of OL; LA, lamina of OL; AL, antennal lobe; GNG, gnathal ganglia; O, ocelli; mO, medial ocelli; d, dorsal; l, lateral; v, ventral. Scale bars, 100 μm. f, Scatter plot showing that the abundance differences per cell cluster between males and gynes are negatively correlated with the same abundance differences between workers and gynes. Each dot represents one of the 43 cell clusters.
Fig. 6
Fig. 6. Cell compositional differences between gyne and queen brains in Monomorium.
a, Cell clusters that display significant abundance differences, as assessed by scCODA and with >1.3-fold changes, between gyne and queen brains. Coloured dots represent cell clusters with significant abundance differences and grey dots represent those with no significant differences. b, The percentage of cells from c38 against total brain cells in each adult phenotype. Each dot represents the value of a phenotype-specific biological replicate (n = 5 for workers, 4 for queens, 4 for gynes and 4 for males), bars are means ± s.d. across replicates, and dotted lines indicate the comparison with significant differences in a. c, Expression level of ple across the 43 cell clusters. The UMAP plot is coloured by gene expression (grey is low and red is high) and the red circle indicates the cell cluster that preferentially expressed ple. d, Representative ovaries of control (Ctrl) and l-dopa treated gynes with yolky oocytes highlighted with red dotted ovals. Scale bar, 200 μm. e, Violin plots showing yolky oocyte number and total surface area in l-dopa treated gynes and control groups (n = 24 for both groups) with P values obtained from two-sided Student’s t-tests. For all box plots inside the kernel density plots, the horizontal thick lines denote median values, the boxes show the range between the 25th and 75th percentiles and the whiskers represent 1.5× the interquartile range. f, Expression of the four dopamine receptors across the 43 cell clusters, with the dashed box highlighting the only cell cluster with a preferential expression of Dop2R. g, Expression level of Dh31 across the 43 cell clusters, in similar notation to c. h,i, The convergent increases in relative abundance of Dh31+ neurons (h) and ensheathing glia (i) in M. pharaonis (accessed by scCODA and with >1.3-fold change) and H. saltator (accessed by Fisher’s exact test with FDR < 0.001 and >1.3-fold change) in reproductively active females compared with uninseminated females. Each dot represents the value of a phenotype-specific biological replicate (n = 4 for gynes and queens) and bars are means ± s.d. across replicates in M. pharaonis.
Extended Data Fig. 1
Extended Data Fig. 1. Quality control metrics of the M. pharaonis single-nucleus RNA-seq datasets.
(a-d) The number of transcripts (a, b) and genes (c, d) detected in the nuclei from each phenotype-specific biological replicate (a, c) and from each adult phenotype after combing biological replicates (b, d). The number of nuclei per category is shown above each box. For all box plots, the horizontal thick lines denote median values, the boxes show the range between the 25th and 75th percentile, and the whiskers represent 1.5× the interquartile range. (e) The correlation of gene expression between bulk RNA-seq data and snRNA-seq data.
Extended Data Fig. 2
Extended Data Fig. 2. Classification of the M. pharaonis clusters into major cell types.
(a) Dot plot showing the expression of neuronal (Syt1, nSyb, and fne) and glial markers (Glaz, bdl, and repo) across the M. pharaonis cell clusters. (b) Dot plot showing the expression of representative markers that define the major cell types. Gene symbols shown in bold font denotes known markers reported by previous studies in other insect species. Gene symbols shown in regular font denotes novel markers obtained from this study. (c) PCA based on average expression profile of each cluster. Clusters are coloured according to cell type category. (d-e) Pairwise transcriptional similarity (measured by AUROC scores) of cell clusters from Monomorium and Drosophila (d), and from Monomorium and Harpegnathos (e). The cell-cluster dendrogram trees were generated by hierarchical clustering using the Ward’s minimum variance method with the distance defined as 1-AUROC. KC: Kenyon cell; OL: optic lobe; PR: photoreceptor; OPN: olfactory projection neuron; MN: monoaminergic neuron; AST: astrocyte; EG: ensheathing glia; CG: cortex glia; SG: surface glia.
Extended Data Fig. 3
Extended Data Fig. 3. Re-analysis of the Drosophila midbrain single-cell dataset.
(a) UMAP plot showing the clustering result of 10,286 cells from Croset et al, which are grouped into 28 clusters. Each dot represents one cell and dots are colored according to cluster identity. (b) Dot plot showing the expression of representative markers that define the known cell types in Drosophila brains. (c) Re-clustering of the glial clusters (c11, c13 and c19) identified three known glial subtypes. (d) Dot plot showing the expression of representative markers that define the known glial subtypes. KC: Kenyon cell; OPN: olfactory projection neuron; MN: monoaminergic neuron; PR: photoreceptor; AST: astrocyte; CG: cortex glia; SG: surface glia.
Extended Data Fig. 4
Extended Data Fig. 4. Kenyon cells in three hymenopteran insects.
(a) Expression of the KC marker Pka-C1 across all cell clusters (left) and whole-mount RNA detection of Pka-C1 by in situ hybridization (right) in a M. pharaonis worker brain. UMAP plot is colored by gene expression (grey is low and red is high) with red solid line indicating the KC clusters. White dotted circles indicate paired mushroom bodies with strong hybridization signal. (b) Pairwise Pearson correlations and hierarchical clustering of the H. saltator KC clusters based on gene expression, showing a clear division into two major classes. The gray numbers at the branches are confidence values based on bootstrap method. (c) Re-analysis of the A. mellifera single-cell dataset. Top left: UMAP plot showing the clustering result of the 2,205 cells from Traniello et al, which are grouped into 13 clusters. Top right: Expression of the honeybee KC marker Phospholipase C epsilon (PLCε) across the 2,205 cells. Dashed line indicates the six clusters that preferentially expressed PLCε. Bottom left: Pairwise Pearson correlations and hierarchical clustering of the six honeybee KC clusters in similar notation as panel b. Bottom right: Dot plot showing the expression of representative markers that define the known KC subtypes in honeybee brains.
Extended Data Fig. 5
Extended Data Fig. 5. Comparison of Kenyon cells across species.
(a-c) Pairwise AUROC scores showing the cross-species transcriptional similarity of the KC subtypes from three hymenopteran insects (M. pharaonis, H. saltator and A. mellifera). Comparisons with AUROC scores > 0.5 are presented as exact values. (d) Pairwise AUROC scores showing the cross-species transcriptional similarity of hymenopteran and Drosophila KC subtypes. Drosophila KCs from three independent studies, namely Davie et al, Croset et al and Li et al, were used for the analysis (see also Supplementary Data 2). Comparisons with AUROC scores > 0.5 are presented as exact values. (e-f) Dot plots showing the expression of representative shared DEGs up-regulated in Drosophila α'/β' KCs (e) and Monomorium c13/c21 KCs (f) in relative to the remaining KC subtypes.
Extended Data Fig. 6
Extended Data Fig. 6. Comparison of optic lobe neurons across species.
(a, b) Pairwise AUROC scores showing the cross-species transcriptional similarity of OL clusters between Monomorium and Drosophila. Drosophila OL cell clusters from two independent studies that focus exclusively on the Drosophila optic lobes, namely Kurmangaliyev et al and Özel et al, were used for the analyses. Comparisons with AUROC scores > 0.5 are presented as exact values. (c) Correspondence of OL clusters between Monomorium and Drosophila as predicted by the AUROC scores in panel a and panel b. Each line links a Monomorium OL cluster to its top hit among the Drosophila OL clusters according to AUROC scores, with line thickness being proportional to the score. A second hit is plotted as well, when the difference between the top and second AUROC score was less than 0.05. (d, e) Violin plots showing the expression of Nlg2 across the Drosophila OL clusters. Dashed boxes indicate the T4/T5 neurons.
Extended Data Fig. 7
Extended Data Fig. 7. Relative volume of neuropil in different adult phenotypes.
The relative volume of a neuropil in an individual brain was calculated by dividing the volume of the neuropil with the entire brain volume (n = 5 for worker, 7 for queen, 6 for gyne and 5 for male). Data are presented as mean ± s.d. across replicates. MB: mushroom body; mCa: medial calyx of MB; lCa: lateral calyx of MB; ped: peduncle of MB; A: alpha lobe of MB; OL: optic lobe; LA: lamina of OL; ME: medulla of OL; LO: lobula of OL; O: ocelli; AL: antennal lobe; GNG: gnathal ganglia.
Extended Data Fig. 8
Extended Data Fig. 8. Phylogenetic analysis of dopamine receptors and expression analysis of Dh31.
(a) Phylogenetic relationship of the dopamine receptors from M. pharaonis and D. melanogaster, indicating that the M. pharaonis genome encodes four distinct dopamine receptors as observed in D. melanogaster. The D. melanogaster FMRFaR protein is used as the outgroup. The phylogenetic tree was built with the GPR domain sequences after alignment by MUSCLE (v.3.8.31) and with the neighbor-joining method implemented in MEGAX. The reliability of the tree was estimated with 1,000 bootstrap replications. (b) Dot plot showing the expression of Dh31 across all the H. saltator cell clusters defined by Sheng et al. Shade of dot represents mean expression within cluster, and size of dot represents percentage of cells within the cluster expressing that gene.

Comment in

  • Complementary brains.
    Sieriebriennikov B. Sieriebriennikov B. Nat Ecol Evol. 2022 Aug;6(8):1060-1061. doi: 10.1038/s41559-022-01805-z. Nat Ecol Evol. 2022. PMID: 35711064 No abstract available.

Similar articles

Cited by

References

    1. Godfrey RK, Swartzlander M, Gronenberg W. Allometric analysis of brain cell number in Hymenoptera suggests ant brains diverge from general trends. Proc. Biol. Sci. / R. Soc. 2021;288:20210199. doi: 10.1098/rspb.2021.0199. - DOI - PMC - PubMed
    1. Raji JI, Potter CJ. The number of neurons in Drosophila and mosquito brains. PloS ONE. 2021;16:e0250381. doi: 10.1371/journal.pone.0250381. - DOI - PMC - PubMed
    1. Lihoreau M, Latty T, Chittka L. An exploration of the social brain hypothesis in insects. Front. Physiol. 2012;3:442. doi: 10.3389/fphys.2012.00442. - DOI - PMC - PubMed
    1. Wheeler, W. M. Ants: Their Structure, Development and Behavior (Columbia Univ. Press, 1910).
    1. Wheeler WM. The ant‐colony as an organism. J. Morphol. 1911;22:307–325. doi: 10.1002/jmor.1050220206. - DOI

Publication types