. 2022 Jun 6:15:100311.
doi: 10.1016/j.mtbio.2022.100311. eCollection 2022 Jun.

Encoding with a fluorescence-activating and absorption-shifting tag generates living bacterial probes for mammalian microbiota imaging

Affiliations

Encoding with a fluorescence-activating and absorption-shifting tag generates living bacterial probes for mammalian microbiota imaging

Zhenping Cao et al. Mater Today Bio. .

Abstract

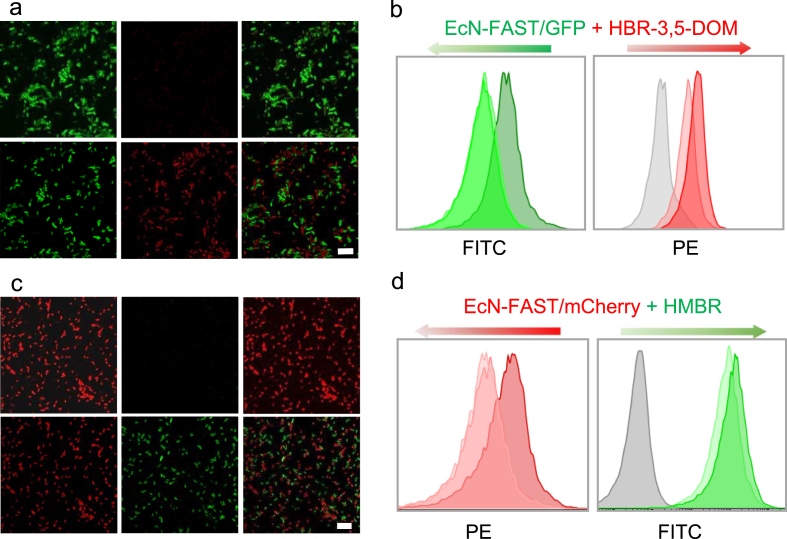
The mammalian microbiota plays essential roles in health. A primary determinant to understand the interaction with the host is the distribution and viability of its key microorganisms. Here, a strategy of encoding with a fluorescence-activating and absorption-shifting tag (FAST) is reported to prepare living bacterial probes for real-time dynamic, dual-modal, and molecular oxygen-independent imaging of the host microbiota. Carrying FAST endows bacteria with rapid on-demand turn on-off fluorescence by adding or removal of corresponding fluorogens. Encoded bacteria are able to reversibly switch emission bands for dual-color fluorescence imaging via fluorogen exchange. Due to molecular oxygen-independent emission of FAST, encoded bacteria can emit fluorescence under anaerobic environments including the gut and tumor. These living probes demonstrate the applicability to quantify the vitality of bacteria transplanted to the gut microbiota. This work proposes a unique fluorescence probe for investigating the dynamics of the host microbiota.

Keywords: Absorption-shifting; Bacteria; Fluorescence-activating; Gut microbiota; Imaging; Tumor.


Conflict of interest statement

The authors declare that they have no known competing financial interests or personal relationships that could have appeared to influence the work reported in this paper.

Figures

Image 1
Graphical abstract
Fig. 1
Fig. 1
Schematic illustration of mammalian microbiota imaging by FAST-encoded living bacterial probes. a Emission characteristics of FAST. b Preparation of EcN-FAST and their applications for real-time dynamic, dual-modal, and molecular oxygen-independent imaging of microbiota associated with the intestinal tract and tumor.
Fig. 2
Fig. 2
In vitro on-demand fluorescence turn on-off. a, b Fluorescence images of EcN-FAST with or without addition of (a) HMBR and (b) HBR-3,5-DOM. c Emission spectra of EcN-FAST after binding with corresponding fluorogens. d, e Results of (d) LSCM imaging and (e) flow cytometric analysis of EcN-FAST with or without addition of 20 ​μM fluorogens. Scale bar: 10 ​μm f LSCM imaging of pre-activated EcN-FAST after fluorogen removal with PBS for the indicated times. Scale bar: 10 ​μm ​g Relationships between mean fluorescence intensity of EcN-FAST and corresponding fluorogens removal times.
Fig. 3
Fig. 3
Reversible switch of emission bands in vitro. a Typical LSCM images of HMBR-activated EcN-FAST after adding HBR-3,5-DOM. Scale bar, 10 ​μm ​b Fluorescence switch by replacing HMBR with HBR-3,5-DOM. c Relationship of fluorescence intensity after rinsing HMBR-activated EcN-FAST with PBS solution of HBR-3,5-DOM for the indicated times. d LSCM images of HBR-3,5-DOM-activated EcN-FAST after adding HMBR. Scale bar, 10 ​μm e Fluorescence switch by replacing HBR-3,5-DOM with HMBR. f Relationship of fluorescence intensity after rinsing HBR-3,5-DOM-activated EcN-FAST with PBS solution of HMBR for the indicated times. Error bars represent standard deviation (n ​= ​3).
Fig. 4
Fig. 4
Distinguishability of EcN-FAST in vitro. a LSCM images of the mixture of HMBR-activated EcN-FAST and EcN expressing GFP with or without the addition of HBR-3,5-DOM. Scale bar: 10 ​μm ​b Flow cytometry histograms of HMBR-activated EcN-FAST in the mixture with or without supplementation with HBR-3,5-DOM. c LSCM images of the mixture of HBR-3,5-DOM-activated EcN-FAST and EcN expressing mCherry with or without the addition of HMBR. Scale bar: 10 ​μm ​d Flow cytometry histograms of HBR-3,5-DOM-activated EcN-FAST in the mixture with or without supplementation with HMBR.
Fig. 5
Fig. 5
In vivo imaging under anaerobic environments. a IVIS images of the intestinal tracts sectioned from mice treated with EcN-FAST and HMBR. b Fluorescence intensity of EcN-FAST in the intestinal tract after HMBR supplementation. c IVIS images of the intestinal tracts sampled from mice dosed with HMBR-activated EcN-FAST and HBR-3,5-DOM. d Fluorescence intensity of HMBR-activated EcN-FAST in the intestinal tract after adding with HBR-3,5-DOM. Error bars represent standard deviation. e IVIS images of mice after intratumoral injection with EcN-FAST and HMBR. f Fluorescence intensity of EcN-FAST in tumor site after adding HMBR. g IVIS images of mice after intratumoral administration with HMBR-activated EcN-FAST and HBR-3,5-DOM. h Fluorescence intensity of HMBR-activated EcN-FAST in tumor site after adding HBR-3,5-DOM. HMBR: λex 488 ​nm, λem 510 ​nm; HBR-3,5-DOM: λex 587 ​nm, λem 610 ​nm. Error bars represent the standard deviation (n ​= ​3–4). Significance was assessed using Student's t-test, giving p values, p ​< ​0.05, ∗. Scale bar in IVIS image refers to radiance (p/s/cm2/sr).
Fig. 6
Fig. 6
Quantification of in vivo bacterial viability by EcN-FAST. a Relationship between the intensity of FAST fluorescence and the CFUs of EcN-FAST. b IVIS images of the intestinal tracts sampled from mice orally gavaged with the indicated amounts of EcN-FAST and HMBR. c Numbers of EcN-FAST in the intestine, colon, and cecum quantified by plate counting. d Total amounts of EcN-FAST retaining in the intestinal tract. e Relationship between fluorescence intensity of HMBR-activated EcN-FAST and the count of EcN-FAST in the intestine tract. Error bars represent standard deviation (n ​= ​3–4). Significance was assessed using Student's t-test, giving p values, p ​< ​0.05, ∗; p ​< ​0.01, ∗∗; p ​< ​0.005, ∗∗∗. Scale bar in IVIS image refers to radiance (p/s/cm2/sr).

Similar articles

Cited by

References

    1. Wu Y., Wang C.Z., Wan J.Y., Yao H., Yuan C.S. Dissecting the interplay mechanism between epigenetics and gut microbiota: health maintenance and disease prevention. Int. J. Mol. Sci. 2021;22:6933. - PMC - PubMed
    1. Heintz-Buschart A., Wilmes P. Human gut microbiome: function matters. Trends Microbiol. 2018;26:563–574. - PubMed
    1. Budden K.F., Gellatly S.L., Wood D.L., Cooper M.A., Morrison M., Hugenholtz P., Hansbro P.M. Emerging pathogenic links between microbiota and the gut-lung axis. Nat. Rev. Microbiol. 2017;15:55–63. - PubMed
    1. Li X., Xing L., Lai R., Yuan C., Humbert P. Literature mapping: association of microscopic skin microflora and biomarkers with macroscopic skin health. Clin. Exp. Dermatol. 2021;46:21–27. - PMC - PubMed
    1. Helmink B.A., Khan M.A.W., Hermann A., Gopalakrishnan V., Wargo J.A. The microbiome, cancer, and cancer therapy. Nat. Med. 2019;25:377–388. - PubMed

LinkOut - more resources