. 2022 May 30:13:896753.
doi: 10.3389/fendo.2022.896753. eCollection 2022.

ASK1-Interacting Protein 1 Acts as a Novel Predictor of Type 2 Diabetes

Affiliations

ASK1-Interacting Protein 1 Acts as a Novel Predictor of Type 2 Diabetes

Zhigao Song et al. Front Endocrinol (Lausanne). .

Erratum in

Abstract

Type 2 diabetes (T2D) mellitus is a chronic inflammatory disease characterized with high secretion of tumor necrosis factor (TNF)-α, but the regulatory pathway of TNF-α production in T2D has not been fully elucidated. ASK1-interacting protein 1 (AIP1) is a signaling scaffold protein that modulates several pathways associated with inflammation. In this study, we aimed to investigate the role of AIP1 in T2D development. Our results revealed that AIP1 was downregulated in omental adipose tissue (OAT) of obese patients with T2D compared with that in obese patients. In addition, Pearson's correlation test showed that AIP1 was negatively correlated with the homeostatic model assessment for insulin resistance (HOMA-IR, r = -0.4829) and waist-to-hip ratio (r = -0.2614), which are major clinical indexes of T2D. As revealed by the proteomic analysis, immunohistochemistry, and ELISA, the OAT and the serum of obese patients with T2D presented high inflammatory status. And the increased inflammatory factors TNF-α and C-reactive protein C (CRP) in the serum of obese patients with T2D showed a positive correlation with HOMA-IR (TNF-α, r = 0.4728; CRP, r = 0.5522). Interestingly, AIP1 deficiency in adipocytes facilitated TNF-α secretion and retarded glucose uptake. Mechanistically, AIP1 deletion in human adipocytes activated JNK, p38 MAPK, and ERK1/2 signaling. Furthermore, inhibition of these signaling pathways using specific inhibitors could suppress these signal activation and insulin resistance caused by AIP1 deficiency. In addition, AIP1 and TNF-α expression in the OAT of patients with T2D recovered to normal levels after laparoscopic Roux-en-Y gastric bypass (RYGB) surgery. These findings indicate that AIP1 is negatively correlated with the clinical indexes of T2D. It modulates TNF-α expression in OAT via JNK, p38 MAPK, and ERK1/2 signaling.

Keywords: AIP1; adipose inflammation; insulin resistance; type 2 diabetes; visceral adipose.


Conflict of interest statement

The authors declare that the research was conducted in the absence of any commercial or financial relationships that could be construed as a potential conflict of interest.

Figures

Figure 1
Figure 1
AIP1 was negatively correlated with obesity-related T2D. (A, B) Representative immune-histochemical staining (A), and quantification (B) of AIP1 in the OAT of obese patients (n=46) and obese patients with T2D (n=46). Scale bar, 200 μm. Kruskal-Wallis test, *P < 0.05. (C, D) Pearson’s correlation test to reveal the correlations of AIP1 and HOMA-IR (C) or WHR (D) in 92 consecutively admitted patients with or without T2D, P < 0.05 indicated significant correlation.
Figure 2
Figure 2
OAT of patients with T2D showed increased pro-inflammatory status. (A) Gene Ontology (GO) enrichment analysis of the biological process in the adipose tissue of obese patients and obese patients with T2D. The top ten biological processes were showed. Fisher’s Exact Test, ***FDR (FDR adjusted p-value) < 0.001. (B, C) Representative HE staining (B) and quantification of adipocyte size (C) in the OAT of obese patients and obese patients with T2D. Scale bar, 200 μm. Unpaired Student’s t-test, ns, no significance. (D, E) Representative immune-histochemical staining (D), and quantification (E) of TNF-α in the OAT of obese patients and obese patients with T2D. Scale bar, 200 μm. Kruskal-Wallis test, *P < 0.05. (F) ELISA analysis of TNF-α in the serum of obese patients (n=46) and obese patients with T2D (n=46). Unpaired Student’s t-test *P < 0.05. (G) Pearson’s correlation test to reveal the corrections of TNF-α and HOMA-IR in 92 consecutive admission patients with or without T2D, P < 0.05 indicated significant correlation. (H) ELISA analysis of CRP in the plasma of obese patients (n=46) and obese patients with T2D (n=46). Unpaired Student’s t-test *P < 0.05. (I) Pearson’s correlation test to reveal the corrections of CRP and HOMA-IR in 92 consecutive admission patients with or without T2D, P < 0.05 indicated significant correlation.
Figure 3
Figure 3
In vitro AIP1 deletion enhanced TNF-α production and insulin resistance in adipocytes. (A, B) Representative western blot analysis (A) and quantification (B) of AIP1 expression in adipocytes differentiated from ADSCs which were infected with LV-sgRNA-Ctrl or LV-sgRNA-AIP1, n=3, unpaired Student’s t-test, *P<0.05. (C–E) Representative immune-fluorescent images of lipids (green) stained by BODIPY (C), the quantification of lipid droplet size (D), and the quantification of lipid area per field (E) in human adipocytes differentiated from ADSCs which were infected with LV-sgRNA-Ctrl or LV-sgRNA-AIP1. The nuclei stained by Hoechst are indicated in blue. Scale bar, left, 200 μm; right, 50 μm; n=3, unpaired Student’s t-test, ns, no significance. (F, G) Human adipocytes differentiated from ADSCs which were infected with LV-sgRNA-Ctrl or LV-sgRNA-AIP1 and treated by 10 ng/mL TNF-α for 4, 8, 12, and 24 hours, the concentration of glucose (G) in the supernatant was determined using GOD-POD method. Further, supernatant was replaced with serum-free medium and incubated for another 24h, and the quantification of TNF-α in the supernatant (F) was performed using ELISA kit, n=3, two-way ANOVA followed by Tukey’s test for multiple comparisons, ns, no significance, *P < 0.05. (H) Human adipocytes differentiated from ADSCs which were infected with LV-sgRNA-Ctrl or LV-sgRNA-AIP1 and treated by 10 ng/mL TNF-α for 12 hours, then cells were starved overnight with serum free medium. Quantification of 2-DG uptake of adipocyte was performed using colorimetric method, n=3, two-way ANOVA followed by Tukey’s test for multiple comparisons, ns, no significance, *P < 0.05.
Figure 4
Figure 4
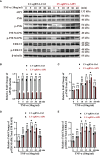
AIP1 deficiency in adipocytes promoted TNF-α induced JNK and p38 MAPK/ERK activation. (A-E) Representative western blot analysis and quantification of AIP1 (A, B), p-JNK (A, C), p-p38 MAPK (A, D), and p-ERK (A, E) expression in human adipocytes differentiated from ADSCs which were infected with LV-sgRNA-Ctrl or LV-sgRNA-AIP1 and treated with 10 ng/mL TNF-α for 0, 5, 10, 15, 30, and 60 minutes, n=3, two-way ANOVA followed by Tukey’s test for multiple comparisons, ns, no significance, *P < 0.05.
Figure 5
Figure 5
Inhibition of JNK, p38 MAPK and ERK reversed the changes caused by AIP1 deficiency in TNF-α treated adipocytes. ADSCs infected with LV-sgRNA-Ctrl or LV-sgRNA-AIP1 were differentiated to matured adipocytes and pretreated with specific inhibitors, including 10 μM p38 MAPK inhibitor SB203580, 10 μM ERK1/2 inhibitor KO-947, and 10 μM JNK inhibitor SP600125 for 1 hour. The adipocytes were further stimulated by 10 ng/mL TNF-α combined with the specific inhibitors for 12 hours. (A, B) The representative western blot analysis (A) and quantification (B) of AIP1, n=3, two-way ANOVA followed by Tukey’s test for multiple comparisons, *P < 0.05. (C) The supernatant was replaced with serum-free medium and incubated for another 24 hours, and the quantification of TNF-α in the supernatant was performed using ELISA kit, n=3, two-way ANOVA followed by Tukey’s test for multiple comparisons, *P < 0.05; ns, no significance. (D) The quantification of glucose in the supernatant was performed using the GOD-POD method, n=3, two-way ANOVA followed by Tukey’s test for multiple comparisons, *P < 0.05; ns, no significance. (E) Adipocytes were starved overnight with serum free medium. And the quantification of 2-DG uptake of adipocytes were performed using colorimetric method. n=3, two-way ANOVA followed by Tukey’s test for multiple comparisons, *P < 0.05; ns, no significance.
Figure 6
Figure 6
Expression of AIP1 was increased after RYGB surgery. (A, B) Representative immune-histochemical staining (A) and quantification (B) of AIP1 in the adipose tissues from patients with T2D who had undergone surgery (n=3) or not (n=3). Scale bar, 200 μm. Kruskal-Wallis test, *P < 0.05. (C–D) Representative immune-histochemical staining (C) and quantification (D) of TNF-α in the adipose tissues from patients with T2D who had undergone surgery (n=3) or not (n=3). Scale bar, 200 μm. Kruskal-Wallis test, *P < 0.05.
Figure 7
Figure 7
The schematic diagram of the role of AIP1 in T2D. AIP1, a novel member of the Ras-GAP family, was decreased in the OAT of T2D patients. Furthermore, AIP1 expression negatively correlated with HOMA-IR and WHR, the major features of patients with T2D. Mechanistically, AIP1 deficiency in the OAT elevated the expression of inflammatory factors via JNK/p38 MAPK/ERK signaling.

Similar articles

Cited by

References

    1. Cassano PA, Rosner B, Vokonas PS, Weiss ST. Obesity and Body Fat Distribution in Relation to the Incidence of Non-Insulin-Dependent Diabetes Mellitus. A Prospective Cohort Study of Men in the Normative Aging Study. Am J Epidemiol (1992) 136:1474–86. doi: 10.1093/oxfordjournals.aje.a116468 - DOI - PubMed
    1. Pontiroli AE, Galli L. Duration of Obesity Is a Risk Factor for Non-Insulin-Dependent Diabetes Mellitus, Not for Arterial Hypertension or for Hyperlipidaemia. Acta Diabetol (1998) 35:130–6. doi: 10.1007/s005920050117 - DOI - PubMed
    1. Ross R, Aru J, Freeman J, Hudson R, Janssen I. Abdominal Adiposity and Insulin Resistance in Obese Men. Am J Physiol Endocrinol Metab (2002) 282:E657–63. doi: 10.1152/ajpendo.00469.2001 - DOI - PubMed
    1. Neeland IJ, Turer AT, Ayers CR, Powell-Wiley TM, Vega GL, Farzaneh-Far R, et al. . Dysfunctional Adiposity and the Risk of Prediabetes and Type 2 Diabetes in Obese Adults. JAMA (2012) 308:1150–9. doi: 10.1001/2012.jama.11132 - DOI - PMC - PubMed
    1. Tchernof A, Despres JP. Pathophysiology of Human Visceral Obesity: An Update. Physiol Rev (2013) 93:359–404. doi: 10.1152/physrev.00033.2011 - DOI - PubMed

Publication types

MeSH terms

Substances