. 2022 May 27:12:912935.
doi: 10.3389/fonc.2022.912935. eCollection 2022.

Long Non-Coding RNA TMPO-AS1 Promotes GLUT1-Mediated Glycolysis and Paclitaxel Resistance in Endometrial Cancer Cells by Interacting With miR-140 and miR-143

Affiliations

Long Non-Coding RNA TMPO-AS1 Promotes GLUT1-Mediated Glycolysis and Paclitaxel Resistance in Endometrial Cancer Cells by Interacting With miR-140 and miR-143

Peixin Dong et al. Front Oncol. .

Abstract

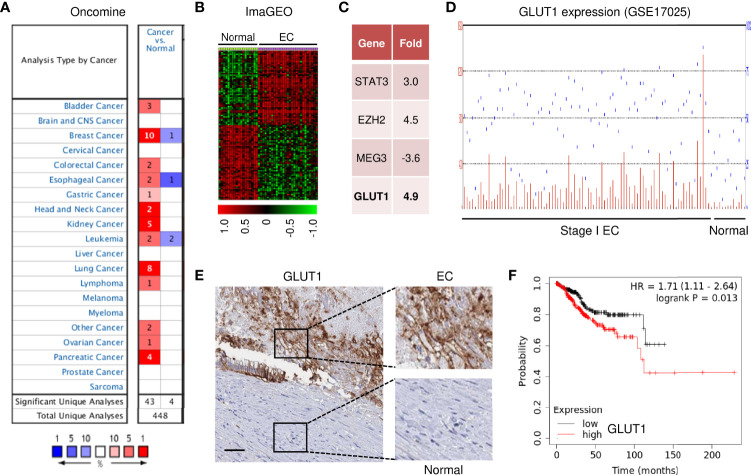
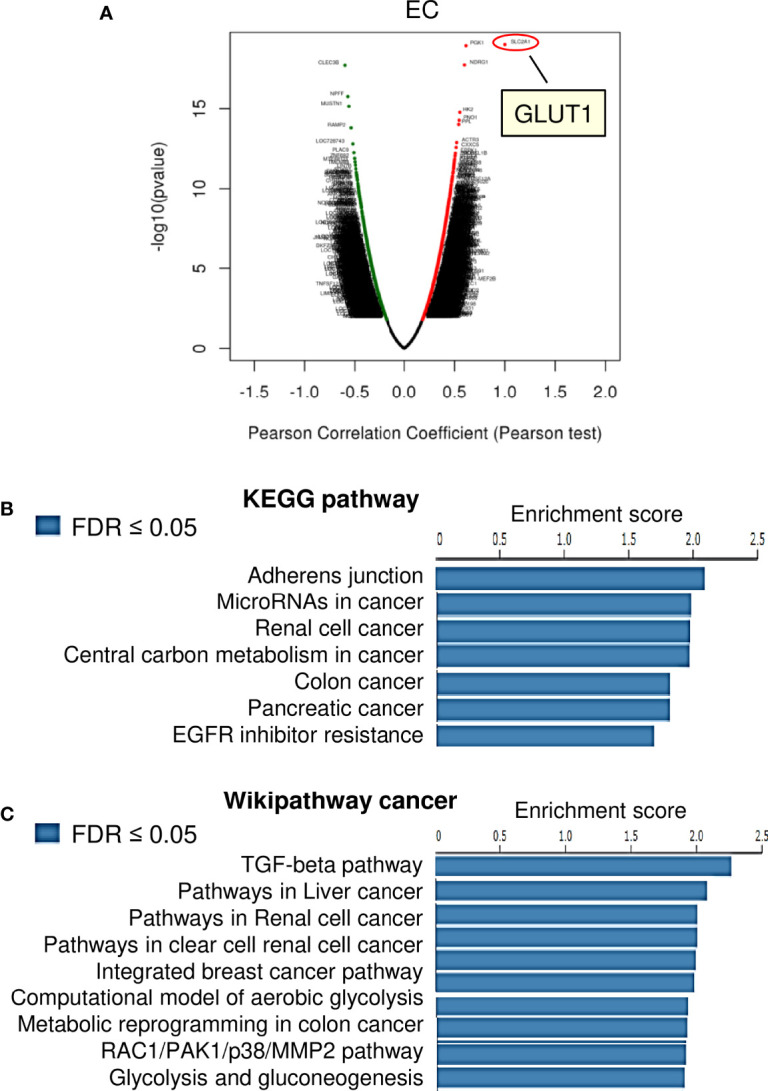
Increased glycolysis in tumor cells is frequently associated with drug resistance. Overexpression of glucose transporter-1 (GLUT1) promotes the Warburg effect and mediates chemoresistance in various cancers. Aberrant GLUT1 expression is considered as an essential early step in the development of endometrial cancer (EC). However, its role in EC glycolysis and chemoresistance and the upstream mechanisms underlying GLUT1 overexpression, remain undefined. Here, we demonstrated that GLUT1 was highly expressed in EC tissues and cell lines and that high GLUT1 expression was associated with poor prognosis in EC patients. Both gain-of-function and loss-of-function studies showed that GLUT1 increased EC cell proliferation, invasion, and glycolysis, while also making them resistant to paclitaxel. The long non-coding RNA TMPO-AS1 was found to be overexpressed in EC tissues and to be negatively associated with EC patient outcomes. RNA-immunoprecipitation and luciferase reporter assays confirmed that TMPO-AS1 elevated GLUT1 expression by directly binding to two critical tumor suppressor microRNAs (miR-140 and miR-143). Downregulation of TMPO-AS1 remarkably reduced EC cell proliferation, invasion, glycolysis, and paclitaxel resistance in EC cells. This study established that dysregulation of the TMPO-AS1-miR-140/miR-143 axis contributes to glycolysis and drug resistance in EC cells by up-regulating GLUT1 expression. Thus, inhibiting TMPO-AS1 and GLUT1 may prove beneficial in overcoming glycolysis-induced paclitaxel resistance in patients with EC.

Keywords: GLUT1; TMPO-AS1; endometrial cancer; glycolysis; long non-coding RNA; miR-140; miR-143; paclitaxel resistance.


Conflict of interest statement

The authors declare that the research was conducted in the absence of any commercial or financial relationships that could be construed as a potential conflict of interest.

Figures

Figure 1
Figure 1
GLUT1 Expression and Clinical Importance in EC. (A) The mRNA expression of GLUT1 (cancer versus normal tissues) in pan-cancers was analyzed with the Oncomine database. The graphic demonstrates the number of datasets that meet our threshold for each cancer type. Red: up-regulation; blue: down-regulation. (B) The heatmap was generated by the ImaGEO database using two EC data sets (GSE17025 and GSE56026). (C) Up- or down-regulated genes in EC tissues compared to normal tissues (ImaGEO). (D) The GEO dataset was analyzed for GLUT1 expression in stage I EC samples and normal endometrium samples. (E) The expression of GLUT1 protein was examined in EC tissue and adjacent normal tissues (Human Protein Atlas database; scale bar: 100 μm). (F) The probability of overall survival in EC patients expressing high or low GLUT1 levels was assessed using the KM plotter database.
Figure 2
Figure 2
Critical Roles of GLUT1 in Promoting EC Cell Phenotypes. (A) Western blotting analysis of GLUT1 protein expression in a normal endometrial cell line (EM) and human EC cell lines. (B) Western blotting analysis of GLUT1 expression in GLUT1-overexpressing HHUA cells and Ishikawa cells with GLUT1 silencing. (C–F) EC cell proliferation (C), invasion (D), glucose consumption (E), and lactate production (F) assays following GLUT1 overexpression or knockdown. (G, H) GLUT1-overexpressing HHUA cells (G) and Ishikawa cells after knockdown of GLUT1 (H) were treated with different concentrations of paclitaxel, and cell viability was examined using the CCK-8 assay. Vec: vector. ***P < 0.001.
Figure 3
Figure 3
KEGG Pathway and Wiki Pathway Enrichment Analysis of GLUT1-Associated Genes in EC. (A) Genes that were found to be highly co-expressed with GLUT1 in the TCGA EC dataset from the LinkedOmics database were chosen. (B, C) Gene set enrichment analysis for positively correlated genes of GLUT1 in TCGA EC tissues. Enrichment analysis for KEGG pathways (B) and Wikipathway cancer (C) was performed using the LinkedOmics database.
Figure 4
Figure 4
GLUT1 is a Positive Upstream Regulator of MMP1, MMP14, and Cyclin D1. (A) The expression of GLUT1 was positively correlated with the expression of MMP1, MMP14, and Cyclin D1 in EC tissues from the TCGA dataset. (B) qRT-PCR analysis of the indicated genes in EC cells after overexpression or knockdown of GLUT1. (C) The expression of MMP1, MMP14, and Cyclin D1 in TCGA EC and normal tissues (ENCORI database). ***P < 0.001.
Figure 5
Figure 5
GLUT1 is a Target Gene of MiR-140 and MiR-143. (A) Venn diagram showing the overlapping miRNAs predicted by three online databases. (B) Computational prediction of duplex formation between miR-140/miR-143 and the GLUT1 3′-UTR region. (C) The expression of miR-140/miR-143 in TCGA EC tissues and normal tissues (miR-TV database). (D) qRT-PCR analysis of miR-140/miR-143 in EC and EM cells. (E) GLUT1 protein expression was examined using western blotting assays in EC cells transfected as indicated. (F) Luciferase reporter assays in Ishikawa cells transfected with the wild-type (WT) or mutant (MUT) GLUT1 3′-UTR, as well as miR-140/miR-143 mimic or a control mimic. ***P < 0.001.
Figure 6
Figure 6
MiR-140 and miR-143 Suppress Glycolysis and Chemoresistance of EC Cells. (A–D) Proliferation (A), invasion (B), glucose consumption (C), and lactate production (D) assays in EC cells after miR-140 or miR-143 overexpression or knockdown. (E) HHUA cells transfected with miR-140 inhibitor (inh) and Ishikawa cells transfected with miR-140 mimic (mic) were treated with different concentrations of paclitaxel, and cell viability was examined using the CCK-8 assay. (F) The mRNA expression of the indicated genes was examined in Ishikawa cells after overexpression of miR-140, and in HHUA cells after the knockdown of miR-140. ***P < 0.001.
Figure 7
Figure 7
LncRNA TMPO-AS1 Interacts with MiR-140 and MiR-143 to Inhibit Their Expression. (A) Workflow for identifying possible lncRNAs that regulate the expression of miR-140 and miR-143 simultaneously. (B, C) Expression of TMPO-AS1 in TCGA EC and normal tissues (B: ENCORI database; C: Wanderer database). (D) The probability of overall survival in EC patients expressing high or low TMPO-AS1 levels was examined using the KM plotter database. (E, F) TMPO-AS1 expression analysis in EC samples with varying histologic grades (E: well (G1), moderate (G2), and poor (G3)) and tumor stages (F: I–IV) (TANRIC database). (G) qRT-PCR analysis of TMPO-AS1 expression in EC and EM cells. (H) Luciferase reporter assays in Ishikawa cells transfected with wild-type (WT) or mutant (MUT) TMPO-AS1 fragments, as well as miR-140/miR-143 mimic or control mimic. (I) The expression of TMPO-AS1, miR-140, and miR-143 in Ishikawa cells transfected with TMPO-AS1 siRNA (or control siRNA) was examined using qRT-PCR analysis. ***P < 0.001.
Figure 8
Figure 8
TMPO-AS1 Induces GLUT1 Expression by Repressing MiR-140 and MiR-143 Levels. (A) GLUT1 protein expression was measured in Ishikawa and HHUA cells transfected with (or without) TMPO-AS1 siRNA, along with (or without) miR-140/miR-143 inhibitor. (B) Examination of MMP1, MMP14, and Cyclin D1 expression in Ishikawa cells transfected as indicated. (C) Correlation analysis between TMPO-AS1 and GLUT1 or between TMPO-AS1 and miR-140/miR-143. ***P < 0.001.
Figure 9
Figure 9
Knockdown of TMPO-AS1 Inhibits Glycolysis and Reverses Chemoresistance of EC Cells.(A–D) Proliferation (A), invasion (B), glucose consumption (C), and lactate production (D) assays in EC cells after the knockdown of TMPO-AS1. (E, F) HHUA (E) or Ishikawa cells (F) were transfected with TMPO-AS1 siRNA (or control siRNA) and treated with different concentrations of paclitaxel. Cell viability was examined using a CCK-8 assay. ***P < 0.001.
Figure 10
Figure 10
Graphical Abstract showing that the LncRNA TMPO-AS1 Regulates Glycolysis and Paclitaxel Resistance in EC Cells by Affecting the MiR-140/MiR-143-GLUT1 Pathway.

References

    1. Hanahan D, Weinberg RA. Hallmarks of Cancer: The Next Generation. Cell (2011) 144(5):646–74. doi: 10.1016/j.cell.2011.02.013 - DOI - PubMed
    1. Ganapathy-Kanniappan S, Geschwind JF. Tumor Glycolysis as a Target for Cancer Therapy: Progress and Prospects. Mol Cancer (2013) 12:152. doi: 10.1186/1476-4598-12-152 - DOI - PMC - PubMed
    1. Zhao Y, Butler EB, Tan M. Targeting Cellular Metabolism to Improve Cancer Therapeutics. Cell Death Dis (2013) 4(3):e532. doi: 10.1038/cddis.2013.60 - DOI - PMC - PubMed
    1. Ma L, Zong X. Metabolic Symbiosis in Chemoresistance: Refocusing the Role of Aerobic Glycolysis. Front Oncol (2020) 10:5. doi: 10.3389/fonc.2020.00005 - DOI - PMC - PubMed
    1. Hsu PP, Sabatini DM. Cancer Cell Metabolism: Warburg and Beyond. Cell (2008) 134(5):703–7. doi: 10.1016/j.cell.2008.08.021 - DOI - PubMed