

Responsive Multivesicular Polymeric Nanovaccines that Codeliver STING Agonists and Neoantigens for Combination Tumor Immunotherapy
- PMID: 35712773
- PMCID: PMC9376841
- DOI: 10.1002/advs.202201895
Responsive Multivesicular Polymeric Nanovaccines that Codeliver STING Agonists and Neoantigens for Combination Tumor Immunotherapy
Abstract
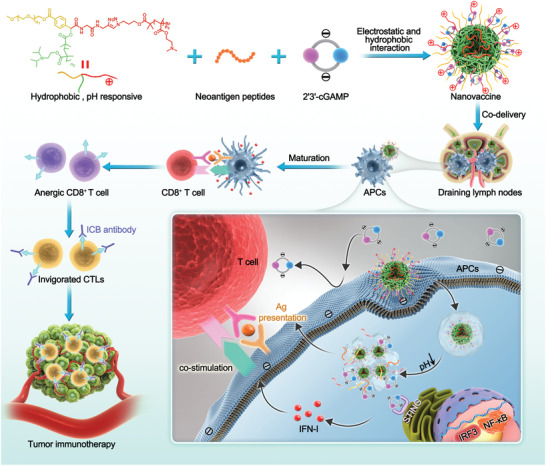
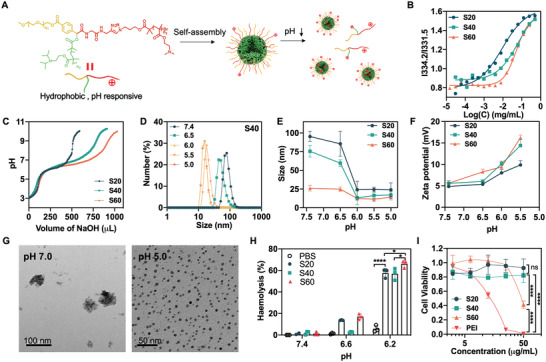
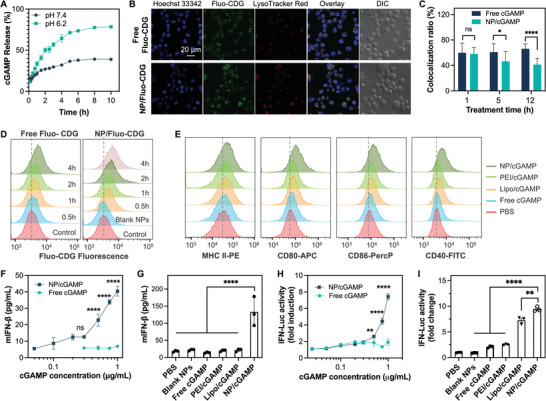
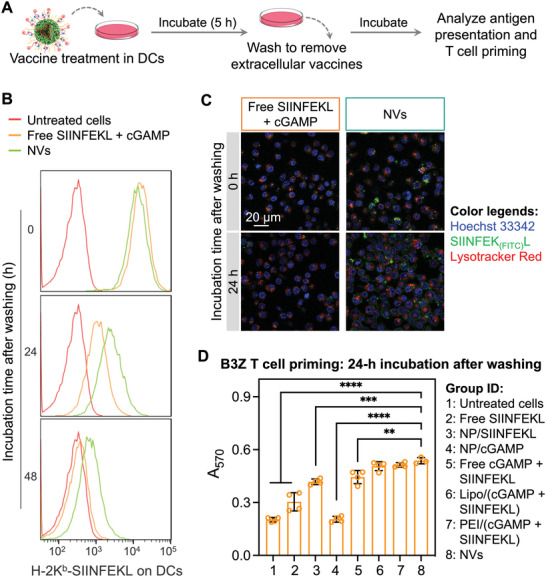
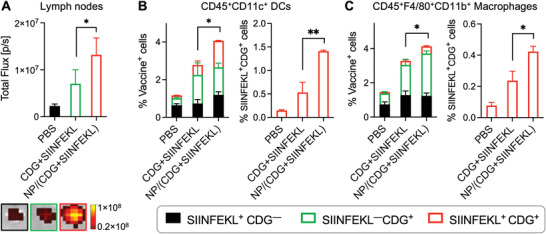
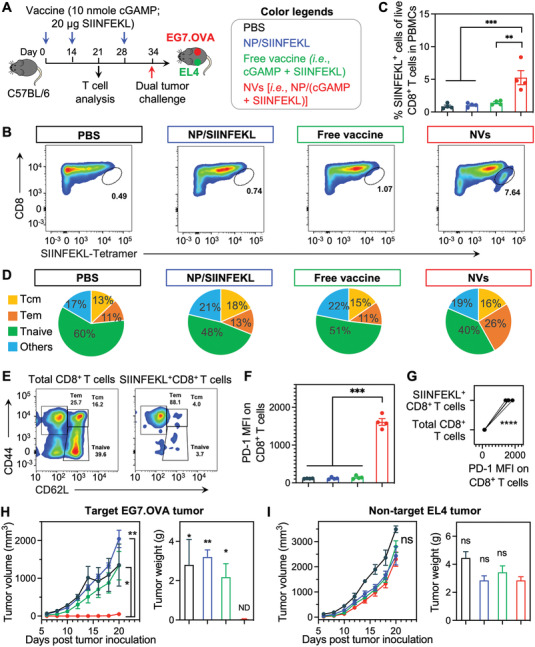
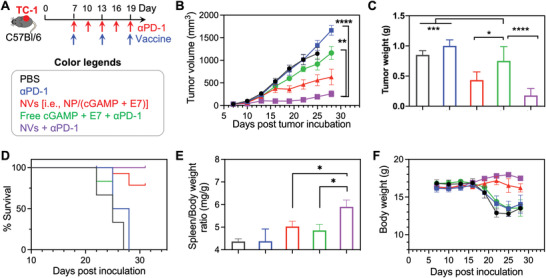
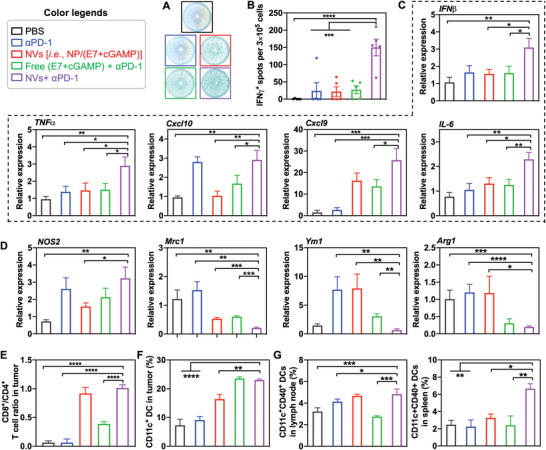
Immune checkpoint blockade (ICB) has significantly advanced cancer immunotherapy, yet its patient response rates are generally low. Vaccines, including immunostimulant-adjuvanted peptide antigens, can improve ICB. The emerging neoantigens generated by cancer somatic mutations elicit cancer-specific immunity for personalized immunotherapy; the novel cyclic dinucleotide (CDN) adjuvants activate stimulator of interferon genes (STING) for antitumor type I interferon (IFN-I) responses. However, CDN/neoantigen vaccine development has been limited by the poor antigen/adjuvant codelivery. Here, pH-responsive CDN/neoantigen codelivering nanovaccines (NVs) for ICB combination tumor immunotherapy are reported. pH-responsive polymers are synthesized to be self-assembled into multivesicular nanoparticles (NPs) at physiological pH and disassembled at acidic conditions. NPs with high CDN/antigen coloading are selected as NVs for CDN/antigen codelivery to antigen presenting cells (APCs) in immunomodulatory lymph nodes (LNs). In the acidic endosome of APCs, pH-responsive NVs facilitate the vaccine release and escape into cytosol, where CDNs activate STING for IFN-I responses and antigens are presented by major histocompatibility complex (MHC) for T-cell priming. In mice, NVs elicit potent antigen-specific CD8+ T-cell responses with immune memory, and reduce multifaceted tumor immunosuppression. In syngeneic murine tumors, NVs show robust ICB combination therapeutic efficacy. Overall, these CDN/neoantigen-codelivering NVs hold the potential for ICB combination tumor immunotherapy.
Keywords: cGAS-STING; cancer immunotherapy; nanovaccine; neoantigen; pH responsiveness; polymeric nanocarrier; vaccine codelivery.
© 2022 The Authors. Advanced Science published by Wiley-VCH GmbH.
Conflict of interest statement
The authors declare no conflict of interest.
Figures
Similar articles
-
Ionizable polymeric nanocarriers for the codelivery of bi-adjuvant and neoantigens in combination tumor immunotherapy.Bioact Mater. 2023 Aug;26:169-180. doi: 10.1016/j.bioactmat.2023.02.016. Epub 2023 Mar 3. Bioact Mater. 2023. PMID: 36883121 Free PMC article.
-
A Cancer Nanovaccine for Co-Delivery of Peptide Neoantigens and Optimized Combinations of STING and TLR4 Agonists.ACS Nano. 2024 Mar 5;18(9):6845-6862. doi: 10.1021/acsnano.3c04471. Epub 2024 Feb 22. ACS Nano. 2024. PMID: 38386282 Free PMC article.
-
Engineering and Delivery of cGAS-STING Immunomodulators for the Immunotherapy of Cancer and Autoimmune Diseases.Acc Chem Res. 2023 Nov 7;56(21):2933-2943. doi: 10.1021/acs.accounts.3c00394. Epub 2023 Oct 6. Acc Chem Res. 2023. PMID: 37802125 Free PMC article.
-
Effective design of therapeutic nanovaccines based on tumor neoantigens.J Control Release. 2025 Apr 10;380:17-35. doi: 10.1016/j.jconrel.2025.01.078. Epub 2025 Feb 3. J Control Release. 2025. PMID: 39892648 Review.
-
Lymph node-targeting nanovaccines for cancer immunotherapy.J Control Release. 2022 Nov;351:102-122. doi: 10.1016/j.jconrel.2022.09.015. Epub 2022 Sep 20. J Control Release. 2022. PMID: 36115556 Review.
Cited by
-
Nanomaterial-encapsulated STING agonists for immune modulation in cancer therapy.Biomark Res. 2024 Jan 7;12(1):2. doi: 10.1186/s40364-023-00551-z. Biomark Res. 2024. PMID: 38185685 Free PMC article. Review.
-
Progress Update on STING Agonists as Vaccine Adjuvants.Vaccines (Basel). 2025 Mar 31;13(4):371. doi: 10.3390/vaccines13040371. Vaccines (Basel). 2025. PMID: 40333245 Free PMC article. Review.
-
Nanoparticle-based drug delivery systems to enhance cancer immunotherapy in solid tumors.Front Immunol. 2023 Aug 3;14:1230893. doi: 10.3389/fimmu.2023.1230893. eCollection 2023. Front Immunol. 2023. PMID: 37600822 Free PMC article. Review.
-
STING Agonist-Loaded Nanoparticles Promotes Positive Regulation of Type I Interferon-Dependent Radioimmunotherapy in Rectal Cancer.Adv Sci (Weinh). 2024 Feb;11(7):e2307858. doi: 10.1002/advs.202307858. Epub 2023 Dec 8. Adv Sci (Weinh). 2024. PMID: 38063844 Free PMC article.
-
Lymph node-targeting adjuvant/neoantigen-codelivering vaccines for combination glioblastoma radioimmunotherapy.Theranostics. 2023 Aug 6;13(13):4304-4315. doi: 10.7150/thno.84443. eCollection 2023. Theranostics. 2023. PMID: 37649594 Free PMC article.
References
-
- French J. D., Nat. Rev. Endocrinol. 2020, 16, 629. - PubMed
-
- Doroshow D. B., Bhalla S., Beasley M. B., Sholl L. M., Kerr K. M., Gnjatic S., Wistuba I. I., Rimm D. L., Tsao M. S., Hirsch F. R., Nat. Rev. Clin. Oncol. 2021, 18, 345. - PubMed
-
- Hou A. J., Chen L. C., Chen Y. Y., Nat. Rev. Drug Discovery 2021, 20, 531. - PubMed
Publication types
MeSH terms
Substances
Grants and funding
- R35 GM143014/GM/NIGMS NIH HHS/United States
- R21 NS114455/NS/NINDS NIH HHS/United States
- R01AI168684/GF/NIH HHS/United States
- METAvivor Early Career Investigator Award
- 81922052/National Natural Science Foundation of China
- 2020A1515110811/Guangdong Basic and Applied Basic Research Foundation
- 52103199/National Natural Science Foundation of China
- BC210931/P1/DoD CDMRP Breast Cancer Breakthrough Award Level II
- 2019B151502011/Natural Science Foundation of Guangdong, China
- 5 P30 NS047463/NINDS Center Core
- UL1TR002649/GF/NIH HHS/United States
- P30 CA016059/GF/NIH HHS/United States
- UL1TR002649/VCU C. Kenneth and Dianne Wright Center for Clinical and Translational Research
- R01 CA266981/CA/NCI NIH HHS/United States
- KL2 TR002648/TR/NCATS NIH HHS/United States
- UL1 TR002649/TR/NCATS NIH HHS/United States
- 82102203/National Natural Science Foundation of China
- 81974435/National Natural Science Foundation of China
- 5 P30 NS047463/GF/NIH HHS/United States
- KL2TR002648/GF/NIH HHS/United States
- P30 NS047463/NS/NINDS NIH HHS/United States
- R01 AI168684/AI/NIAID NIH HHS/United States
- R21NS114455/GF/NIH HHS/United States
- P30 CA016059/CA/NCI NIH HHS/United States
- R35GM143014/GF/NIH HHS/United States
LinkOut - more resources
Full Text Sources
Medical
Research Materials
Miscellaneous