. 2022 Sep;92(3):464-475.
doi: 10.1002/ana.26444. Epub 2022 Jul 7.

Decreased Frontal Gamma Activity in Alzheimer Disease Patients

Affiliations

Decreased Frontal Gamma Activity in Alzheimer Disease Patients

Elias P Casula et al. Ann Neurol. 2022 Sep.

Abstract

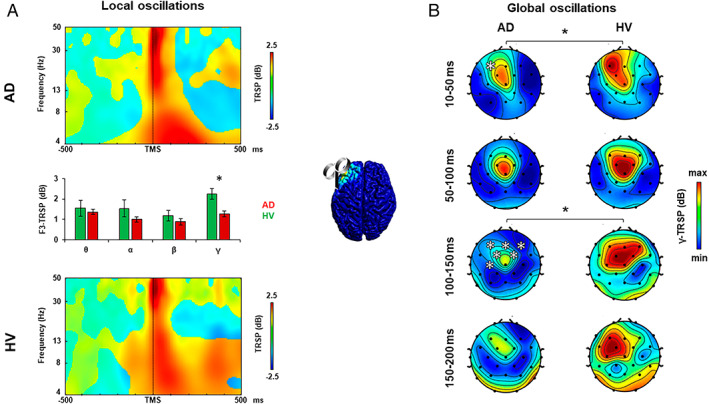
Objective: In Alzheimer disease (AD) animal models, synaptic dysfunction has recently been linked to a disorder of high-frequency neuronal activity. In patients, a clear relation between AD and oscillatory activity remains elusive. Here, we attempt to shed light on this relation by using a novel approach combining transcranial magnetic stimulation and electroencephalography (TMS-EEG) to probe oscillatory activity in specific hubs of the frontoparietal network in a sample of 60 mild-to-moderate AD patients.

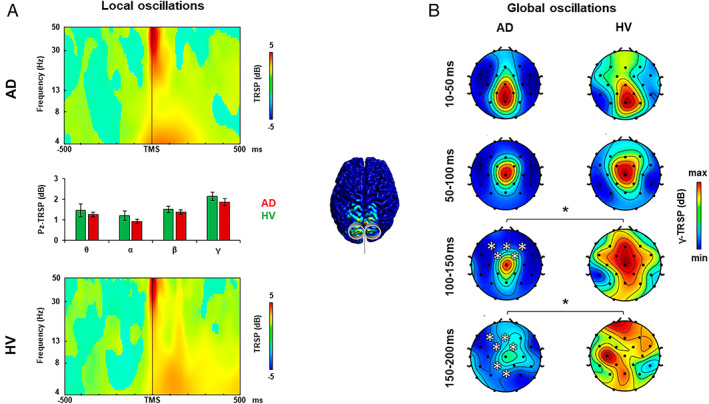
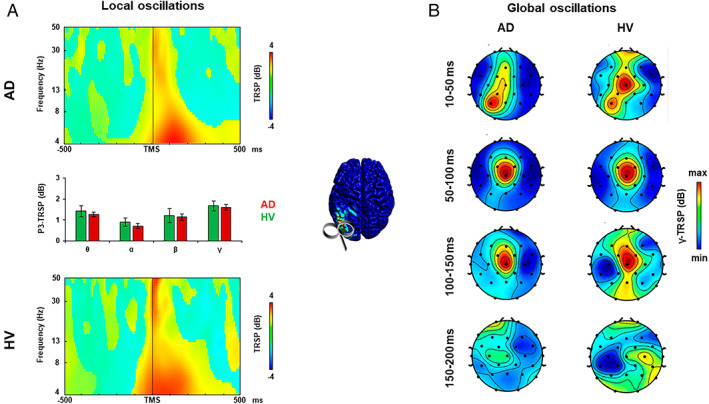
Methods: Sixty mild-to-moderate AD patients and 21 age-matched healthy volunteers (HVs) underwent 3 TMS-EEG sessions to assess cortical oscillations over the left dorsolateral prefrontal cortex, the precuneus, and the left posterior parietal cortex. To investigate the relations between oscillatory activity, cortical plasticity, and cognitive decline, AD patients underwent a TMS-based neurophysiological characterization and a cognitive evaluation at baseline. The latter was repeated after 24 weeks to monitor clinical evolution.

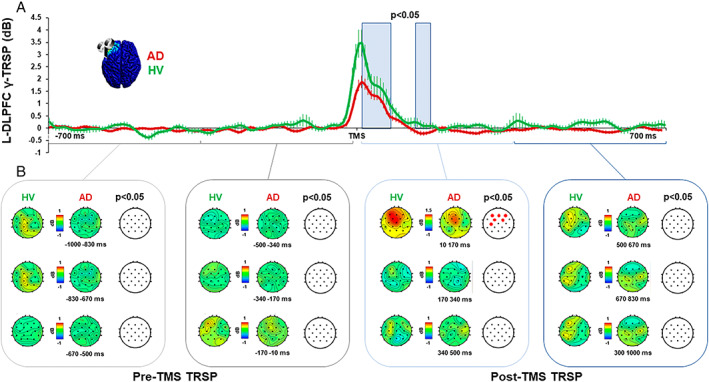
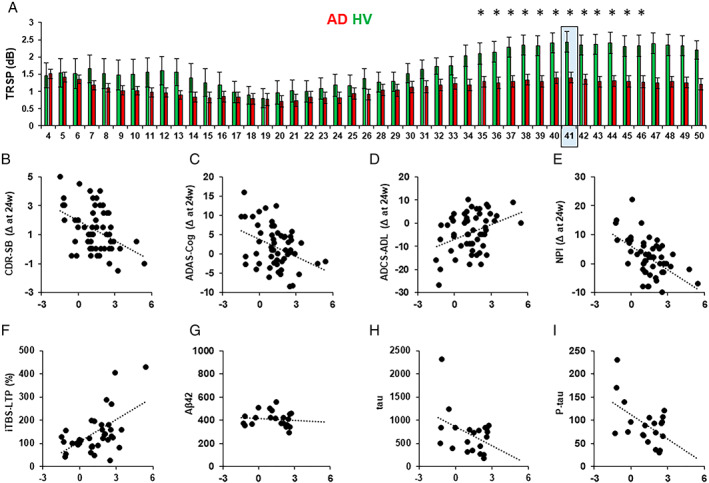
Results: AD patients showed a significant reduction of frontal gamma activity as compared to age-matched HVs. In addition, AD patients with a more prominent decrease of frontal gamma activity showed a stronger impairment of long-term potentiation-like plasticity and a more pronounced cognitive decline at subsequent follow-up evaluation at 24 weeks.

Interpretation: Our data provide novel evidence that frontal lobe gamma activity is dampened in AD patients. The current results point to the TMS-EEG approach as a promising technique to measure individual frontal gamma activity in patients with AD. This index could represent a useful biomarker to predict disease progression and to evaluate response to novel pharmacological therapies. ANN NEUROL 2022;92:464-475.


Conflict of interest statement

GK and AM hold patents submitted on precision meuromodulation in patients with Alzheimer's disease partially including the methodology described in the current work.

Figures

FIGURE 1
FIGURE 1
Oscillatory activity analysis after left dorsolateral prefrontal cortex transcranial magnetic stimulation (TMS). (A) TMS‐related spectral perturbation (TRSP) recorded over the left dorsolateral prefrontal cortex (l‐DLPFC) in the Alzheimer disease (AD) group (upper plot, red bars) and in the healthy volunteer (HV) group (lower plot, green bars). (B) TRSP with scalp maps of gamma activity recorded over all the scalp after stimulation of the l‐DLPFC in the AD group (left maps) and in the HV group (right maps). Error bars indicate standard error. *p < 0.05. [Color figure can be viewed at www.annalsofneurology.org]
FIGURE 2
FIGURE 2
Oscillatory activity analysis after precuneus transcranial magnetic stimulation (TMS). (A) TMS‐related spectral perturbation (TRSP) recorded over the precuneus (PC) in the Alzheimer disease (AD) group (upper plot, red bars) and in the healthy volunteer (HV) group (lower plot, green bars). (B) TRSP with scalp maps of gamma activity recorded over all the scalp after stimulation of the PC in the AD group (left maps) and in the HV group (right maps). Error bars indicate standard error. *p < 0.05. [Color figure can be viewed at www.annalsofneurology.org]
FIGURE 3
FIGURE 3
Oscillatory activity analysis after left posterior parietal cortex transcranial magnetic stimulation (TMS). (A) TMS‐related spectral perturbation (TRSP) recorded over the left posterior parietal cortex (l‐PPC) in the Alzheimer disease (AD) group (upper plot, red bars) and in the healthy volunteer (HV) group (lower plot, green bars). (B) TRSP with scalp maps of gamma activity recorded over all the scalp after stimulation of the l‐PPC in the AD group (left maps) and in the HV group (right maps). Error bars indicate standard error. [Color figure can be viewed at www.annalsofneurology.org]
FIGURE 4
FIGURE 4
Gamma oscillatory activity before and after transcranial magnetic stimulation (TMS) of the left dorsolateral prefrontal cortex (l‐DLPFC). (A) Local gamma activity recorded over the l‐DLPFC in the Alzheimer disease (AD) group (red line) and in the healthy volunteer (HV) group (green line). Blue light squares indicate the time windows in which there is a significant difference between the 2 groups (p < 0.05). (B) Global gamma activity with scalp maps after stimulation of the l‐DLPFC in the AD group (left maps) and in the HV group (right maps). Red dots indicate significant differences between the two groups (p < 0.05). TRSP = TMS‐related spectral perturbation. [Color figure can be viewed at www.annalsofneurology.org]
FIGURE 5
FIGURE 5
Natural frequency analysis. (A) TMS‐related spectral perturbation (TRSP) for each frequency layer after stimulation of the left dorsolateral prefrontal cortex (l‐DLPFC). Red bars depict the TRSP in the Alzheimer disease (AD) group; green bars depict the TRSP in the healthy volunteer (HV) group. Light blue squares indicate the natural frequency. Error bars indicate standard error. *p < 0.05. (B–E) Linear relations between the natural frequency of the l‐DLPFC (l‐DLPFC‐NF) and the clinical scores change after 24 weeks from the first evaluation in the (B) Clinical Dementia Rating Scale Sum of Boxes (CDR‐SB; score range: 0–18, higher scores indicate worsening; r = −0.42, p = 0.001), (C) The Alzheimer's Disease Assessment Scale–Cognitive Subscale (ADAS‐Cog; score range: 0–70, higher scores indicate worsening; r = −0.389, p = 0.003), (D) Alzheimer's Disease Cooperative Study–Activities of Daily Living (ADCS‐ADL; score range: 0–78, lower scores indicate worsening; r = −0.365, p = 0.006), (E) Neuropsychiatric Inventory (NPI; score range: 0–144, higher scores indicate worsening; r = −0.414, p = 0.002). (F–I) Linear relations between the natural frequency of the l‐DLPFC and levels of (F) percentage of long‐term potentiation–like plasticity measured with intermittent theta‐burst stimulation (iTBS‐LTP; r = 0.447, p = 0.005), (G) amyloid‐beta (Aβ; r = −0.239, p = 0.148), (H) tau (r = −0.378, p = 0.04), and (I) p‐tau (r = −0.39, p = 0.04). [Color figure can be viewed at www.annalsofneurology.org]

References

    1. Scheff SW, Price DA. Synaptic pathology in Alzheimer's disease: a review of ultrastructural studies. Neurobiol Aging 2003;24:1029–1046. - PubMed
    1. Walsh DM, Selkoe DJ. Deciphering the molecular basis of memory failure in Alzheimer's disease. Neuron 2004;44:181–193. - PubMed
    1. Iaccarino HF, Singer AC, Martorell AJ, et al. Gamma frequency entrainment attenuates amyloid load and modifies microglia. Nature 2016;540:230–235. - PMC - PubMed
    1. Yamamoto J, Suh J, Takeuchi D, Tonegawa S. Successful execution of working memory linked to synchronized high‐frequency gamma oscillations. Cell 2014;157:845–857. - PubMed
    1. Ribary U, Ioannides AA, Singh KD, et al. Magnetic field tomography of coherent thalamocortical 40‐Hz oscillations in humans. Proc Natl Acad Sci U S A 1991;88:11037–11041. - PMC - PubMed

Publication types