. 2022 Jun 17:11:e71478.
doi: 10.7554/eLife.71478.

Cre/ lox regulated conditional rescue and inactivation with zebrafish UFlip alleles generated by CRISPR-Cas9 targeted integration

Affiliations

Cre/ lox regulated conditional rescue and inactivation with zebrafish UFlip alleles generated by CRISPR-Cas9 targeted integration

Fang Liu et al. Elife. .

Abstract

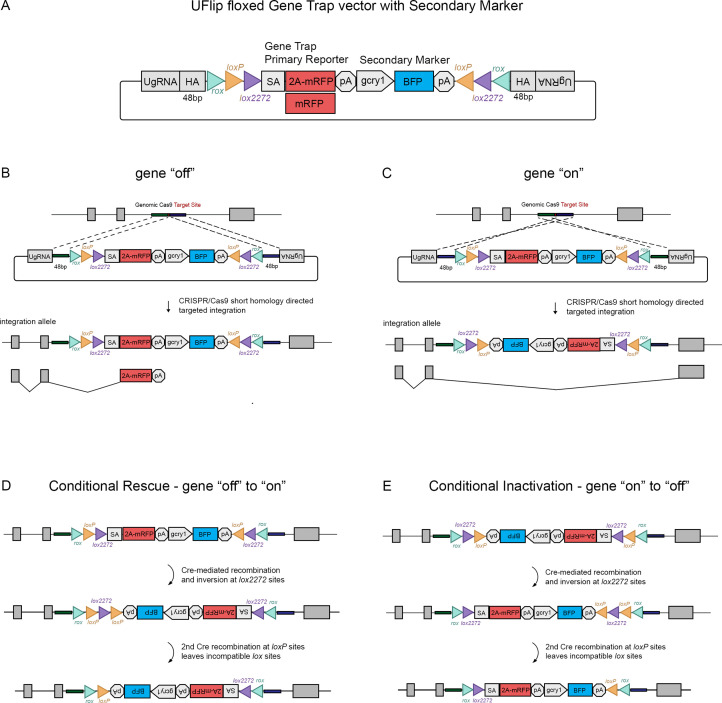
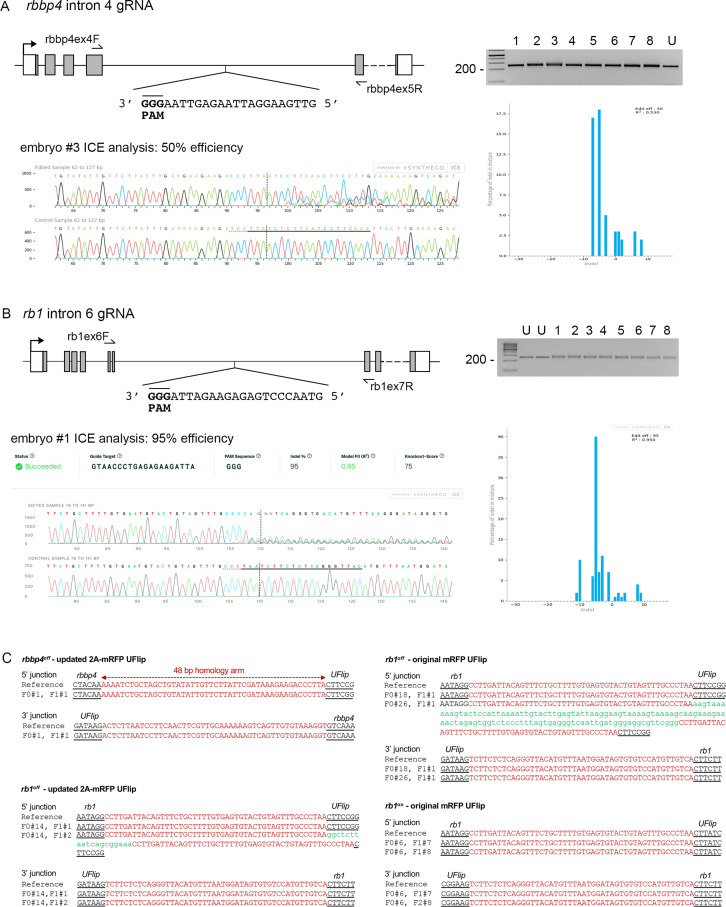
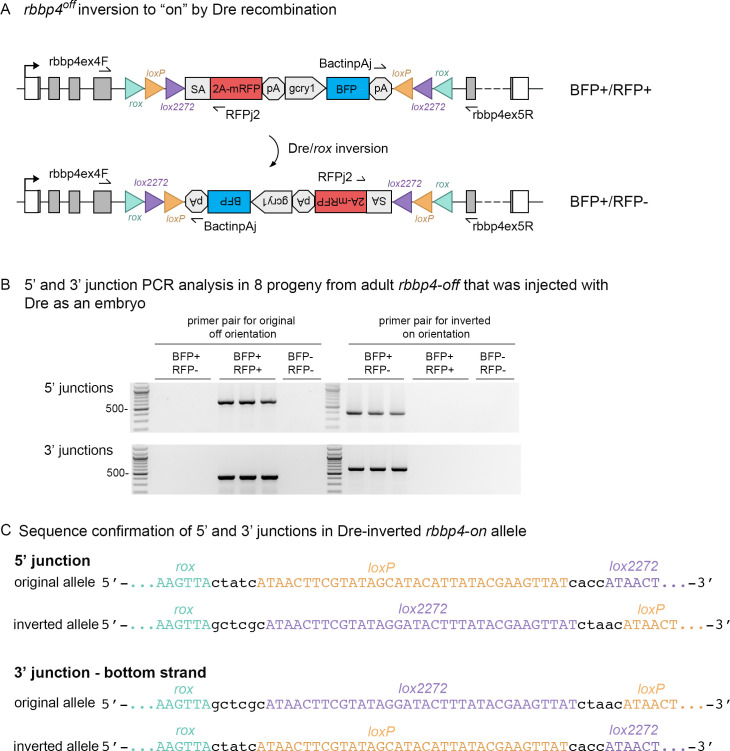
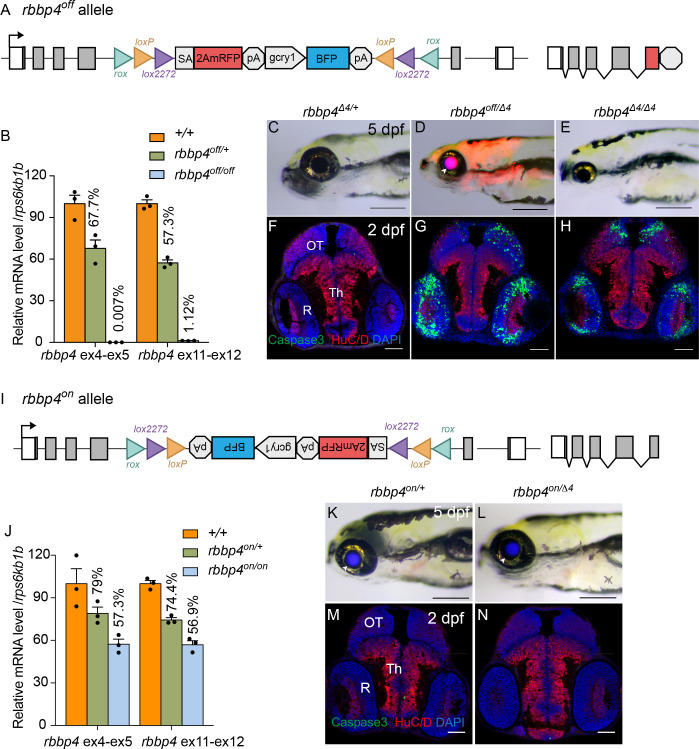
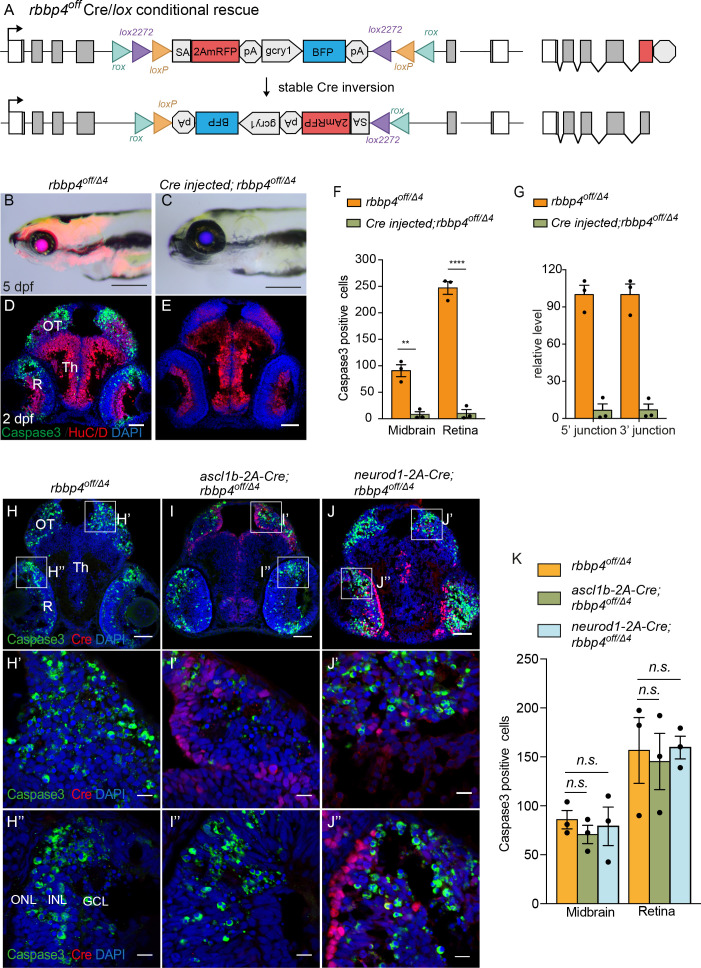
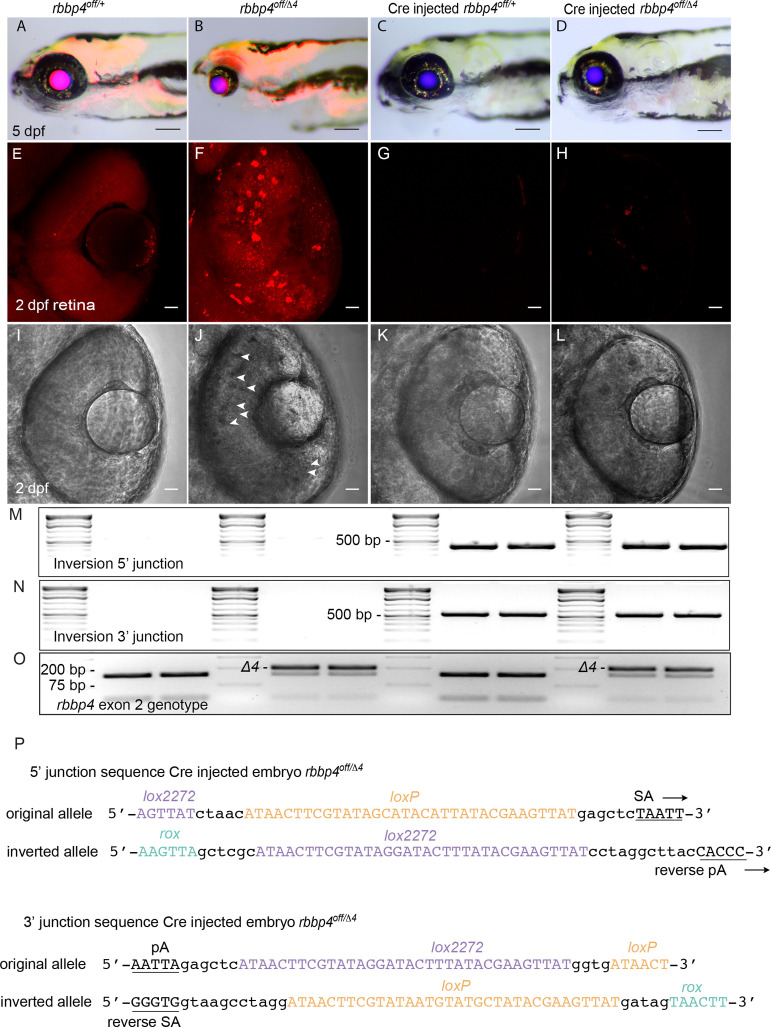
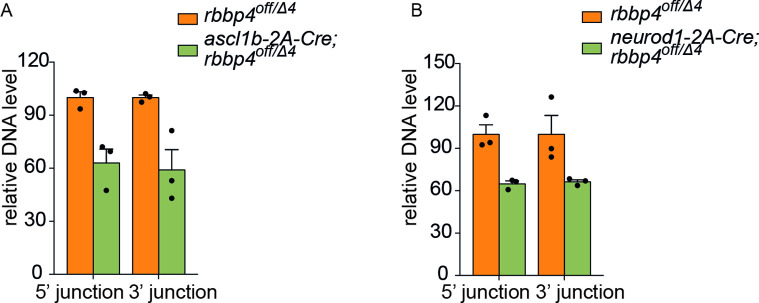
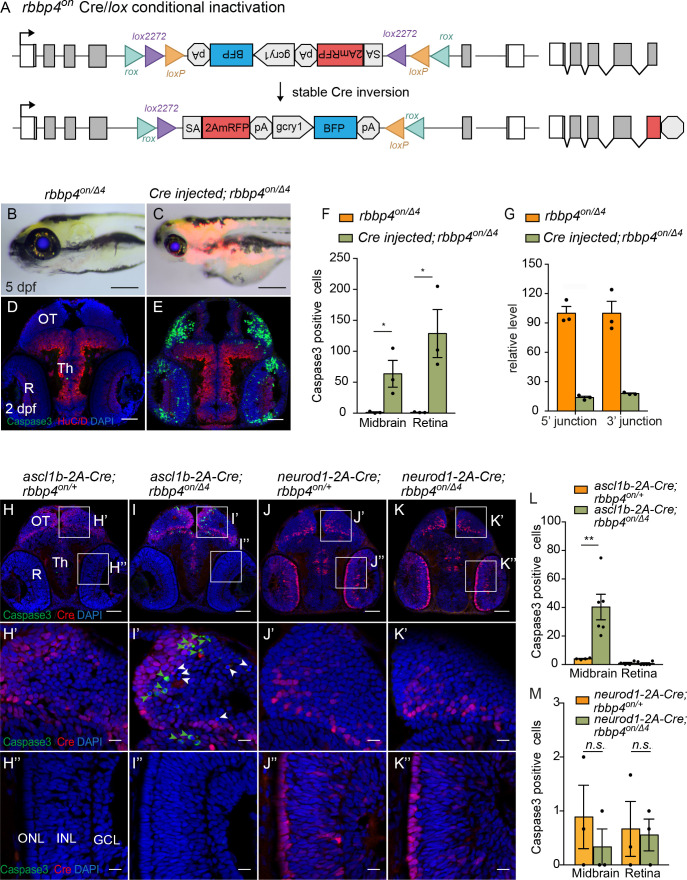
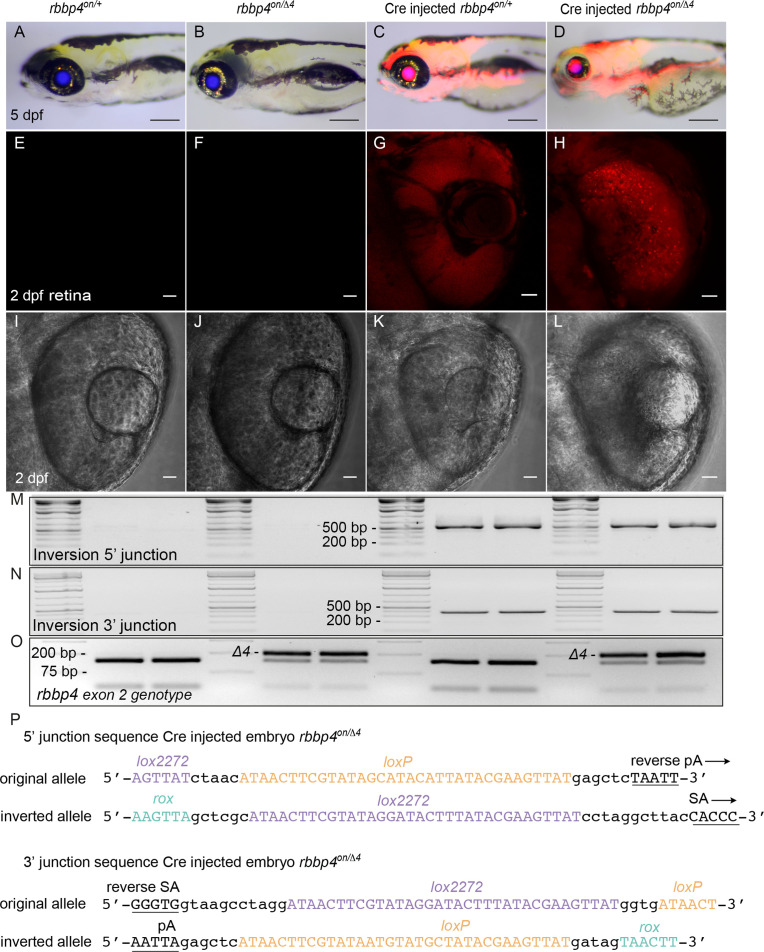
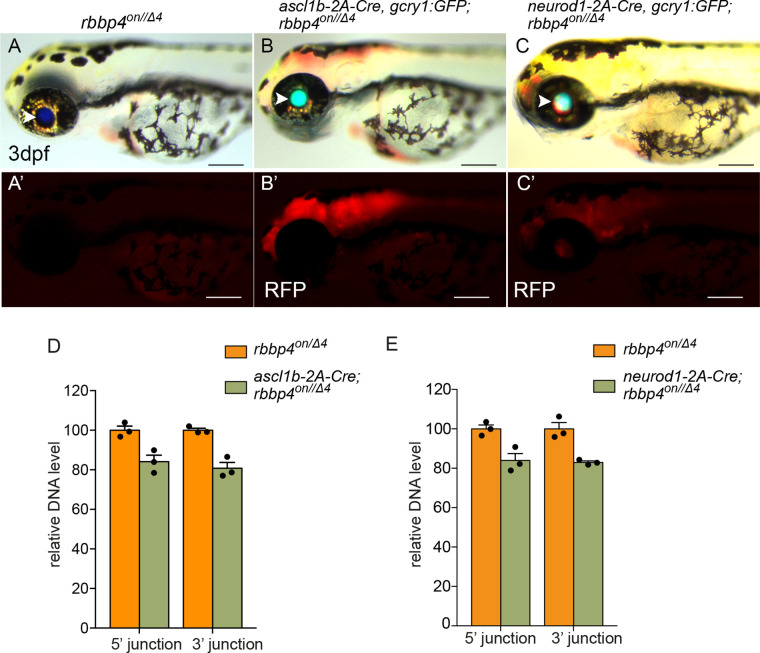
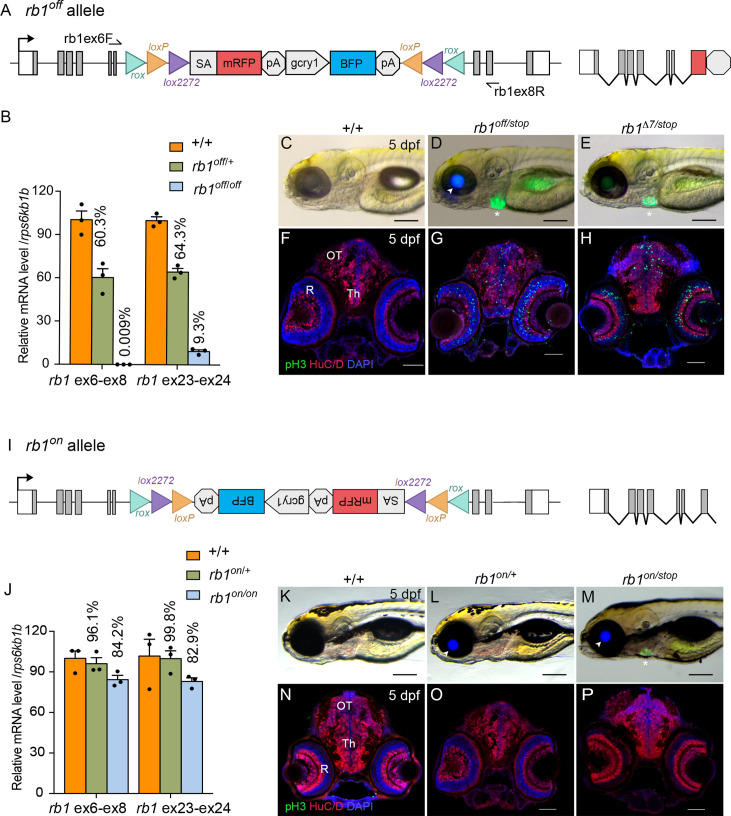
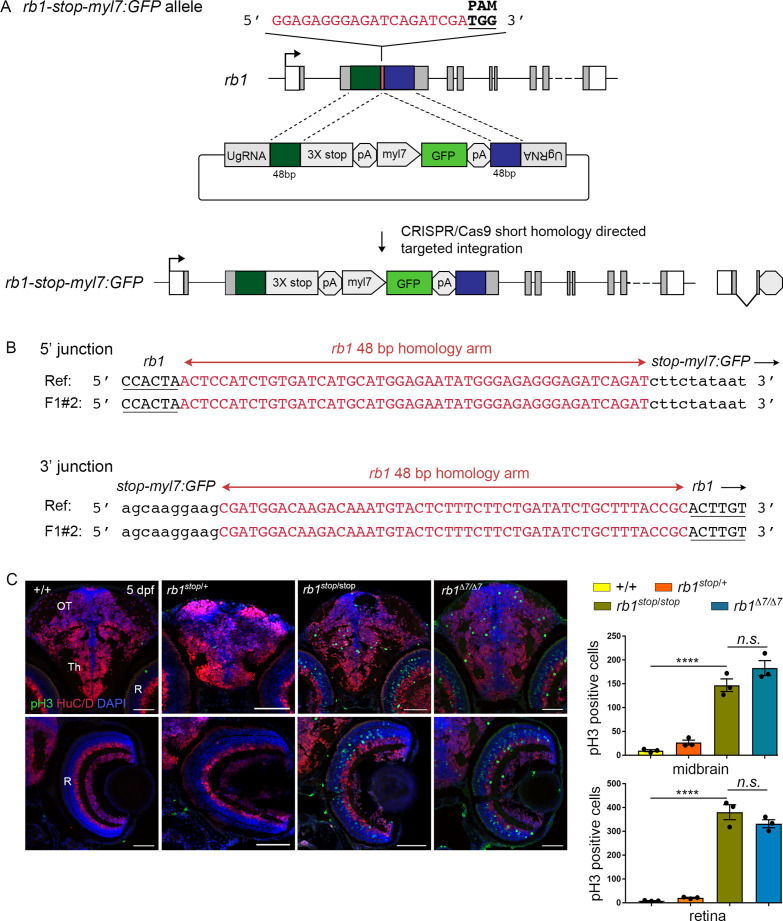
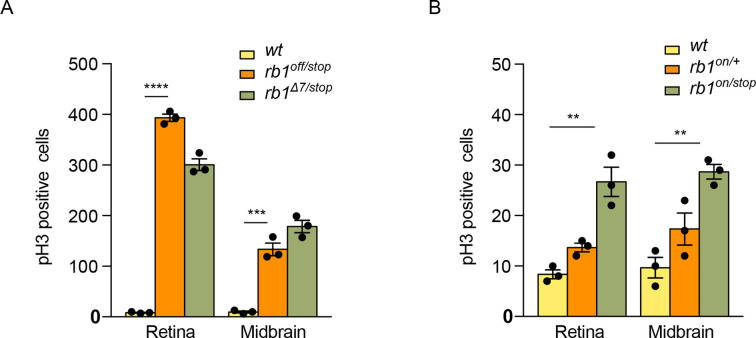
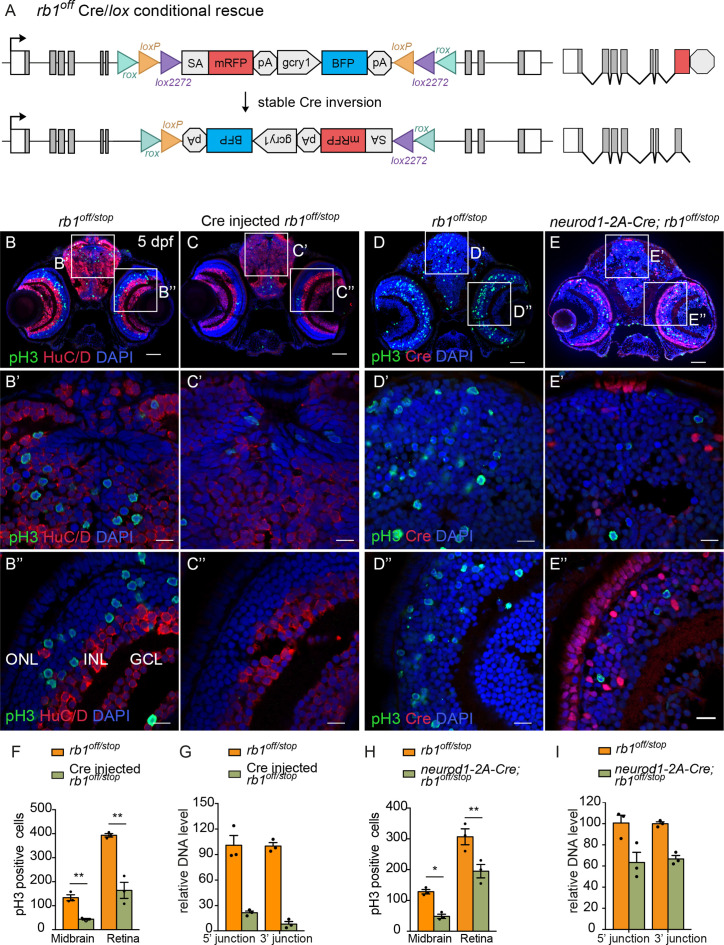
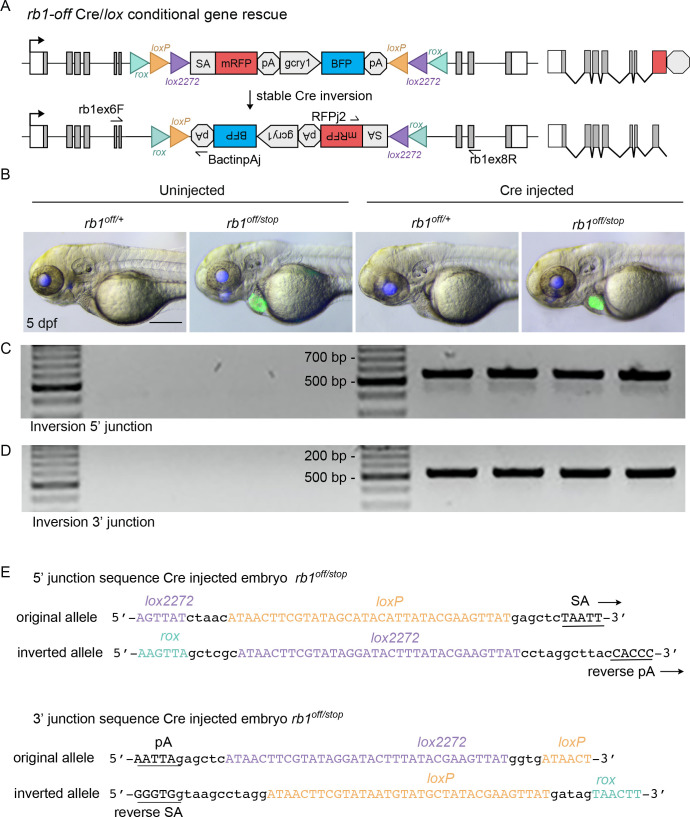
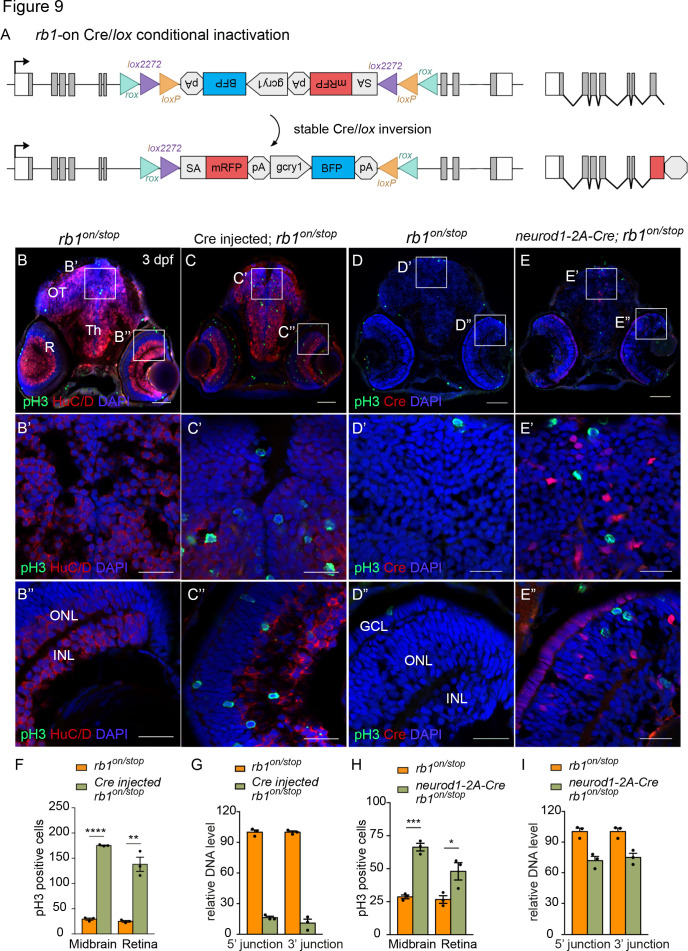
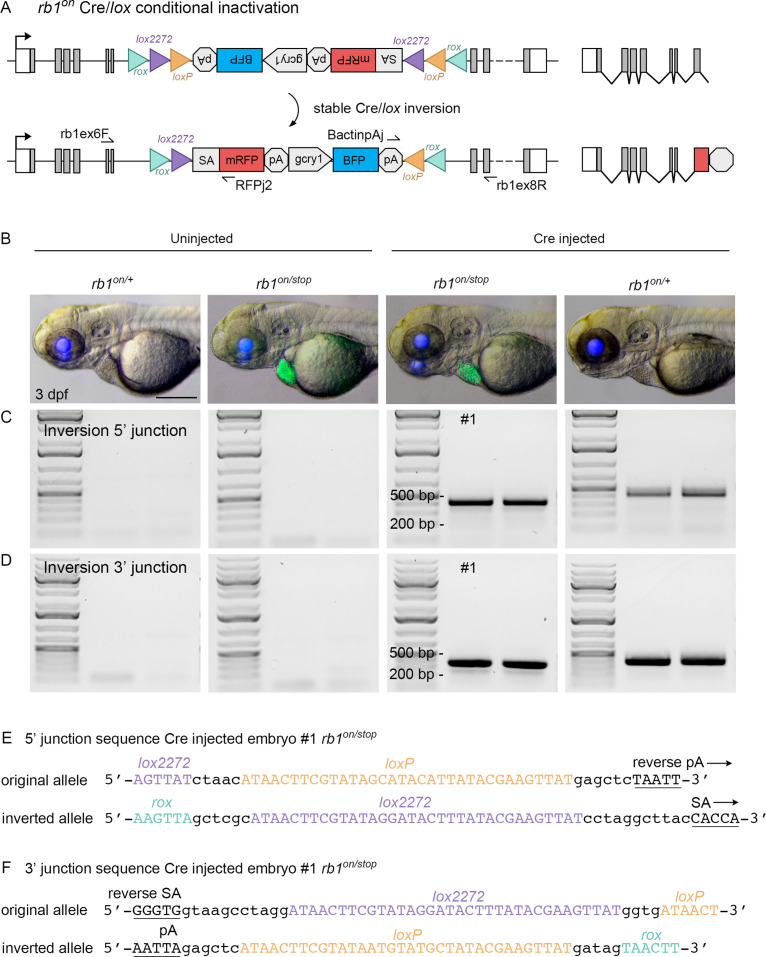
The ability to regulate gene activity spatially and temporally is essential to investigate cell-type-specific gene function during development and in postembryonic processes and disease models. The Cre/lox system has been widely used for performing cell and tissue-specific conditional analysis of gene function in zebrafish. However, simple and efficient methods for isolation of stable, Cre/lox regulated zebrafish alleles are lacking. Here, we applied our GeneWeld CRISPR-Cas9 targeted integration strategy to generate floxed alleles that provide robust conditional inactivation and rescue. A universal targeting vector, UFlip, with sites for cloning short homology arms flanking a floxed 2A-mRFP gene trap, was integrated into an intron in rbbp4 and rb1. rbbp4off and rb1off integration alleles resulted in strong mRFP expression,>99% reduction of endogenous gene expression, and recapitulated known indel loss-of-function phenotypes. Introduction of Cre led to stable inversion of the floxed cassette, loss of mRFP expression, and phenotypic rescue. rbbp4on and rb1on integration alleles did not cause phenotypes in combination with a loss-of-function mutation. Addition of Cre led to conditional inactivation by stable inversion of the cassette, gene trapping and mRFP expression, and the expected mutant phenotype. Neural progenitor Cre drivers were used for conditional inactivation and phenotypic rescue to showcase how this approach can be used in specific cell populations. Together these results validate a simplified approach for efficient isolation of Cre/lox-responsive conditional alleles in zebrafish. Our strategy provides a new toolkit for generating genetic mosaics and represents a significant advance in zebrafish genetics.

Keywords: CRISPR-Cas9; Cre/lox; GeneWeld; conditional rescue and inactivation; developmental biology; genetics; genomics; precision targeted integration; zebrafish.


Conflict of interest statement

FL, SK, MA, ZM, JW, LS No competing interests declared, WW has competing interests with LifEngine and LifEngine Animal Health, SE Reviewing editor, eLife and has competing interests with LifEngine and LifEngine Animal Health, KC has competing interests with Recombinetics Inc, LifEngine and LifEngine Animal Health, JE, MM has competing interests with Recombinetics Inc, Immusoft Inc, LifEngine and LifEngine Animal Health

Figures

Figure 1.
Figure 1.. The UFlip floxed gene trap vector for isolation of conditional gene alleles generated by GeneWeld CRISPR-Cas9 targeted integration.
(A) Diagram of the UFlip. The vector contains a floxed rox loxP lox2272 gene trap plus secondary marker loxP lox2272 rox cassette. The cassette is flanked by cloning sites for homology arms (HA) complementary to a genomic CRISPR target site, and universal gRNA sites (UgRNA) for in vivo liberation of the targeting cassette. (B) Gene ‘off’ alleles are generated by integration of the UFlip cassette into an intron in the active orientation, leading to transcription termination and splicing of the primary transcript in the mRFP gene trap. (C) Gene ‘on” alleles are generated by integration of the UFlip cassette into an intron in the passive orientation. This is driven by cloning the genomic 5’ homology arm downstream of the UFlip cassette, and cloning the genomic 3’ homology arm upstream of the UFlip cassette. Integration at the genomic CRISPR-Cas9 target site occurs in the opposite orientation. During transcription RNA polymerase reads through the integrated UFlip cassette, which is spliced out with the intron during processing of the primary transcript. (D) Cre-mediated recombination at an ‘off’ allele locks the cassette in the ‘on’ orientation. The first recombination occurs stochastically at either lox2272 or loxP sites. The diagram shows the intermediate that forms if the first recombination occurs at the lox2272 sites. (E) Cre-mediated recombination at an ‘on’ allele locks the cassette in the ‘off’ orientation. The first recombination occurs stochastically at either lox2272 or loxP sites. The diagram shows the intermediate that forms if the first recombination occurs at the lox2272 sites. BFP, blue fluorescent protein; gcry1, gamma crystallin 1 promoter; myl7, cardiac myosin light chain 7 promoter; 2 A, porcine teschvirus-1 2A peptide; mRFP, monomeric red fluorescent protein; pA, transcription termination and polyadenylation signal; SA, splice acceptor.
Figure 2.
Figure 2.. rbbp4 and rb1 intronic gRNA efficiency and F1 UFlip allele junction analysis.
(A) rbbp4 gene model with sequence of the intron 4 reverse strand gRNA. Gel image of PCR amplicons surrounding the target site from 8 Cas9 plus gRNA injected and 1 uninjected (U) embryo. Amplicons from embryo #3 and the uninjected embryo were sequenced and analyzed with Synthego’s ICE software, and indicate 50% indel efficiency at the target site. Plot shows the range and percentage of indels present in the sequences. PAM sequence shown in bold and underlined. (B) rb1 gene model with sequence of the intron 6 reverse strand gRNA. Gel image of PCR amplicons surrounding the target site from eight embryos injected with Cas9 and the gRNA (1-8), and two uninjected embryos (U). Amplicons from embryo #1 and an uninjected embryo were sequenced and analyzed with Synthego’s ICE software, and indicate 95% indel efficiency at the target site. Plots show the range and percentage of indels present in the sequences. PAM sequences shown in bold and underlined. (C) 5’ and 3’ genomic-UFlip integration junctions were PCR amplified from F1 transgenic zebrafish fin clip genomic DNA. The PCR products were sequenced and aligned to the reference sequence expected for a precise integration at the genomic target site. Capitalized red nucleotides represent 48 bp homology arms. Lowercase green nucleotides represent random inserted sequences.
Figure 3.
Figure 3.. Dre mRNA injection into rbbp4off/+ embryos leads to inversion of the UFlip cassette and efficient germline recovery of an inverted rbbp4on allele.
(A) Diagram illustrating Dre-mediated inversion of the rbbp4off allele to the on orientation. Repeated inversion of the cassette will continue as long as Dre is present. The final allele is predicted to be in the inverted ‘on’ orientation at a frequency of 50%. (B) PCR junction analysis of 8 embryos from an F1 adult that had been injected with Dre mRNA at the one-cell stage. Three embryos positive for expression of the lens BFP secondary marker show the expected 5’ and 3’ junction PCR amplicons for the inverted rbbp4on allele. (C) Sequence analysis confirms Dre-mediated inversion of the cassette from the ‘off’ to ‘on’ orientation in BRP+/RFP - embryos.
Figure 4.
Figure 4.. Molecular and phenotypic characterization of rbbp4off and rbbp4on alleles.
(A) Diagram of the rbbp4off allele. (B) Plot of RT-qPCR results from wild type +/+ (n=3), heterozygous rbbp4off/+(n=3), and homozygous rbbp4off/off (n=3) larvae showing the relative level of rbbp4 mRNA transcript using reference gene rps6kb1b. Primer pairs were located in exons 4 and 5, or downstream exons 11 and 12. (C – E) Gross phenotype of rbbp4Δ4/+ (C), rbbp4off/Δ4 (D), and rbbp4Δ4/Δ4 (E) 5 dpf larvae. Arrowhead in (D) points to overlap of rbbp4off 2A-mRFP primary reporter and gcry1:BFP secondary reporter expression in the lens, which appears purple. (F – H) Caspase-3 and HuC/D labeling of sectioned head tissue from 2 dpf rbbp4Δ4/+ (F) rbbp4off/Δ4 (G) and rbbp4Δ4/Δ4 (H) embryos. (I) Diagram of the rbbp4on allele. (J) Plot of RT-qPCR results from wild type +/+ (n=3), heterozygous rbbp4on/+ (n=3), and homozygous rbbp4on/on (n=3) larvae showing the relative level of rbbp4 mRNA transcript using reference gene rps6kb1b. Primer pairs were located in exons 4 and 5, or downstream exons 11 and 12. (K, L) Gross phenotype of rbbp4on/+ (K) and rbbp4on/Δ4 (L) 5 dpf larvae. The rbbp4on allele secondary marker gcry1:BFP expression is visible in the lens. Caspase-3 and HuC/D labeling of sectioned head tissue from 2 dpf rbbp4Δ4/+ (M) and rbbp4off/Δ4 (N) embryos. OT, optic tectum; R, retina; Th, thalamic region. Error bars represent mean ± s.e.m. Scale bars: 200 μm (C–E, K, L), 50 μm (F–H, M,N).
Figure 4—figure supplement 1.
Figure 4—figure supplement 1.. Quantification of activated caspase-3a labeled cells in rbbp4Δ4/+, rbbp4off/Δ4, and rbbp4Δ4/Δ 2 dpf embryo midbrain and retina.
Plot of quantification of caspase-3a labeled cells in rbbp4Δ4/+ (n=3), rbbp4off/Δ4 (n=4), and rbbp4Δ4/Δ4 (n=4). rbbp4off/Δ4 vs. rbbp4Δ4/+ midbrain (** p<0.01) and retina (** p<0.01). rbbp4off/Δ4 vs. rbbp4Δ4/Δ4 midbrain (n.s. p=0.6865) and retina (n.s. p=0.6778). Error bars represent mean ± s.e.m. with two-tailed t-test.
Figure 5.
Figure 5.. Ubiquitous and cell-type specific Cre-mediated conditional rescue with rbbp4-off.
(A) Diagram of expected Cre mediated inversion of rbbp4off to on orientation. (B) Gross morphological phenotype of microcephaly and microphthalmia in 5 dpf transheterozygous rbbp4off/Δlarva. (C) Cre injected 5 dpf transheterozygous rbbp4off/Δ4larva shows rescue of gross phenotype and loss of mRFP expression. (D) Activated caspase-3a labeling throughout midbrain and retina section from 2 dpf transheterozygous rbbp4off/Δ4embryo. (E) Absence of activated caspase-3a labeling in midbrain and retina of 2 dpf transheterozygous rbbp4off/Δ4embryo after Cre injection. (F) Quantification of caspase-3a labeling in control rbbp4off/Δ4(n=3) and Cre injected rbbp4off/Δ4 (n=3) midbrain (** p<0.01) and retina (**** p<0.0001). (G) Genomic DNA qPCR quantification of rbbp4off original orientation 5’ and 3 junctions in control rbbp4off/Δ4 (n=3) and Cre injected rbbp4off/Δ4 (n=3). Cre injection reduced the level of rbbp4off original orientation 5’ (>93%) and 3’ junctions (>93%). (H – J”) Activated caspase-3A and Cre labeling in sectioned head tissue from 2 dpf rbbp4off/Δ4 (H-H"), ascl1b-2A-Cre; rbbp4off/Δ4 (I-I"), and neurod1-2A-Cre; rbbp4off/Δ4 (J-J") embryos. (K) Quantification of caspase-3a labeling in rbbp4off/Δ4(n=3), ascl1b-2A-Cre; rbbp4off/Δ4 (n=3) and neurod1-2A-Cre; rbbp4off/Δ4 (n=3).rbbp4off/Δ4vs. ascl1b-2A-Cre; rbbp4off/Δ4 midbrain (n.s. p=0.3248) and retina (n.s. p=0.8153), and neurod1-2A-Cre; rbbp4off/Δ4 midbrain (n.s. p=0.7794) and retina (n.s. p=0.9365). OT, optic tectum; R, retina; Th, thalamic region. Error bars represent mean ± s.e.m. with two-tailed t-test. Scale bars: 200 μm (B, C), 50 μm (D, E, H – J). 10 μm (H’ – J”).
Figure 5—figure supplement 1.
Figure 5—figure supplement 1.. Live imaging and molecular analysis of rbbp4off conditional rescue by Cre injection.
(A – D) Gross morphology and mRFP expression in uninjected rbbp4off/+ (A) and rbbp4off/Δ4 (B), and Cre injected rbbp4off/+ (C) and rbbp4off/Δ4 (D) 5 dpf larva. Confocal live images of mRPF expression and transmitted light in 2 dpf retina from uninjected rbbp4off/+ (E, I), uninjected rbbp4off/Δ4 (F, J), Cre injected rbbp4off/+ (G, K) and rbbp4off/Δ4 (H, L). (M, N) 5’ and 3’ junctions of the inverted allele detected by genomic DNA PCR. (O) PCR amplicon genotyping of the rbbp4Δ4 exon 2 4 bp deletion allele. (P) Sequence of the 5’ and 3 junction amplicons confirms rbbp4off stable inversion to the on orientation by Cre. Scale bar: 200 μm (A - D). 20 μm (E - L).
Figure 5—figure supplement 2.
Figure 5—figure supplement 2.. qPCR quantification of rbbp4off allele inversion by ascl1b-2A-Cre and neurod1-2A-Cre.
(A) Genomic DNA qPCR quantification of rbbp4off original orientation 5’ and 3 junctions in control rbbp4off/Δ4 (n=3) and in ascl1b-2A-Cre; rbbp4off/Δ4(n=3). (B) Genomic DNA qPCR quantification of rbbp4off original orientation 5’ and 3 junctions in control rbbp4off/Δ4 (n=3) and in neurod1-2A-Cre; rbbp4off/Δ4Δ4(n=3). Error bars represent mean ± s.e.m.
Figure 6.
Figure 6.. Ubiquitous and cell-type specific Cre-mediated conditional inactivation with rbbp4-on.
(A) Diagram of expected Cre-mediated inversion of rbbp4on to “off” orientation. (B) Normal morphological phenotype in 5 dpf transheterozygous rbbp4on/Δ4larva. (C) Induction of microcephaly and microphthalmia and mRFP expression in Cre injected 5 dpf transheterozygous rbbp4on/Δ4larva. (D) Absence of activated caspase-3a labeling in sectioned tissue from 2 dpf uninjected transheterozygous rbbp4on/Δ4embryo. (E) Activated caspase-3a labeling in the midbrain and retina of 2 dpf transheterozygous rbbp4on/Δ4embryo after Cre injection. (F) Quantification of caspase-3a labeling in control rbbp4on/Δ4(n=3) and Cre-injected rbbp4on/Δ4(n=3) midbrain (* p<0.05) and retina (* p<0.05). (G) Genomic DNA qPCR quantification of rbbp4on original orientation 5’ and 3 junctions in control rbbp4on (n=3) and Cre injected rbbp4on/Δ4 (n=3). (H – K”) Activated caspase-3a and Cre labeling in sectioned head tissue from 2 dpf ascl1b-2A-Cre; rbbp4D4/+ (H-H"), ascl1b-2A-Cre; rbbp4on/Δ4 (I-I"), neurod1-2A-Cre; rbbp4Δ4/+ (J-J"), and neurod1-2A-Cre; rbbp4on/Δ4 (K-K"), embryos. Green arrowheads, activated caspase-3a-positive cells. White arrowheads, hypercondensed and fragmented nuclei. (L) Quantification of caspase-3a labeling in ascl1b-2A-Cre; rbbp4on/+ (n=4) and ascl1b-2A-Cre; rbbp4on/Δ4 (n=6) midbrain (** p<0.01) and retina (n.s. p=0.8543). (M) Quantification of caspase-3a labeling in neurod1-2A-Cre; rbbp4on/+ (n=3) and neurod1-2A-Cre; rbbp4on/Δ4 (n=3) midbrain (n.s. p=0.3739) and retina (n.s. p=0.6433). OT, optic tectum; R, retina; Th, thalamic region. Error bars represent mean ± s.e.m. with two-tailed t-test. Scale bars: 200 μm (B, C), 50 μm (D, E, H – K). 10 μm (H’ – K”).
Figure 6—figure supplement 1.
Figure 6—figure supplement 1.. Live imaging and molecular analysis of rbbp4on conditional inactivation by Cre injection.
(A – D) Gross morphology and mRFP expression in uninjected rbbp4on/+ (A) and rbbp4on/Δ4 (B), and Cre injected rbbp4on/+ (C) and rbbp4on/Δ4 (D) 5 dpf larva. Confocal live images of mRPF expression and transmitted light in 2 dpf retina from uninjected rbbp4on/+ (E, I), uninjected rbbp4on/Δ4 (F, J), Cre injected rbbp4on/+ (G, K) and rbbp4on/Δ4 (H, L). (M, N) 5’ and 3’ junctions of the inverted allele detected by genomic DNA PCR. (O) PCR amplicon genotyping of the rbbp4Δ4 exon 2 4 bp deletion allele. (P) Sequence of the 5’ and 3 junction amplicons confirms rbbp4on stable inversion to the ‘off’ orientation by Cre.
Figure 6—figure supplement 2.
Figure 6—figure supplement 2.. Induction of primary reporter RFP expression and qPCR quantification of rbbp4on allele inversion by ascl1b-2A-Cre and neurod1-2A-Cre.
Bright field and mRFP fluorescence images of rbbp4on/Δ4 (A, A’), ascl1b-2A-Cre; rbbp4on/Δ4 (B, B’), and neurod1-2A-Cre; rbbp4on/Δ4 (C, C’). White arrowheads point to blue lens expression from the rbbp4on allele and lens GFP expression from the 2A-Cre drivers. (D) Genomic DNA qPCR quantification of rbbp4on original orientation 5’ and 3 junctions in control rbbp4on (n=3) and ascl1b-2A-Cre; rbbp4on/Δ4 (n=3). (E) Genomic DNA qPCR quantification of rbbp4on original orientation 5’ and 3 junctions in control rbbp4on (n=3) and neurod1-2A-Cre; rbbp4on/Δ4 (n=3). Error bars represent mean ± s.e.m. Scale bars: 200 μm.
Figure 7.
Figure 7.. Molecular and phenotypic characterization of rb1off and rb1on alleles.
(A) Diagram of the rb1off allele. (B) Plot of RT-qPCR results from wild type +/+ (n=3), heterozygous rb1off/+ (n=3), and homozygous rb1off/off (n=3) larvae showing the relative level of rb1 mRNA transcript using reference gene rps6kb1b. Primer pairs were located in exons 6 and 8, or downstream exons 23 and 24. (C – E) Gross phenotype of wildtype +/+ (C), rb1off/stop (D), and rb1Δ7/stop (E) 5 dpf larvae. Arrowhead in D points to rb1off allele gcry1:BFP secondary reporter expression in lens. Asterisk marks the rb1stop allele mly7:GFP secondary reporter expression in heart. (F – H) pH3 and HuC/D labeling of sectioned head tissue from 5 dpf +/+ (F), rb1off/stop (G), and rb1Δ7/stop (H). (I) Diagram of the rb1on allele. (J) Plot of RT-qPCR results from wild type +/+ (n=3), heterozygous rb1on/+ (n=3), and homozygous rb1on/on (n=3) larvae showing the relative level of rb1 mRNA transcript using reference gene rps6kb1b. Primer pairs were located in exons 6 and 8, or downstream exons 23 and 24. (K, L) Gross phenotype of wildtype +/+ (K), heterozygous rb1on/+ (L) and transheterozygous rb1on/stop (M) 5 dpf larvae. Arrowhead in L, M points to rb1off allele gcry1:BFP secondary reporter expression in lens. Asterisk in M marks the rb1stop allele mly7:GFP secondary reporter expression in heart. pH3 and HuC/D labeling of sectioned head tissue from 5 dpf +/+ (N), heterozygous rb1on/+ (O) and transheterozygous rb1on/stop (P).OT, optic tectum; R, retina; Th, thalamic region. Error bars represent mean ± s.e.m. Scale bars: 200 μm (C–E, K–M), 50 μm (F–H, N–P).
Figure 7—figure supplement 1.
Figure 7—figure supplement 1.. The rb1-stop integration allele recapitulates the rb1Δ7 indel loss-of-function phenotype.
(A) Diagram of rb1 gene model with exon 2 gRNA, the stop-PRISM-myl7:GFP targeting vector, and the resulting rb1-stop-myl7:GFP allele after GeneWeld CRISPR-Cas9 targeted integration. (B) F1 adult rb1-stop 5’ and 3’ junction analysis shows precise integration of the stop-PRISM cassette at the exon 2 target site. (C) Immunolocalization and quantification of pH3-labeled cells in control +/+ (n=3), rb1stop/+ (n=3), rb1stop/stop (n=3), and rb1Δ7/Δ7 (n=3) 5 dpf sectioned head tissue in the midbrain optic tectum and thalamic region (top row) and retina (bottom row) in both rb1stop/stop and rb1Δ7/Δ7 homozygotes. rb1stop/stop vs. +/+midbrain (**** p<0.0001) and retina (**** p<0.0001), rb1stop/stop vs. rb1Δ7/Δ7 midbrain (n.s. p=0.2951) and retina (n.s. p=0.1534). Th, thalamic region; OT, optic tectum; R, retina. Error bars represent mean ± s.e.m. with two-tailed t-test. Scale bars: 50 μm.
Figure 7—figure supplement 2.
Figure 7—figure supplement 2.. Quantification of pH3 labeled cells in rb1off/stop, rb1Δ7/stop, and rb1off/stop mutant larvae.
(A) Quantification of pH3 labeled cells in 5 dpf wild type +/+ (n=3), transheterozygous rb1off/stop (n=3), and transheterozygous rb1Δ7/stop (n=3) larvae. rb1off/stop larvae show a significant difference in pH3 levels from wildtype in the midbrain (*** p<0.001) and retina (**** p<0.0001). Associated with Figure 5 panels F, G, H. (B) Quantification of pH3-labeled cells in 5 dpf wild type +/+ (n=3), heterozygous rb1on/+(n=3), and transheterozygous rb1on/stop (n=3) larvae. rb1on/stop larvae show a significant difference in pH3 levels from wildtype in the midbrain (** p<0.01) and retina (** p<0.01). Error bars represent mean ± s.e.m. with two-tailed t-test. Associated with Figure 5 panels N, O, P.
Figure 8.
Figure 8.. Ubiquitous and proneural neurod1-specific Cre-mediated conditional rescue with rb1off.
(A) Diagram of expected Cre-mediated inversion of rb1off to on orientation. (B, C) pH3 and HuC/D labeling of larval sectioned head tissue from 5 dpf transheterozygous rb1off/stop (B – B”) and Cre injected rb1off/stop (C – C”). (D, E) pH3 and Cre labeling of larval sectioned head tissue from 5 dpf transheterozygous rb1off/stop (D – D”) and neurod1-2A-Cre; rb1off/stop (E – E”). (F) Quantification of pH3-positive cells in control rb1off/stop (n=3) and Cre injected rb1off/stop (n=3) midbrain (** p<0.01) and retina (** p<0.01). (G) Genomic DNA qPCR quantification of rb1off original orientation DNA 5’ and 3’ junctions in control rb1off/stop (n=3) and Cre injected rb1off/stop (n=3). (H) Quantification of pH3-positive cells in rb1off/stop (n=3) and neurod1-2A-Cre; rb1off/stop (n=3) midbrain (** p<0.01) and retina (* p<0.05). (I) Genomic DNA qPCR quantification of rb1off original orientation DNA 5’ and 3’ junctions in control rb1off (n=3) and neurod1-2A-Cre; rb1off/stop (n=3). Error bars represent mean ± s.e.m. with two-tailed t-test. Scale bars: 50 μm (B - E), 10 μm (B’ – E”).
Figure 8—figure supplement 1.
Figure 8—figure supplement 1.. Molecular analysis of rb1off inversion and conditional rescue by Cre injection.
(A) Diagram of expected Cre-mediated inversion of rb1off to on orientation with primers for junction analysis. (B) Gross morphology in 5 dpf larva uninjected rb1off/+ and rb1off/stop, and Cre injected rb1off/+ and rb1off/stop. (C, D) 5’ and 3’ junctions of the inverted allele detected by genomic DNA PCR. (E) Sequence of the 5’ and 3 junction amplicons confirms rb1off stable inversion to the on orientation by Cre. Scale bar 200 μm (B).
Figure 9.
Figure 9.. Ubiquitous and proneural neurod1-specific Cre-mediated conditional inactivation with rb1-on.
(A) Diagram of expected Cre mediated inversion of rb1on to ‘off’ orientation. (B, C) pH3 and HuC/D labeling of larval sectioned head tissue from 5 dpf transheterozygous rb1on/stop (B – B”) and Cre injected rb1on/stop (C – C”). (D, E) pH3 and Cre labeling of larval sectioned head tissue from 5 dpf transheterozygous rb1on/stop (D – D”) and neurod1-2A-Cre; rb1on/stop (E – E”). (F) Quantification of pH3-positive cells in control rb1on/stop (n=3) and Cre rb1on/stop (n=3) injected midbrain (**** p<0.0001) and retina (** p<0.01). (G) Genomic DNA qPCR quantification of rb1onoriginal orientation DNA 5’ and 3’ junctions in control rb1on/stop (n=3) and Cre injected rb1on/stop (n=3). (H) Quantification of pH3-positive cells in control rb1on/stop (n=3) and neurod1-2A-Cre; rb1on/stop (n=3) midbrain (*** p<0.001) and retina (* p<0.05). (I) Genomic DNA qPCR quantification of rb1on original orientation DNA 5’ and 3’ junctions in control rb1on/stop (n=3) control and neurod1-2A-Cre; rb1on/stop (n=3). Error bars represent mean ± s.e.m. with two-tailed t-test. Scale bars: 50 μm (B - E), 20 μm (B’ – E”).
Figure 9—figure supplement 1.
Figure 9—figure supplement 1.. Molecular analysis of rb1-on inversion and conditional inactivation by Cre injection.
(A) Diagram of expected Cre-mediated inversion of rb1on to “off” orientation with primers for junction analysis. (B) Gross morphology in 5 dpf larva uninjected rbon/+ and rb1on/stop, and Cre injected rb1on/+ and rb1on/stop. (C, D) 5’ and 3’ junctions of the inverted allele detected by genomic DNA PCR. (E) Sequence of the 5’ and 3 junction amplicons confirms rb1on stable inversion to the “off” orientation by Cre. Scale bar 200 μm (B).

References

    1. Almeida MP, Welker JM, Siddiqui S, Luiken J, Ekker SC, Clark KJ, Essner JJ, McGrail M. Endogenous zebrafish proneural Cre drivers generated by CRISPR/Cas9 short homology directed targeted integration. Scientific Reports. 2021;11:1732. doi: 10.1038/s41598-021-81239-y. - DOI - PMC - PubMed
    1. Anastassiadis K, Fu J, Patsch C, Hu S, Weidlich S, Duerschke K, Buchholz F, Edenhofer F, Stewart AF. Dre recombinase, like Cre, is a highly efficient site-specific recombinase in E. coli, mammalian cells and mice. Disease Models & Mechanisms. 2009;2:508–515. doi: 10.1242/dmm.003087. - DOI - PubMed
    1. APA Guidelines for ethical conduct in the care and use of animals. Journal of the Experimental Analysis of Behavior. 1986;45:127–132. doi: 10.1901/jeab.1986.45-127. - DOI - PMC - PubMed
    1. Balciunas D, Wangensteen KJ, Wilber A, Bell J, Geurts A, Sivasubbu S, Wang X, Hackett PB, Largaespada DA, McIvor RS, Ekker SC. Harnessing a high cargo-capacity transposon for genetic applications in vertebrates. PLOS Genetics. 2006;2:e169. doi: 10.1371/journal.pgen.0020169. - DOI - PMC - PubMed
    1. Bedell VM, Wang Y, Campbell JM, Poshusta TL, Starker CG, Krug RG, Tan W, Penheiter SG, Ma AC, Leung AYH, Fahrenkrug SC, Carlson DF, Voytas DF, Clark KJ, Essner JJ, Ekker SC. In vivo genome editing using a high-efficiency TALEN system. Nature. 2012;491:114–118. doi: 10.1038/nature11537. - DOI - PMC - PubMed

Publication types