. 2022 Jun 17:11:e71455.
doi: 10.7554/eLife.71455.

Loss of Elp1 disrupts trigeminal ganglion neurodevelopment in a model of familial dysautonomia

Affiliations

Loss of Elp1 disrupts trigeminal ganglion neurodevelopment in a model of familial dysautonomia

Carrie E Leonard et al. Elife. .

Abstract

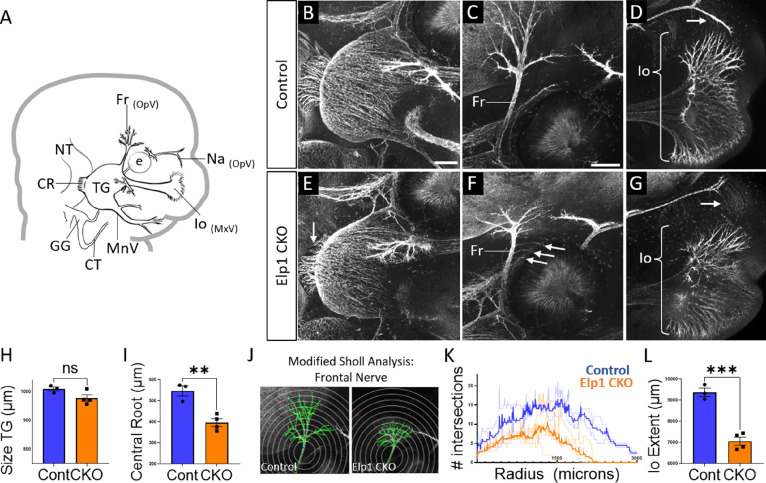
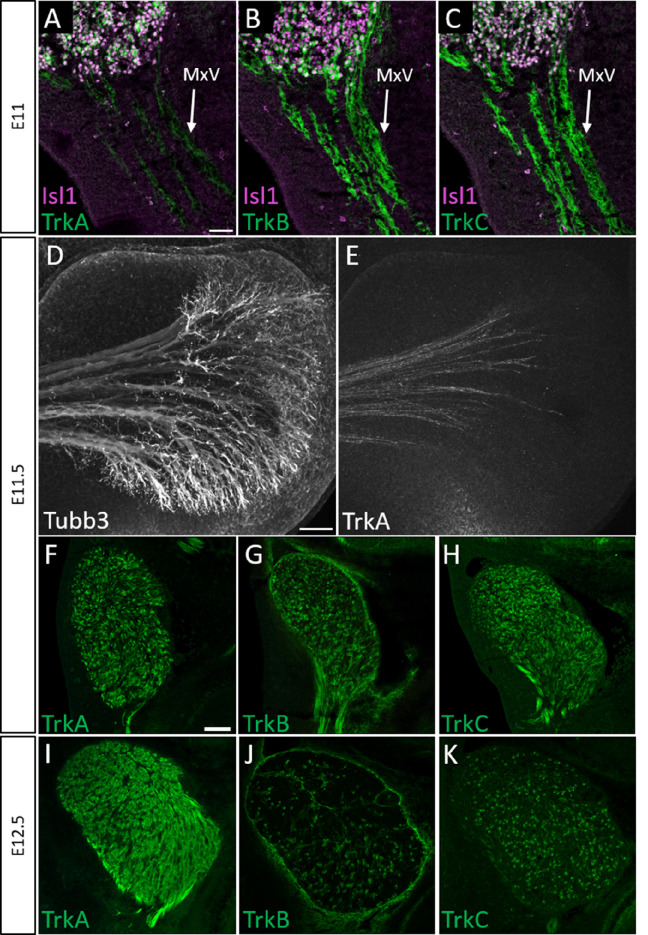
Familial dysautonomia (FD) is a sensory and autonomic neuropathy caused by mutations in elongator complex protein 1 (ELP1). FD patients have small trigeminal nerves and impaired facial pain and temperature perception. These signals are relayed by nociceptive neurons in the trigeminal ganglion, a structure that is composed of both neural crest- and placode-derived cells. Mice lacking Elp1 in neural crest derivatives ('Elp1 CKO') are born with small trigeminal ganglia, suggesting Elp1 is important for trigeminal ganglion development, yet the function of Elp1 in this context is unknown. We demonstrate that Elp1, expressed in both neural crest- and placode-derived neurons, is not required for initial trigeminal ganglion formation. However, Elp1 CKO trigeminal neurons exhibit abnormal axon outgrowth and deficient target innervation. Developing nociceptors expressing the receptor TrkA undergo early apoptosis in Elp1 CKO, while TrkB- and TrkC-expressing neurons are spared, indicating Elp1 supports the target innervation and survival of trigeminal nociceptors. Furthermore, we demonstrate that specific TrkA deficits in the Elp1 CKO trigeminal ganglion reflect the neural crest lineage of most TrkA neurons versus the placodal lineage of most TrkB and TrkC neurons. Altogether, these findings explain defects in cranial gangliogenesis that may lead to loss of facial pain and temperature sensation in FD.

Keywords: developmental biology; familial dysautonomia; mouse; neural crest cells; placode cells; trigeminal ganglion; trigeminal nerves; trks.


Conflict of interest statement

CL, JQ, LT No competing interests declared, FL is the Co-Chair of the Scientific Advisory Board of the Familial Dysautonomia Foundation, Inc

Figures

Figure 1.
Figure 1.. Elp1 protein is enriched in the cytoplasm of developing trigeminal ganglion neurons.
(A) Lateral view of embryonic day 10.5 (E10.5) Elp1LacZ reporter mouse stained for β-galactosidase. Dashed line indicates the plane of section for the same embryo shown in B. (B and C) Representative horizontal section through embryo in A to reveal Elp1 gene expression. Boxed region in B is magnified and shown in C. (D–P) Representative horizontal sections taken from Control E10.5 (D–G), E11.5 (H–M), or E12.5 (N–P) mouse embryos followed by fluorescent immunohistochemistry for Elp1 (D–P, green), Islet1 (D, F, H, K and M, ‘Isl1’, purple), Neuropilin 2 (E, ‘Nrp2’, red), β-tubulin III (I, L, M, ‘Tubb3’, red), and Sox10 (N–P, red). Boxed region in D and E is magnified in F–G and shows Elp1 (green), Isl1 (purple), and DAPI-stained nuclei (blue). (J–M) Higher magnification of box in H and I. (O) Higher magnification of box in N. (P) Higher magnification of box in O. Carets indicate Isl1-positive neuronal nuclei (F, G, J–M) and/or Tubb3-positive neuronal cell bodies (J–M). Arrows identify axons (J, L, M, and P), while arrowheads point to Sox10-positive glial progenitors (P). Abbreviations: e: eye; FN: frontonasal prominence; NT: neural tube; ov: otic vesicle; PA: pharyngeal arch; TG: trigeminal ganglion. Scale bars: 400 µm (A), also applies to B; 50 µm (C), applies to D, E, H, and I; 100 µm (N); 10 µm (F), applies to G; 10 µm (J), applies to K, L, and M; 20 µm (O), applies to P as 5 µm.
Figure 1—figure supplement 1.
Figure 1—figure supplement 1.. Elp1 protein is not enriched in Pax3-positive neural crest cells or glial progenitors in the developing trigeminal ganglion.
(A–H) Fluorescent immunohistochemistry on representative horizontal sections from embryonic day 10.5 (E10.5) (A–D) and E11.5 (E–H) Control mouse embryos demonstrating expression of Elp1 (A–H, green), Isl1 (A–C, E, and G, purple), and Pax3 (B, D, F, and H, red). (C and D) Higher magnification of box in A and B. (G and H) Higher magnification of box in E and F. Carets point to Isl1-positive neuronal nuclei (C, D, G, and H). Arrowheads denote Pax3-positive neural crest cells (C and D) or glial progenitors (G and H), while arrows indicate axons (G and H). Scale bars: 50 µm (A), applies to B, E, and F; 20 µm (C), applies to D, G, and H.
Figure 2.
Figure 2.. Initial trigeminal ganglion formation appears normal in Elp1 CKO at embryonic day 10.5 (E10.5).
(A) Schematic depicting relevant cranial anatomy in E10.5 mouse: CT: chorda tympani nerve; e: eye; GG: geniculate ganglion; MnV: mandibular nerve; MxP: maxillary process; MxV: maxillary nerve; NT: neural tube; OpV: ophthalmic nerve; PA: pharyngeal arch; and TG: trigeminal ganglion. (B and C) Lateral view of trigeminal and geniculate ganglia in Control and Elp1 CKO (Wnt1-Cre+;Elp1flox/flox) littermates after Tubb3 whole-mount immunohistochemistry (white) to label neurons. (D) Quantification of the size of the TG in Control (blue, 885.3 µm, n=3) and Elp1 CKO (orange, 892.7 µm, n=3, p=0.8247, unpaired t-test with Holm-Sidak correction for multiple comparisons). (E) Quantification showing the ratio of Sox10-positive cells to Six1-positive cells in Control (blue, 0.96, n=3) and Elp1 CKO (orange, 0.94, n=3, p=0.8232, nested unpaired t-test adjusted for multiple comparisons). (F) Quantification showing the ratio of Sox10-positive cells to Isl1-positive cells in Control (blue, 1.04, n=3) and Elp1 CKO (orange, 1.13, n=3, p=0.5033). Values for histograms represent mean ± SEM. (G–J) Fluorescent immunohistochemistry on representative horizontal sections through the TG from Control (G and H) or Elp1 CKO (I and J) littermates shows placodal neurons labeled by Isl1 (G and I, blue) or Six1 (H and J, purple) and neural crest cells labeled by Sox10 (G–J, green). Scale bars: 400 µm (B), also applies to C; 20 µm (G), applies to H–J. Refer to Figure 2—source data 1 for quantitative summary data represented in graphs.
Figure 3.
Figure 3.. Progressive trigeminal nerve abnormalities arise in Elp1 CKO starting at embryonic day 11.5 (E11.5).
(A) Schematic depicting relevant cranial anatomy in E11.5 mouse: CR: central root; CT: chorda tympani nerve; e: eye; GG: geniculate ganglion; MnV: mandibular nerve; MxP: maxillary process; MxV: maxillary nerve; NT: neural tube; OpV: ophthalmic nerve; and TG: trigeminal ganglion. (B–G) Representative maximum intensity projections of confocal Z-stacks through Control (B–D) or Elp1 CKO (E–G) littermates, which were processed for whole-mount immunohistochemistry to detect Tubb3 (white), followed by tissue clearing. (C, D, F, and G) Higher magnification of boxes in B and E. Arrows indicate disorganized axons (F and G) in Elp1 CKO. (H) Quantification of the size of the TG in Control (blue, 835.5 µm, n=4) and Elp1 CKO (orange, 834.3 µm, n=3, p=0.9497, unpaired t-test with Holm-Sidak adjustment for multiple comparisons). (I) Quantification of the central root diameter in Control (blue, 405.9 µm, n=4) and Elp1 CKO (orange, 427.7 µm, n=3, p=0.9497, unpaired t-test adjusted for multiple comparisons). Values for histograms represent mean ± SEM. Scale bar: 200 µm (B), applies to E; also applies to C, D, F, and G as 50 µm. Refer to Figure 3—source data 1 for quantitative summary data represented in graphs.
Figure 4.
Figure 4.. Trigeminal nerve branches are less complex or absent in Elp1 CKO at embryonic day 12.5 (E12.5).
(A) Schematic depicting relevant cranial anatomy in E12.5 mouse: CR: central root; CT: chorda tympani nerve; e: eye; Fr: frontal nerve; GG: geniculate ganglion; Io: infraorbital nerve; MnV: mandibular nerve; MxV: maxillary nerve; Na: nasal nerve; NT: neural tube; OpV: ophthalmic nerve; and TG: trigeminal ganglion. (B–G) Representative maximum intensity projections of confocal Z-stacks through Control (B–D) or Elp1 CKO (E–G) littermates, which were processed for whole-mount immunohistochemistry to detect Tubb3 (white), followed by tissue clearing. (C, D, F, and G) Higher magnification images of the frontal nerve (C and F) or the infraorbital nerve at the developing whisker pad (D and G). Arrows indicate small central root (E), disorganized axons (F), and the absence of the nasal nerve (G) in Elp1 CKO. (H) Quantification of the size of the TG in Control (blue, 1010 µm, n=3) and Elp1 CKO (orange, 978.1 µm, n=4, p=0.0828, unpaired t-test with Holm-Sidak adjustment for multiple comparisons). (I) Quantification of the central root diameter in Control (blue, 546.9 µm, n=3) and Elp1 CKO (orange, 396.8 µm, n=4, p=0.0828, unpaired t-test adjusted for multiple comparisons). (J) Diagram explaining modified Sholl analysis, with concentric circles of increasing radii overlayed on representative traces (green) of the frontal nerve in Control (left) or Elp1 CKO (right). (K) Graph of modified Sholl analysis to quantify complexity of frontal nerve. Individual distributions are plotted in light blue (Control, n=2) and light orange (Elp1 CKO, n=4), while group averages are plotted in dark blue (Control) and dark orange (Elp1 CKO). (L) Quantification of the infraorbital nerve extent in Control (blue, 9374 µm, n=3) and Elp1 CKO (orange, 7061 µm, n=4, p=0.0004, unpaired t-test adjusted for multiple comparisons). Values for histograms represent mean ± SEM. Scale bar: 200 µm (B), applies to E; 200 µm (C), applies to D, F, and G. Refer to Figure 4—source data 1 for quantitative summary data represented in graphs.
Figure 5.
Figure 5.. Loss of TrkA neurons with persistent innervation defects in Elp1 CKO at embryonic day 12.5–13 (E12.5–13).
(A–H) Representative maximum intensity projections of confocal Z-stacks through Control (A, B, E, and F) or Elp1 CKO (C, D, G, and H) littermates, which were processed for whole-mount immunohistochemistry to detect Tubb3 (A, C, E, and G, white) and TrkA (B, D, F, and H, white), followed by tissue clearing. Arrows indicate regions where nerves are absent or severely diminished in Elp1 CKO (C and G), while arrowheads point to areas with Tubb3-positive nerves but undetectable TrkA expression (C, D, G, and H). (I–P) Fluorescent immunohistochemistry on serial horizontal sections showing TrkA (I–M and O, green), Tubb3 (J and L, purple), or TrkC (N and P, green) in the trigeminal ganglion (I-L) or whisker pad (M–P) of Control (I, J, M, and N) or Elp1 CKO (K, L, O, and P) littermates. Dashed line in F demonstrates the plane of section for M-P. (Q) Quantification of Trk fluorescent signal normalized to Tubb3 fluorescent signal within the trigeminal ganglia of Control (blue, TrkA = 0.897, TrkB = 0.3258, TrkC = 0.3047, n=3) and Elp1 CKO (orange, TrkA = 0.6014, TrkB = 0.3551, TrkC = 0.2783, n=3, p=0.0037 TrkA, 0.4878 for TrkB, 0.7750 for TrkC, nested unpaired t-test with Holm-Sidak adjustment for multiple comparisons). (R) Quantification of Trk-expressing neurons in trigeminal ganglion sections of Control (blue, TrkA = 416.1, TrkB = 98.35, TrkC = 151.6, n=3) and Elp1 CKO (orange, TrkA = 325.0, TrkB = 99.05, TrkC = 154.8, n=3, p=0.0150 for TrkA, 0.8966 for TrkB, 0.7675 for TrkC, nested unpaired t-test with Holm-Sidak adjustment for multiple comparisons). Values for histograms represent mean ± SEM. Scale bars: 200 µm (A), applies to (B–H); 20 µm (I), applies to (J–L) and applies to (M–P) as 25 µm. Refer to Figure 5—source data 1 for quantitative summary data represented in graphs.
Figure 5—figure supplement 1.
Figure 5—figure supplement 1.. Loss of TrkA neurons is not accompanied by changes in TrkB and TrkC neuron subpopulations in Elp1 CKO.
(A–D) Representative maximum intensity projections of confocal Z-stacks through Control (A and B) or Elp1 CKO (C and D) littermates, which were processed for whole-mount immunohistochemistry to detect Tubb3 (A and C, white) and TrkA (B and D, white), followed by tissue clearing. Arrows point to central root in Elp1 CKO (C and D). (E–L) Fluorescent immunohistochemistry on serial horizontal sections showing TrkB (E–H, green), TrkC (I–L, green), or Tubb3 (F, H, J, L, purple) in the trigeminal ganglion of Control (E, F, I, and J) or Elp1 CKO (G, H, K, and L) littermates. Scale bar: 200 µm (A), applies to (B–D); 20 µm (E), applies to (F–L).
Figure 5—figure supplement 2.
Figure 5—figure supplement 2.. Elp1 expression is retained in TrkB and TrkC neurons in Elp1 CKO.
(A–R) Representative images of fluorescent immunohistochemistry on serial horizontal sections showing TrkA (A, D, C, and F, green), TrkB (G, J, I, and L, green), or TrkC (M, P, Q, and R, green), with Elp1 (B, C, E, F, H, I, K, L, N, O, Q, and R, purple) in the trigeminal ganglion of Control (A–C, G–I, and M–O, n=3) or Elp1 CKO (D–F, J–L, and P–R, n=3) littermates at embryonic day 12.5 (E12.5). Arrowheads point to Elp1-expressing cells in Elp1 CKO (E, F, K, L, Q, and R). Scale bar: 20 µm (A), applies to (B–R).
Figure 6.
Figure 6.. Dynamic expression of Six1 and Trk receptors occurs during trigeminal ganglion neurogenesis.
(A–I) Fluorescent immunohistochemistry on representative horizontal sections at embryonic day 10.5 (E10.5) (A, D and G), E11.5 (B, E and H), and E12.5 (C, F and I) in Control embryos demonstrating expression of TrkA (A–C, green), TrkB (D–F, green), TrkC (G–I, green), and Six1 (A–I, red). Arrowheads point to neurons that co-express Six1 with TrkA (A–C), TrkB (D–F), or TrkC (G–I). (J) Quantification of the percentage of neurons expressing TrkA (purple), TrkB (green), or TrkC (orange) that also co-express Six1 in the Control trigeminal ganglion at E10.5 (n=2), E11.5 (n=3), and E12.5 (n=3). Data points represent mean ± SEM. Scale bars: 20 µm (A), applies to (B–I). Refer to Figure 6—source data 1 for quantitative summary data represented in graphs.
Figure 6—figure supplement 1.
Figure 6—figure supplement 1.. Normal developmental Trk expression dynamics in the trigeminal ganglion and maxillary nerve.
(A–C) Representative images of fluorescent immunohistochemistry on serial horizontal sections showing TrkA (A, green), TrkB (B, green), or TrkC (C, green) with Isl1 (A–C, purple) in Control embryos at embryonic day 11 (E11). Arrows point to the maxillary nerve (MxV). (D and E) Representative maximum intensity projections of confocal Z-stacks through the Control maxillary process at E11.5 after whole-mount immunohistochemistry to detect Tubb3 (D, white) and TrkA (E, white), followed by tissue clearing. (F–K) Representative images of fluorescent immunohistochemistry on serial horizontal sections showing TrkA (F and I, green), TrkB (G and J, green), or TrkC (H and K, green) in Control embryos at E11.5 (F–H) and E12.5 (I–K). Scale bars: 50 µm (A), applies to (B and C); 100 µm (D), applies to (E); 100 µm (F), applies to (G and K).
Figure 7.
Figure 7.. Six1 is first expressed by placodal neurons, followed by neural crest-derived neurons in the trigeminal ganglion.
(A–C, E–G, and I–K) Representative images of fluorescent immunohistochemistry showing Sox10 (B and C, purple) or Six1 (F, G, J, and K, purple) with native green fluorescent protein (GFP) fluorescence in horizontal sections at embryonic day 10.5 (E10.5) (A–C and E–G, n=3) and E12.5 (I–K, n=3) in Wnt1-Cre; ROSAmT/mG reporter embryos. Arrowheads point to neurons that co-express Sox10 (A–C) or Six1 (E–G and I–K) with GFP. (D, H and L) Pie charts demonstrating the percent of Sox10-positive (D) or Six1-positive (H and L) cells that co-express GFP in Wnt1-Cre; ROSAmT/mG trigeminal ganglia at E10.5 (D and H) and E12.5 (L). Scale bars: 20 µm (A), applies to all images. Refer to Figure 7—source data 1 for quantitative summary data represented in graphs.
Figure 8.
Figure 8.. Neural crest-derived trigeminal ganglion neurons are biased to a TrkA fate, while placodal neurons express TrkB or TrkC.
(A–D) Representative images of fluorescent immunohistochemistry at embryonic day (E15.5) showing red fluorescent protein (RFP; B–D) with native green fluorescent protein (GFP) fluorescence indicating Wnt1-Cre-mediated recombination (A, C and D) in horizontal sections through the maxillary lobe of the trigeminal ganglion in Wnt1-Cre; ROSAmT/mG reporters. (D) Higher magnification of box in C. Arrowheads point to RFP-positive, non-recombined neurons. (E–G, I–K, and M–O) Fluorescent immunohistochemistry on serial sections through the maxillary lobe of Wnt1-Cre; ROSAmT-mG reporters (n=3) showing TrkA (E and G, white), TrkB (I and K, white), or TrkC (M and O, white) with RFP (F, G, J, K, N, and O, red). Arrowheads point to neurons that express RFP and TrkA (E–G), TrkB (I–K), or TrkC (M–O). (H, L and P) Quantification of the percentage of neurons expressing TrkA (H), TrkB (L), or TrkC (P) that also co-express RFP at E15.5 (n=3). Scale bars: 100 µm (A), applies to (B–C); 20 µm (D); 10 µm (E), applies to (F, G, I–K, and M–O). Refer to Figure 8—source data 1 for quantitative summary data represented in graphs.
Figure 9.
Figure 9.. Aberrant apoptosis contributes to loss of neural crest-derived TrkA neurons in Elp1 CKO trigeminal ganglia.
(A–H) Fluorescent immunohistochemistry on representative horizontal sections from embryonic day 12.5 (E12.5) Control (A–C) or Elp1 CKO (D–H) littermates revealing expression of TrkA (A, C, D, and F–H, purple) with TUNEL staining (B, C, E, F, and H, green). (G and H) Higher magnification of box in F. Arrowheads point to TrkA neurons that are TUNEL-positive (G and H). (I) Quantification of TUNEL fluorescence in Control (blue, 675 a.u., n=3) and Elp1 CKO (orange, 8248 a.u., n=3, p=0.0052, nested unpaired t-test) trigeminal ganglia at E12.5. Values are mean ± SEM. *p=0.0224, unpaired t-test. a.u.: arbitrary units. Scale bars: 50 µm (A), applies to (B–F); 10 µm (G), applies to (H). Refer to Figure 9—source data 1 for quantitative summary data represented in graphs.
Figure 9—figure supplement 1.
Figure 9—figure supplement 1.. TUNEL staining in glial progenitors and geniculate ganglia at embryonic day 12.5 (E12.5).
(A–D) Fluorescent immunohistochemistry on representative horizontal sections through the trigeminal ganglion in E12.5 Elp1 CKO (n=2) revealing expression of Sox10 (A–D, blue) and BFABP (B and D, purple) with TUNEL staining (A–D, green). (C and D) Higher magnification of box in A and B. (E–H) Fluorescent immunohistochemistry on representative horizontal sections through the geniculate ganglion in E12.5 Control (E and G, n=2) and Elp1 CKO (F and H, n=2) revealing expression of Tubb3 (E–H, purple) with TUNEL staining (E–H, green). (G and H) Higher magnification of box in E and F. Scale bars: 10 µm (A), applies to (B); 5 µm (C), applies to (D); 20 µm (E), applies to (F); 10 µm (G), applies to (H).
Figure 9—figure supplement 2.
Figure 9—figure supplement 2.. Apoptosis in Elp1 CKO is not a result of altered nerve growth factor (NGF) expression in target tissues.
(A–L) Fluorescent immunohistochemistry on representative horizontal sections through the whisker pad (A–F) or upper lip (G–L) of embryonic day 12.5 (E12.5) Control (A–C and G–I, n=3) and Elp1 CKO (D–F and J–L, n=3) littermates, revealing expression of NGF (A, C, D, F, G, I, J, and L, purple) and Tubb3 (B, C, E, F, H, I, K, and L, green). Scale bars: 50 µm (A), applies to (B–L).

Similar articles

Cited by

References

    1. Abashidze A, Gold V, Anavi Y, Greenspan H, Weil M, Yang Y. Involvement of IKAP in Peripheral Target Innervation and in Specific JNK and NGF Signaling in Developing PNS Neurons. PLOS ONE. 2014;9:e113428. doi: 10.1371/journal.pone.0113428. - DOI - PMC - PubMed
    1. Anderson SL, Coli R, Daly IW, Kichula EA, Rork MJ, Volpi SA, Ekstein J, Rubin BY. Familial Dysautonomia Is Caused by Mutations of the IKAP Gene. The American Journal of Human Genetics. 2001;68:753–758. doi: 10.1086/318808. - DOI - PMC - PubMed
    1. Arumäe U, Pirvola U, Palgi J, Kiema T, Palm K, Moshnyakov M, Ylikoski J, Saarma M. Neurotrophins and their receptors in rat peripheral trigeminal system during maxillary nerve growth. Journal of Cell Biology. 1993;122:1053–1065. doi: 10.1083/jcb.122.5.1053. - DOI - PMC - PubMed
    1. Ascano M, Richmond A, Borden P, Kuruvilla R. Axonal Targeting of Trk Receptors via Transcytosis Regulates Sensitivity to Neurotrophin Responses. Journal of Neuroscience. 2009;29:11674–11685. doi: 10.1523/JNEUROSCI.1542-09.2009. - DOI - PMC - PubMed
    1. Baker CVH, Stark MR, Bronner-Fraser M. Pax3-Expressing Trigeminal Placode Cells Can Localize to Trunk Neural Crest Sites but Are Committed to a Cutaneous Sensory Neuron Fate. Developmental Biology. 2002;249:219–236. doi: 10.1006/dbio.2002.0767. - DOI - PubMed

Publication types

Substances