. 2022 Aug;144(2):211-239.
doi: 10.1007/s00401-022-02440-5. Epub 2022 Jun 17.

Dominant-acting CSF1R variants cause microglial depletion and altered astrocytic phenotype in zebrafish and adult-onset leukodystrophy

Affiliations

Dominant-acting CSF1R variants cause microglial depletion and altered astrocytic phenotype in zebrafish and adult-onset leukodystrophy

Woutje M Berdowski et al. Acta Neuropathol. 2022 Aug.

Abstract

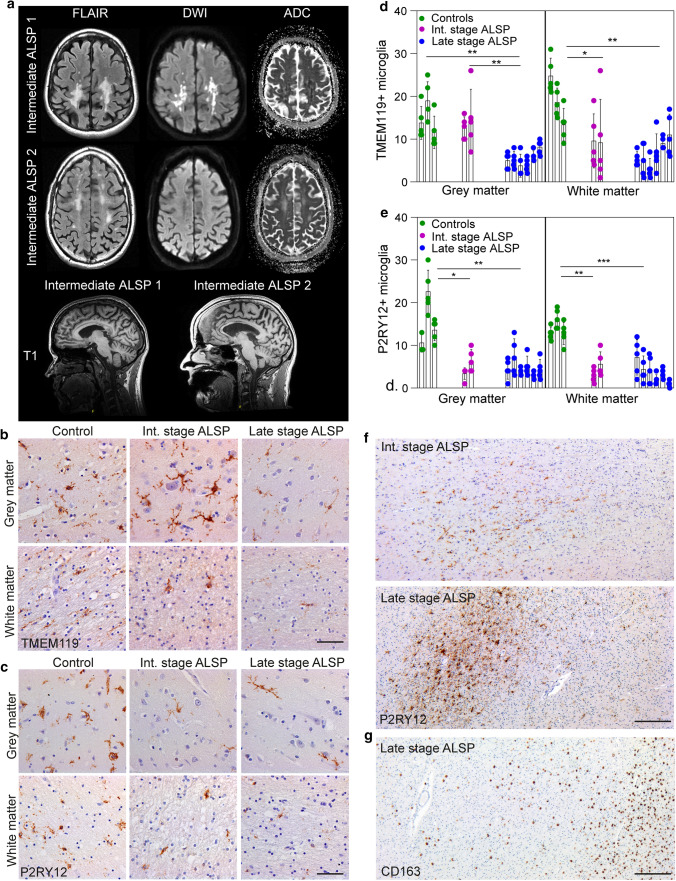
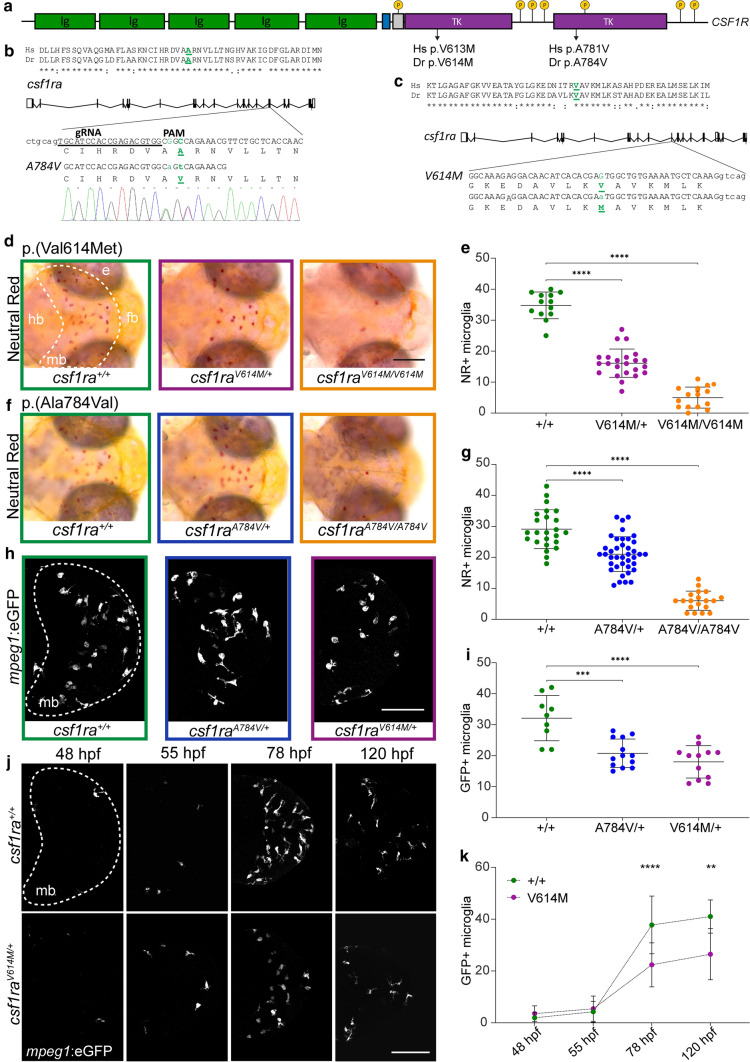
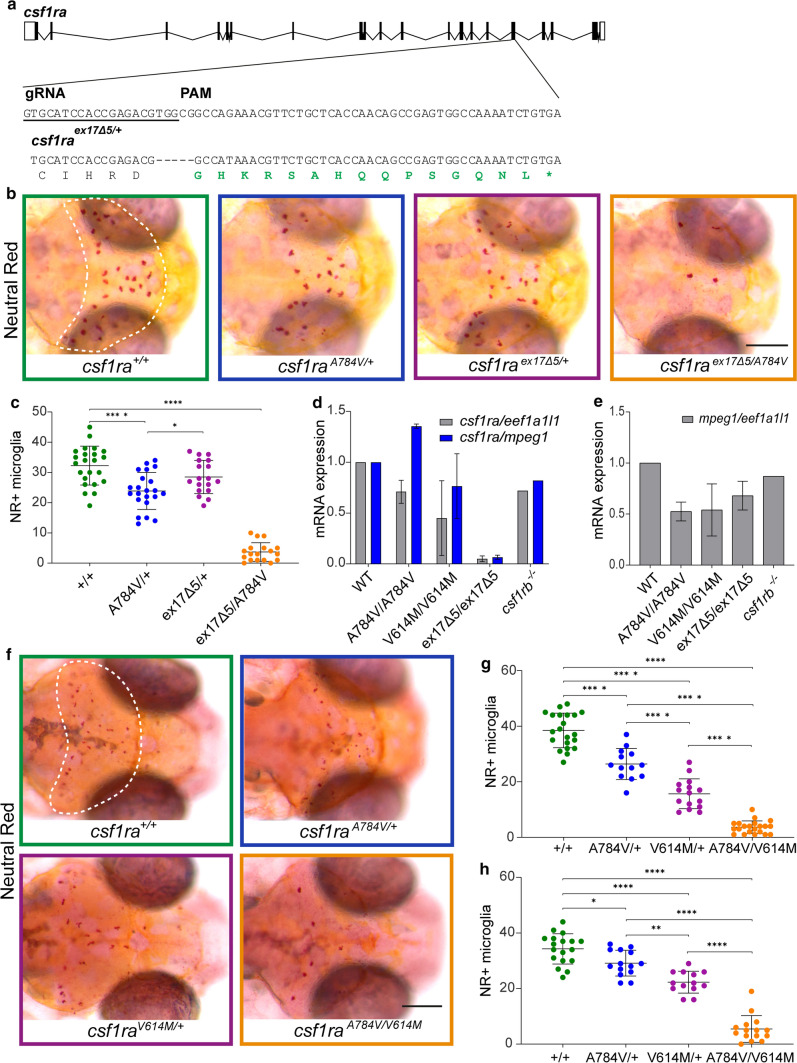
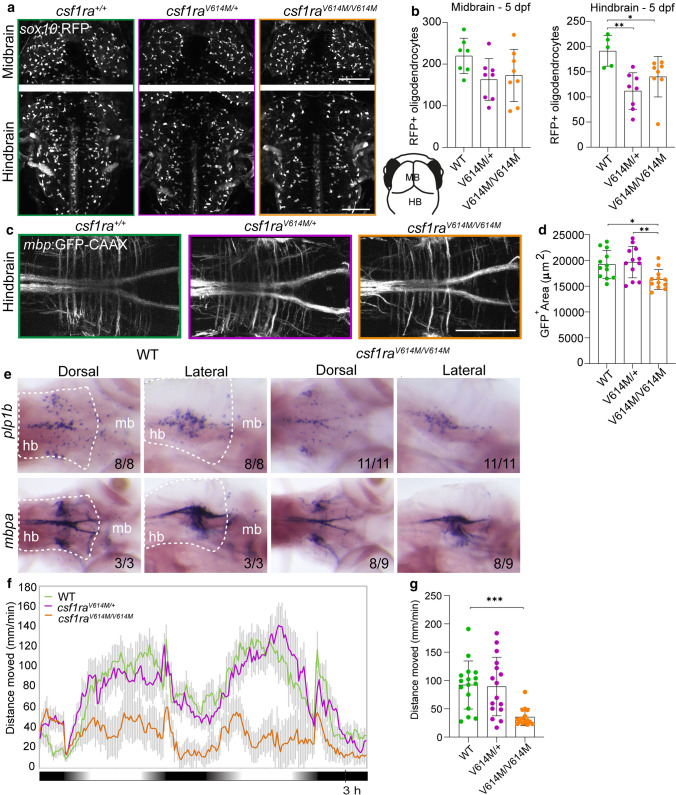
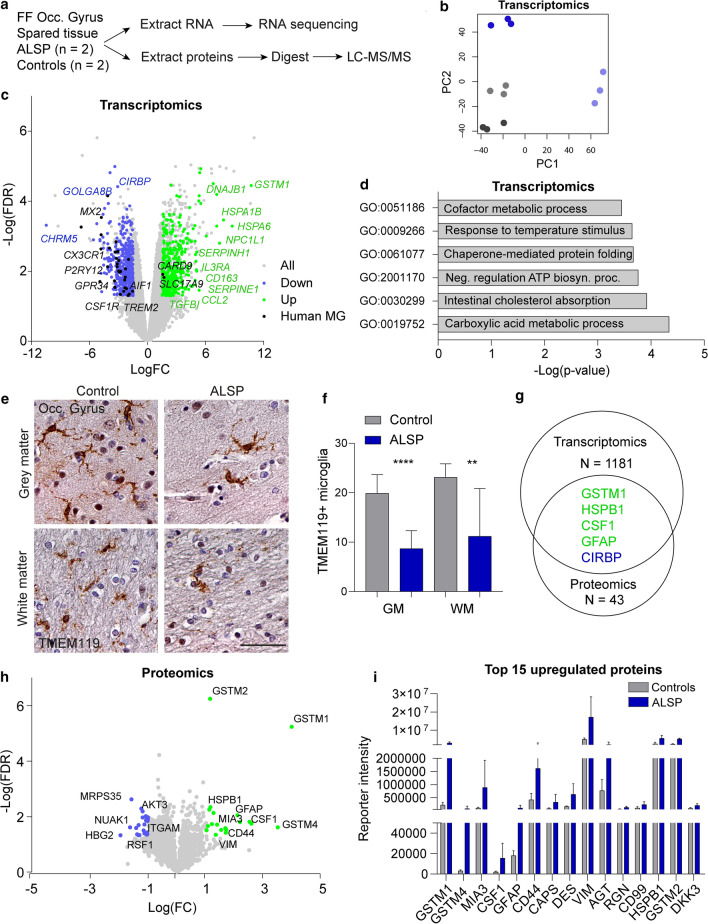
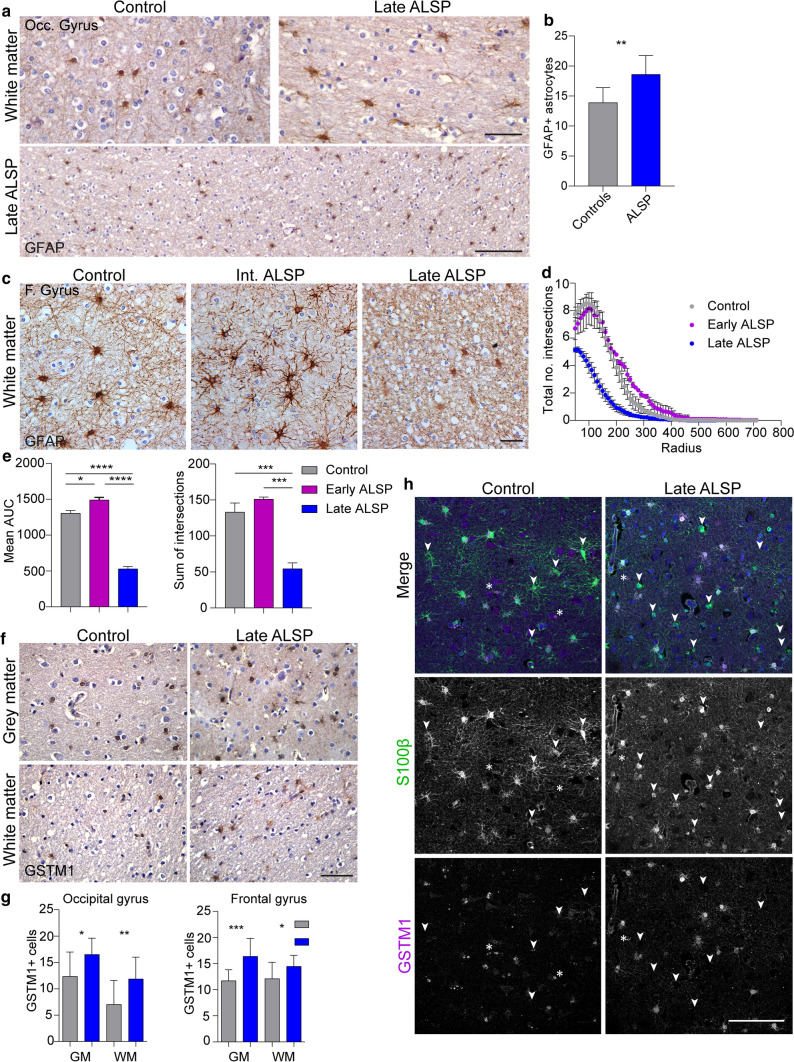
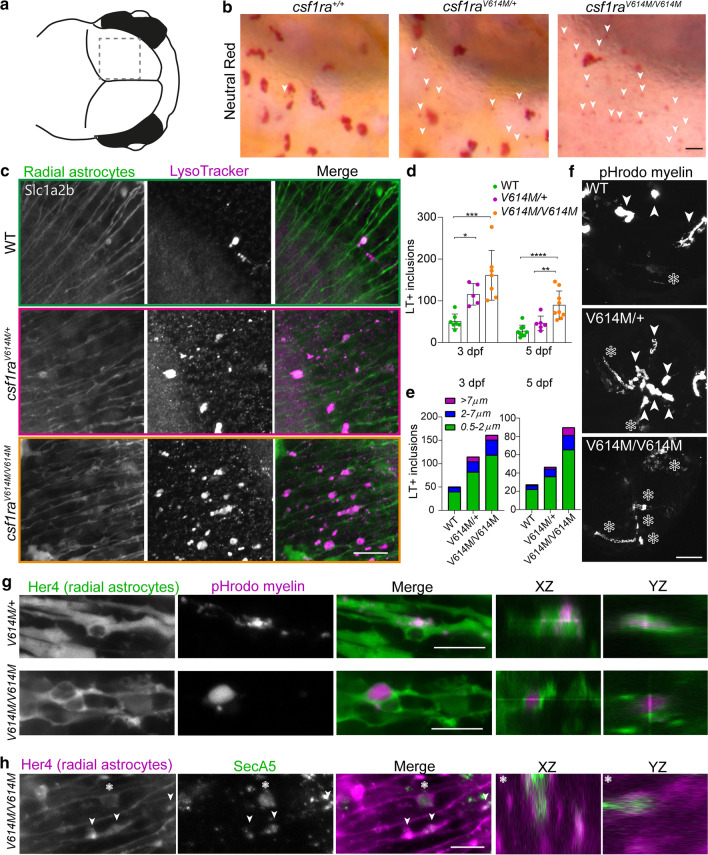
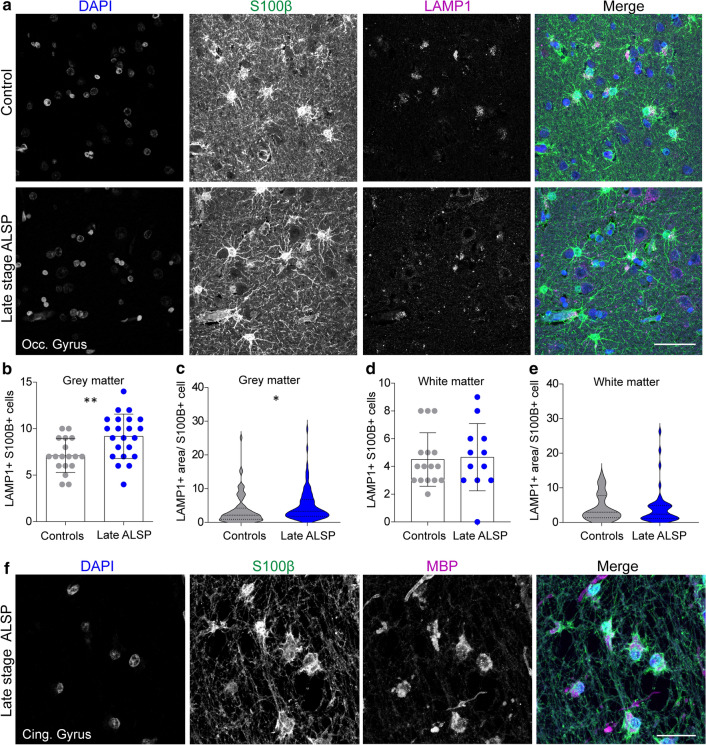
Tissue-resident macrophages of the brain, including microglia, are implicated in the pathogenesis of various CNS disorders and are possible therapeutic targets by their chemical depletion or replenishment by hematopoietic stem cell therapy. Nevertheless, a comprehensive understanding of microglial function and the consequences of microglial depletion in the human brain is lacking. In human disease, heterozygous variants in CSF1R, encoding the Colony-stimulating factor 1 receptor, can lead to adult-onset leukoencephalopathy with axonal spheroids and pigmented glia (ALSP) possibly caused by microglial depletion. Here, we investigate the effects of ALSP-causing CSF1R variants on microglia and explore the consequences of microglial depletion in the brain. In intermediate- and late-stage ALSP post-mortem brain, we establish that there is an overall loss of homeostatic microglia and that this is predominantly seen in the white matter. By introducing ALSP-causing missense variants into the zebrafish genomic csf1ra locus, we show that these variants act dominant negatively on the number of microglia in vertebrate brain development. Transcriptomics and proteomics on relatively spared ALSP brain tissue validated a downregulation of microglia-associated genes and revealed elevated astrocytic proteins, possibly suggesting involvement of astrocytes in early pathogenesis. Indeed, neuropathological analysis and in vivo imaging of csf1r zebrafish models showed an astrocytic phenotype associated with enhanced, possibly compensatory, endocytosis. Together, our findings indicate that microglial depletion in zebrafish and human disease, likely as a consequence of dominant-acting pathogenic CSF1R variants, correlates with altered astrocytes. These findings underscore the unique opportunity CSF1R variants provide to gain insight into the roles of microglia in the human brain, and the need to further investigate how microglia, astrocytes, and their interactions contribute to white matter homeostasis.

Keywords: ALSP; Astrocytes; CSF1R; Leukodystrophy; Microglia; Zebrafish models.


Figures

Fig. 1
Fig. 1
ALSP patients show an overall loss of (homeostatic) microglia and altered microglial distribution. a Brain MRI abnormalities in intermediate-stage ALSP patient 1 and intermediate-stage ALSP patient 2. Axial FLAIR images show hyperintense white matter abnormalities, most pronounced in the bilateral parietal and occipital lobes of intermediate-stage ALSP patient 1 and in the bilateral parietal and frontal lobes of intermediate-stage ALSP patient. Hyperintense signals on diffusion-weighted imaging (DWI) and corresponding low signal on apparent diffusion coefficient (ADC)-maps indicate restricted diffusion in the majority of the lesions in patient 1, but not in patient 2. Sagittal T1-weighted images show corpus callosum involvement and mild generalized brain atrophy in both patients. b Representative TMEM119 IHC images of the frontal gyrus of controls (n = 3), intermediate-stage ALSP patients (n = 2) and late-stage ALSP patients (n = 6) in grey matter (top row) and white matter (bottom row). c Representative P2RY12 IHC images of the frontal gyrus of controls (n = 3), intermediate-stage ALSP patients (n = 2) and late-stage ALSP patients (n = 6) in grey (top row) and white matter (bottom row). d, e Quantification of TMEM119 + (d) and P2RY12 + (e) microglia in grey (left) and white matter (right) of frontal gyrus. Data points represent microglia in one randomly taken image, 5 images/individual. f Representative P2RY12 IHC images of the frontal gyrus showing clustered distribution of P2RY12 + microglia in the white matter. g Representative CD163 IHC images of the frontal gyrus of late-stage ALSP (n = 6) patients showing clustered distribution of CD163 + cells in the white matter. Int.: intermediate. A nested one-way ANOVA test was preformed to test for significance (p < 0.05). Error bars represent SD. *p < 0.05, **p < 0.01, ***p < 0.001. Scale bars equal 50 μm (b, c) and 500 μm (f, g)
Fig. 2
Fig. 2
Heterozygous pathogenic missense variants in csf1ra result in microglial depletion in early development. a Schematic representation of the CSF1R gene, with five transmembrane immunoglobulin (ig) domains and two intracellular tyrosine kinase domains (TKD). Locations of the missense variants (human (Hs) and zebrafish (Dr)) are depicted, as well as tyrosine phosphorylation sites (p). b Schematic representation of csf1ra with: the location of the Ala784Val missense variant, located in exon 17 in the second TKD, the 19 bp gRNA, the PAM motif and the co-injected 30 bp oligo containing the missense variant, resulting in an Ala to Val change. c Schematic representation of csf1ra and the Val614Met missense variant in exon 13 [87]. d Representative images of the midbrain (mb, dashed line) after NR staining of csf1ra+/+ (green), csf1raV614M/+ (purple) and csf1raV614M/V614M (orange) larvae at 3 dpf. e Quantification of NR + microglia in csf1ra+/+ (green, n = 13), csf1raV614M/+ (purple, n = 23) and csf1raV614M/V614M (orange, n = 16) larvae at 3 dpf in the midbrain. f Representative images of the midbrain after NR staining of csf1ra+/+ (green), csf1raA784V/+ (blue) and csf1raA784V/A784V (orange) larvae at 3 dpf. g Quantification of NR + microglia in csf1ra+/+ (green, n = 24), csf1raA784V/+ (blue, n = 39) and csf1raA784V/A784V (orange, n = 19) larvae at 3 dpf. h Representative images of mpeg1:GFP + microglia in the midbrain (dashed line, mb) of csf1ra+/+ (green), csf1raA784V/+ (blue) and csf1raV614M/+ (purple) larvae at 3 dpf. i Quantification of mpeg1:GFP + microglia in csf1ra+/+ (green, n = 9), csf1raA784V/+ (blue, n = 13) and csf1raV614M/+ (purple, n = 12) at 3 dpf. j Representative longitudinal images of mpeg1:GFP + microglia in the midbrain (dashed line, mb) of the same csf1ra+/+ and csf1raV614M/+ larvae from 48 to 120 hpf. k Quantification of mpeg1:GFP + microglia in the midbrain of csf1ra+/+ (n = 6) and csf1raV614M/+ (n = 9) larvae from 48 to 120 hpf. Days-post-fertilization (dpf), eye (e), forebrain (fb), hindbrain (hb), midbrain (mb), neutral red (NR). One-way or two-way ANOVA test was preformed to test for significance (p < 0.05). Error bars represent SD. *p < 0.05, **p < 0.01, ***p < 0.001 ****p < 0.0001. Scale bar equals 100 μm (h, j) and 200 μm (d)
Fig. 3
Fig. 3
Heterozygous ALSP-causing CSF1R missense variants act dominant negatively in reducing the number of microglia. a Schematic representation of csf1ra with the 20 bp gRNA and the PAM motif, and 5 base pair (bp) deletion in exon 17 indicated, resulting in a frameshift (green) followed by a premature stop codon. b Representative images of the midbrain (dashed line) after NR staining of progeny of csf1raA784V/+ crossed with csf1raex17∆5/+ at 3 dpf. c Quantification of NR + microglia in the midbrain of csf1ra+/+ (green, n = 23), csf1raA784V/+ (blue, n = 22), csf1raex17∆5/+ (purple, n = 18) and csf1raex17∆5/A784V (orange, n = 18). d Expression of csf1ra mRNA in WT, csf1raA784V/A784V, csf1raV614M/V614M and csf1ra+/+ (n = 20/group) normalized to expression of eef1a1l1 (grey) and microglial gene mpeg1 (blue). e Expression of mpeg1 mRNA normalized to expression of housekeeping gene eef1a1l1 in WT, csf1raA784V/A784V, csf1raV614M/V614M and csf1ra+/+. f Representative images of the midbrain (dashed line) after NR staining of progeny of csf1raA784V/+ crossed with csf1raV614M/+ at 3 dpf. g, h Quantification of NR + microglia in the midbrain at 3 dpf (g) and 5 dpf (h) in csf1ra+/+ (green, n = 21, 18), csf1raA784V/+ (blue, n = 13, 14), csf1raV614M/+ (purple, n = 15, 13) and csf1raA784V/V614M (orange, n = 22, 15). Days-post-fertilization (dpf), neutral red (NR), wild type (WT). One-way ANOVA test was preformed to test for significance (p < 0.05). Error bars represent SD. *p < 0.05, ****p < 0.0001. Scale bars equal 200 μm
Fig. 4
Fig. 4
Homozygous missense variants in csf1ra causes myelin and behavioral abnormalities related to leukodystrophy. a Representative images of the midbrain (top) and the hindbrain (bottom) of csf1ra+/+ (green), csf1raV614M/+ (purple) and csf1raV614M/V614M (orange) larvae in a sox10:RFP background, visualizing oligodendrocytes, at 5 dpf. Lower right: schematic of zebrafish embryonic midbrain (mb) and hindbrain (hb). b Quantification of the number of sox10:RFP + oligodendrocytes in the midbrain and hindbrain at 5 dpf in WT (green), csf1raV614M/+ (purple) and csf1raV614M/V614M (orange) larvae. c Representative images of the hindbrain of WT (green), csf1raV614M/+ (purple) and csf1raV614M/V614M (orange) larvae in a mbp:GFP-CAAX background, visualizing myelin sheaths, at 5 dpf. d Quantification of the total mbp:GFP + myelinated area (μm2) in the hindbrain at 5 dpf in WT (green), csf1raV614M/+ (purple) and csf1raV614M/V614M (orange) larvae. e Representative images of in situ hybridization of plp1b (top) and mbpa (bottom) in WT (left) and csf1raV614M/V614M (right) larvae at 5 dpf, showing reduce number of plp1b + mature myelinating oligodendrocytes (11/11 larvae) and reduced mbpa + myelin sheaths and myelinating oligodendrocytes (8/9 larvae) in csf1raV614M/V614M larvae. Dashed lines show the hindbrain (hb). f Representative graph showing the total distance traveled (mm) by larvae per 1 min during the dusk–dawn routine (total time: 3 h 15 min), of csf1ra mutants in a csf1rb-deficient background. Grey shading shows the standard error of the mean (SEM). g Quantification of the total distance moved throughout the experiment excluding the dark period. n = 16 larvae per genotype. Days-post-fertilization (dpf), hindbrain (hb), midbrain (mb). One-way ANOVA test was preformed to test for significance (p < 0.05). Error bars represent SD, unless stated otherwise. *p < 0.05, **p < 0.01 ***p < 0.001. Scale bars equal 100 μm
Fig. 5
Fig. 5
Transcriptomic and proteomic analysis of least-affected tissue of ALSP patients and controls. a Schematic representation of the experimental design. Fresh–frozen (FF) post-mortem brain tissue of the occipital gyrus was used to extract RNA and proteins. N = 2/group. b PCA plot of transcriptomics of the control (grey, n = 2) and ALSP tissue (blue, n = 2). c Volcano plot showing all genes picked up by bulk RNA sequencing (grey), and DEG (n = 1181) (downregulated: blue; upregulated: green). Black dots represent human microglia (MG) genes found differentially expressed in ALSP tissue [38]. DEG: FDR < 0.05, − 1.5 < LogFC > 1.5. d Representative graph of GO pathway analysis of the DEG. e Representative TMEM119 IHC images of the tissue (occipital gyrus) of controls (n = 2) and late-stage ALSP patients (n = 2) in grey matter (top row) and white matter (bottom row). f Quantification of TMEM119 + microglia in grey (left) and white matter (right) of occipital gyrus, count based on five images/individual. g Venn diagram showing the number of genes and proteins found to be differentially expressed in transcriptomics (n = 1181) and proteomics (n = 43), and the overlapping genes found in both data sets (n = 5). Green: upregulated, blue: downregulated. h Volcano plot showing all proteins detected by LC–MS/MS (grey) and differentially expressed proteins (n = 43) (downregulated: blue; upregulated: green). Differentially expressed proteins: FDR < 0.05, − 1 < LogFC > 1. i Representative graph of the normalized reporter intensity of the top 15 most upregulated proteins in ALSP (blue) and control tissue (grey). False-discovery rate (FDR), fold change (FC), grey matter (GM), occipital gyrus (Occ. gyrus), white matter (WM). Brown–Forsythe ANOVA with Dunnett’s multiple comparison test was performed to test for significance in the microglia count analysis (p < 0.05). **p < 0.01 ****p < 0.0001. Error bars represent SD. Scale bars equal 50 μm
Fig. 6
Fig. 6
Abnormal astrocytic morphology and astrocyte-specific expression of GSTM1 in ALSP. a Representative images of occipital gyrus tissue of late-ALSP patients (n = 2) and controls (n = 2) stained with GFAP to visualize astrocytes in the white matter. b Quantification of the number of GFAP + astrocytes in the white matter of the occipital gyrus, based on five images/donor (n = 2/group). c Representative images of the white matter of the frontal gyrus stained with GFAP in intermediate-stage ALSP patients (n = 2), late-stage ALSP patients (n = 6) and controls (n = 3). d Sholl plot of GFAP + astrocytes found in the white matter of the frontal gyrus showing the total number of intersections per radius in intermediate and late ALSP vs control. e Quantifications of Sholl analysis on GFAP + astrocytes showing the mean area under the curve (AUC) (left) and total sum of intersections (right). f Representative images of GSTM1 staining of occipital gyrus tissue of late-ALSP patients (n = 2) and controls (n = 2) stained in the grey matter (top), white matter (bottom) and frontal gyrus of late-ALSP patients (bottom). g Quantification of the number of GSTM1 + cells in the grey and white matter of the occipital gyrus (left) and the frontal gyrus (right). Each dot represents the total number of GSTM1 + cells in one image, six images/donor (n = 2/group). h Representative images of frontal gyrus tissue of ALSP patients (n = 2) and controls (n = 2) stained with S100β (green), to visualize astrocytes, and GSTM1 (magenta). White arrows represent S100β + GSTM1- astrocytes; white asterisks represent S100β- GSTM1 + cells. Frontal (F.), grey matter (GM), Occipital (Occ.), white matter (WM). One-way or two-way ANOVA test was preformed to test for significance (p < 0.05). Error bars represent SD and SEM (d). *p < 0.05, **p < 0.01 ***p < 0.001 ****p < 0.0001. Scale bars equal 10 μm (a, upper panel), 100 μm (a, lower panel; h), 20 μm (c, f)
Fig. 7
Fig. 7
Astrocytic phenotype in heterozygous and homozygous missense zebrafish mutants indicates compensatory astrocytic endocytosis in early development. a Schematic image of the midbrain region imaged here. b Representative images of NR staining of half of the midbrain of csf1ra+/+, csf1raV614M/+ and csf1raV614M/V614M at 3 dpf. White arrows show small NR + dots in the region where astrocytes reside. c Representative images of LysoTracker staining (magenta) of csf1r WT, csf1raV614M/+ and csf1raV614M/V614M in a slc1a2b:Citrine background (green), visualizing radial astrocytes, in vivo at 3 dpf. d Quantifications of the number of LT + inclusions within radial astrocytes in the midbrain at 3 dpf in csf1rWT (n = 7, 9), csf1raV614M/+ (n = 5, 6) and csf1raV614M/V614M (n = 7, 9). e Quantifications of the number of LT + inclusions within radial astrocytes in the midbrain at 3 dpf (left) and 5 dpf (right), per category based on diameter of the inclusion (0.5–2 μm: green; 2–7 μm: blue; < 7 μm: purple). f Representative images of a maximum projection of a time-lapse video (3 h, 18–21 hpi), showing engulfment of pHrodo-labeled myelin by microglia (white arrows) and by radial astrocytes (white asterisks). g Representative images of pHrodo-labeled myelin inclusions (magenta) within radial astrocytes (green) in the midbrain of csf1raV614M/+ and csf1raV614M/V614M larvae at 4 dpf, 18 h post-injection (hpi). h Representative images of apoptotic cell particle (SecA5-mVenus + , green) inclusions within radial astrocytes (magenta) in the midbrain of csf1raV614M/V614M larvae at 3 dpf. One-way ANOVA or two-way ANOVA test was preformed to test for significance (p < 0.05). Error bars represent SD. *p < 0.05, **p < 0.01 ***p < 0.001. Scale bars equal 15 μm (b, c), 50 μm (f), 10 μm (g, h)
Fig. 8
Fig. 8
Elevated lysosomal vesicles in astrocytes and engulfment of myelin debris indicate compensatory astrocytic endocytosis in ALSP. a Representative confocal images of grey matter of the occipital gyrus tissue of late-stage ALSP patients and controls stained with DAPI (nuclei, blue), S100β (astrocytes, green) and LAMP1 (lysosomes, magenta). b, c, d, e Quantification of the number of LAMP1 + S100β + astrocytes in grey matter (b) and white matter (d), and the LAMP1 + area per S100β + astrocyte in grey matter (c) and white matter (e) of the occipital gyrus of late-stage ALSP patients (n = 2) and controls (n = 2). f Representative confocal images showing uptake of MBP + myelin (magenta) by S100β + astrocytes (green) in a white matter lesion in the cingulate gyrus of late stage ALSP patients. Student t test was preformed to test for significance (p < 0.05). Error bars represent SD. *p < 0.05, **p < 0.01 ***p < 0.001. Scale bars equal 50 μm (a) and 30 μm (f)

References

    1. Adams SJ, Kirk A, Auer RN. Adult-onset leukoencephalopathy with axonal spheroids and pigmented glia (ALSP): integrating the literature on hereditary diffuse leukoencephalopathy with spheroids (HDLS) and pigmentary orthochromatic leukodystrophy (POLD) J Clin Neurosci. 2018;48:42–49. doi: 10.1016/j.jocn.2017.10.060. - DOI - PubMed
    1. Ahmed R, Guerreiro R, Rohrer JD, Guven G, Rossor MN, Hardy J, Fox NC. A novel A781V mutation in the CSF1R gene causes hereditary diffuse leucoencephalopathy with axonal spheroids. J Neurol Sci. 2013;332:141–144. doi: 10.1016/j.jns.2013.06.007. - DOI - PMC - PubMed
    1. Ahrens MB, Orger MB, Robson DN, Li JM, Keller PJ. Whole-brain functional imaging at cellular resolution using light-sheet microscopy. Nat Methods. 2013;10:413–420. doi: 10.1038/nmeth.2434. - DOI - PubMed
    1. Alestrom P, D'Angelo L, Midtlyng PJ, Schorderet DF, Schulte-Merker S, Sohm F, Warner S. Zebrafish: housing and husbandry recommendations. Lab Anim. 2020;54:213–224. doi: 10.1177/0023677219869037. - DOI - PMC - PubMed
    1. Anders S, Pyl PT, Huber W. HTSeq–a Python framework to work with high-throughput sequencing data. Bioinformatics. 2015;31:166–169. doi: 10.1093/bioinformatics/btu638. - DOI - PMC - PubMed

Publication types

Substances