. 2022 Sep 1;71(9):1929-1936.
doi: 10.2337/db21-1076.

Hyperinsulinemia Is Highly Associated With Markers of Hepatocytic Senescence in Two Independent Cohorts

Affiliations

Hyperinsulinemia Is Highly Associated With Markers of Hepatocytic Senescence in Two Independent Cohorts

Abraham S Meijnikman et al. Diabetes. .

Abstract

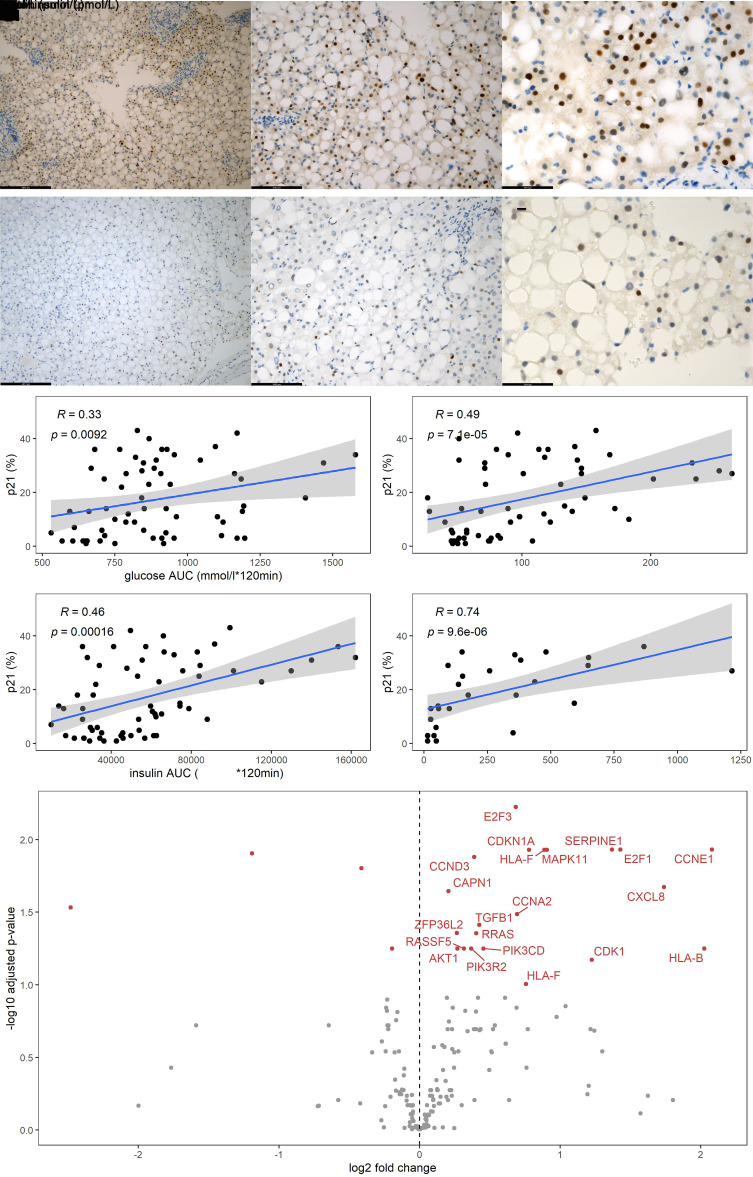
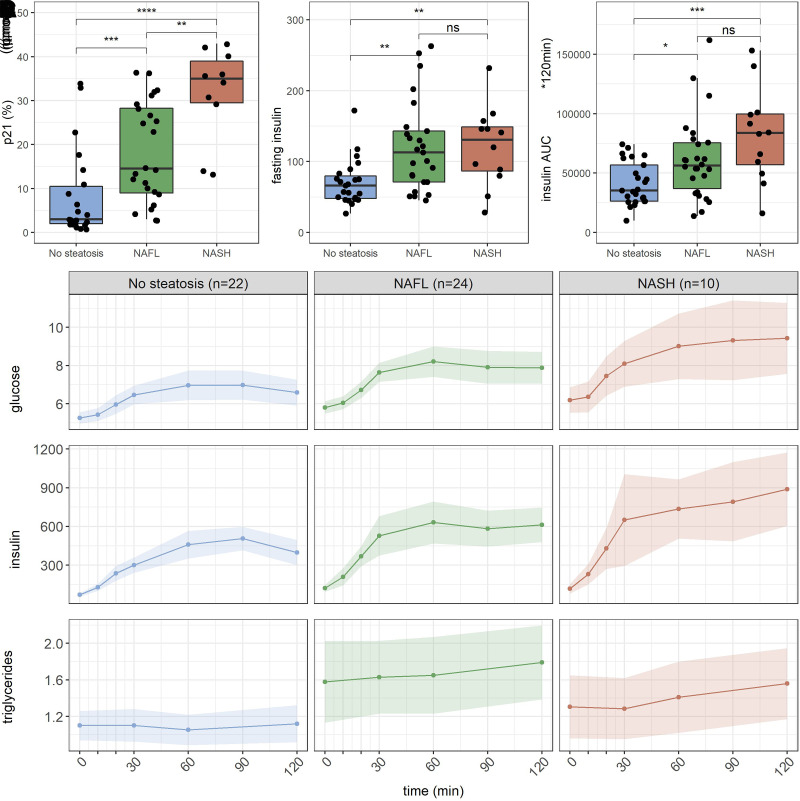
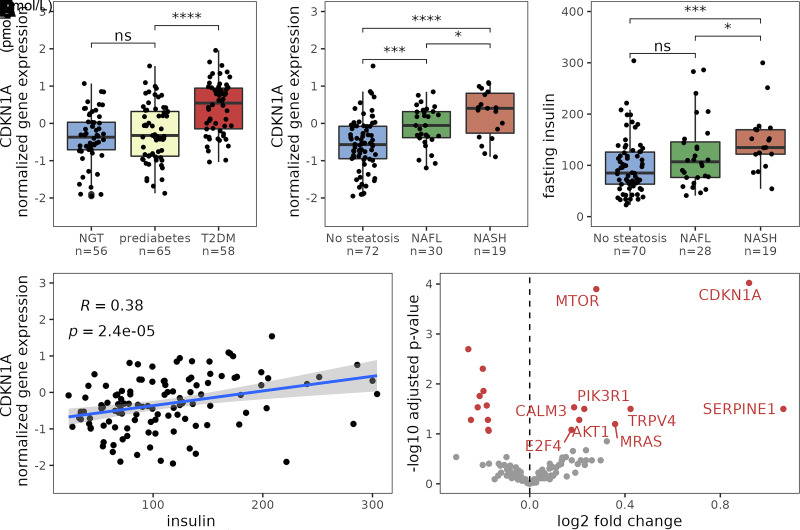
Cellular senescence is an essentially irreversible growth arrest that occurs in response to various cellular stressors and may contribute to development of type 2 diabetes mellitus and nonalcoholic fatty liver disease (NAFLD). In this article, we investigated whether chronically elevated insulin levels are associated with cellular senescence in the human liver. In 107 individuals undergoing bariatric surgery, hepatic senescence markers were assessed by immunohistochemistry as well as transcriptomics. A subset of 180 participants from the ongoing Finnish Kuopio OBesity Surgery (KOBS) study was used as validation cohort. We found plasma insulin to be highly associated with various markers of cellular senescence in liver tissue. The liver transcriptome of individuals with high insulin revealed significant upregulation of several genes associated with senescence: p21, TGFβ, PI3K, HLA-G, IL8, p38, Ras, and E2F. Insulin associated with hepatic senescence independently of NAFLD and plasma glucose. By using transcriptomic data from the KOBS study, we could validate the association of insulin with p21 in the liver. Our results support a potential role for hyperinsulinemia in induction of cellular senescence in the liver. These findings suggest possible benefits of lowering insulin levels in obese individuals with insulin resistance.


Figures

Figure 1
Figure 1
AC: Representative images of immunohistochemistry staining of liver tissue with p21 with ×100, ×200, and ×400 original magnification, respectively. DF: Representative images of immunohistochemistry staining of liver tissue with p53 with ×100, ×200, and ×400 original magnification, respectively. GJ: Scatterplots depicting the percentage of p21 on the y-axis and, respectively, glucose AUC, peripheral fasting insulin, insulin AUC, and portal insulin on the x-axis. The blue line is the linear regression prediction line, gray is the 95% CI of the regression, ρ is the Spearman correlation coefficient, and P value is the significance level. K: Volcano plot showing genes in the KEGG senescence pathway identified by RNA sequencing of liver tissue biopsies, respectively; red genes are those that are significantly upregulated in patients with the highest quintile peripheral insulin. RNA-sequencing data were adjusted for age, and individuals with T2DM were excluded from this analysis.
Figure 2
Figure 2
AC: Box plots showing p21 percentage, peripheral fasting insulin, and insulin AUC on the y-axis and the different categories of NAFL displayed on the x-axis (n = 56). D: Glucose, insulin, and triglyceride excursions during a 2-h MMT comparing individuals with no steatosis, NAFL, and NASH. Data are means ± 95% CIs. *P < 0.05, ** P < 0.01, ***P < 0.001.
Figure 3
Figure 3
Results from the validation cohort (n = 180). A: Hepatic CDKN1A expression in individuals with normal glucose tolerance (NGT), impaired fasting glucose, or T2DM. B: Box plot of hepatic CDKN1A expression in individuals with no steatosis, NAFL, and NASH. C: Peripheral fasting insulin concentrations in individuals without NAFL and with NAFL and NASH; individuals with T2DM were excluded from this analysis. D: Scatterplot displaying the relation between peripheral insulin and CDKN1A expression. Blue line is the linear prediction regression line; gray area is 95% CI, ρ is Spearman correlation coefficient, and P is the significance level; individuals with T2DM were excluded from this analysis. E: Volcano plot showing genes in the KEGG senescence pathway identified by RNA sequencing of liver biopsies. Genes in red indicate that the gene is significantly upregulated in individuals with fasting insulin levels in the highest quintile group. Adjusted for age; individuals with T2DM were excluded from this analysis. *P < 0.05, ** P < 0.01, ***P < 0.001.

References

    1. López-Otín C, Blasco MA, Partridge L, Serrano M, Kroemer G. The hallmarks of aging. 2013;153:1194–1217 - PMC - PubMed
    1. Ogrodnik M, Salmonowicz H, Gladyshev VN. Integrating cellular senescence with the concept of damage accumulation in aging: relevance for clearance of senescent cells. Aging Cell 2019;18:e12841. - PMC - PubMed
    1. Minamino T, Orimo M, Shimizu I, et al. A crucial role for adipose tissue p53 in the regulation of insulin resistance. Nat Med 2009;15:1082–1087 - PubMed
    1. Palmer AK, Xu M, Zhu Y, et al. Targeting senescent cells alleviates obesity-induced metabolic dysfunction. Aging Cell 2019;18:e12950. - PMC - PubMed
    1. Gustafson B, Nerstedt A, Smith U. Reduced subcutaneous adipogenesis in human hypertrophic obesity is linked to senescent precursor cells. Nat Commun 2019;10:2757. - PMC - PubMed

Publication types