. 2022 Sep 1;71(9):1994-2008.
doi: 10.2337/db22-0177.

Soluble RAGE Prevents Type 1 Diabetes Expanding Functional Regulatory T Cells

Affiliations

Soluble RAGE Prevents Type 1 Diabetes Expanding Functional Regulatory T Cells

Sherman S Leung et al. Diabetes. .

Abstract

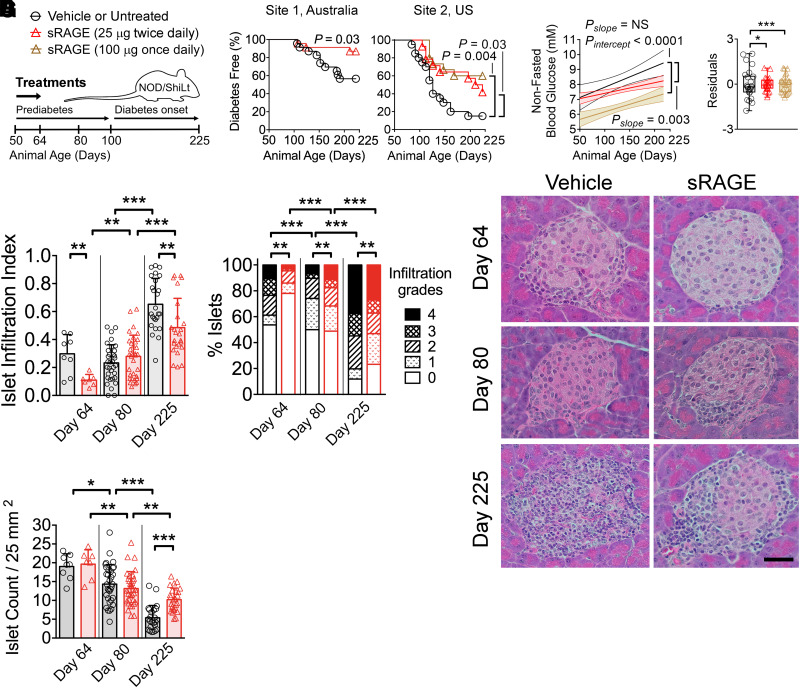
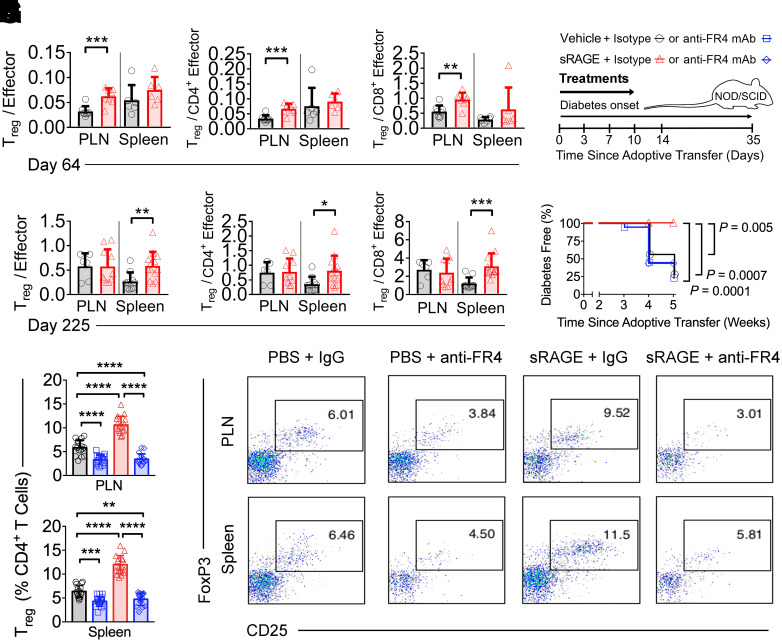
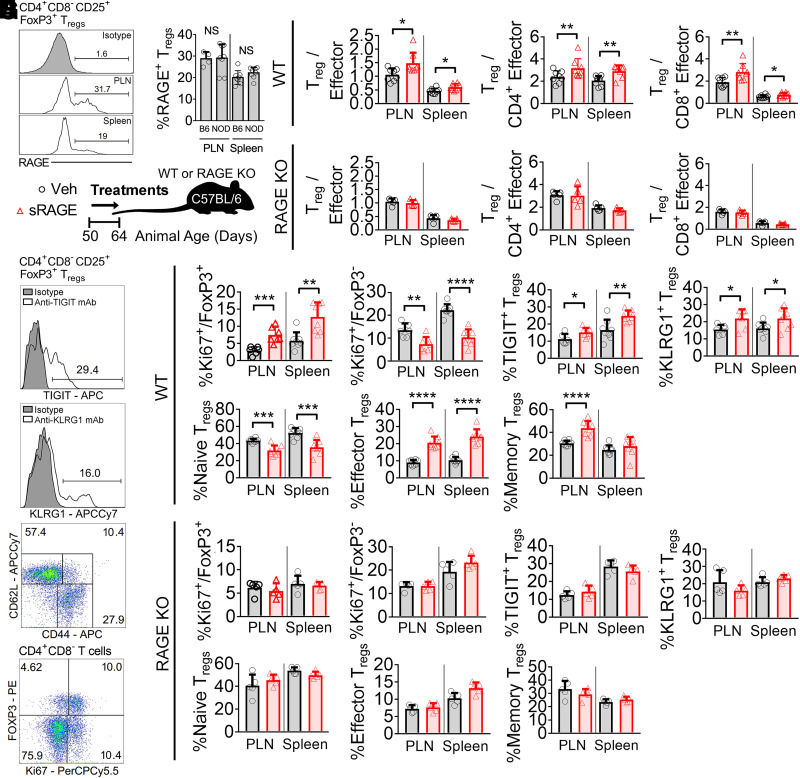
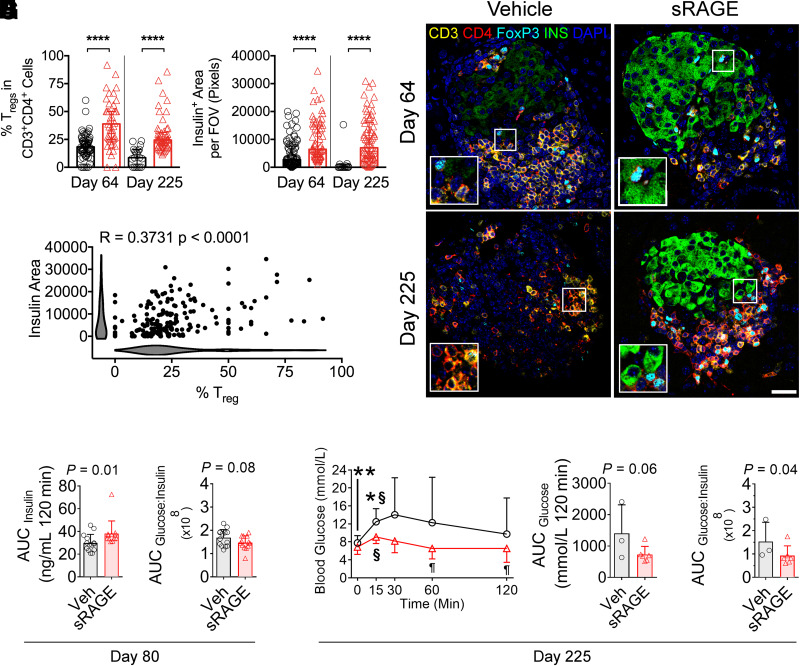
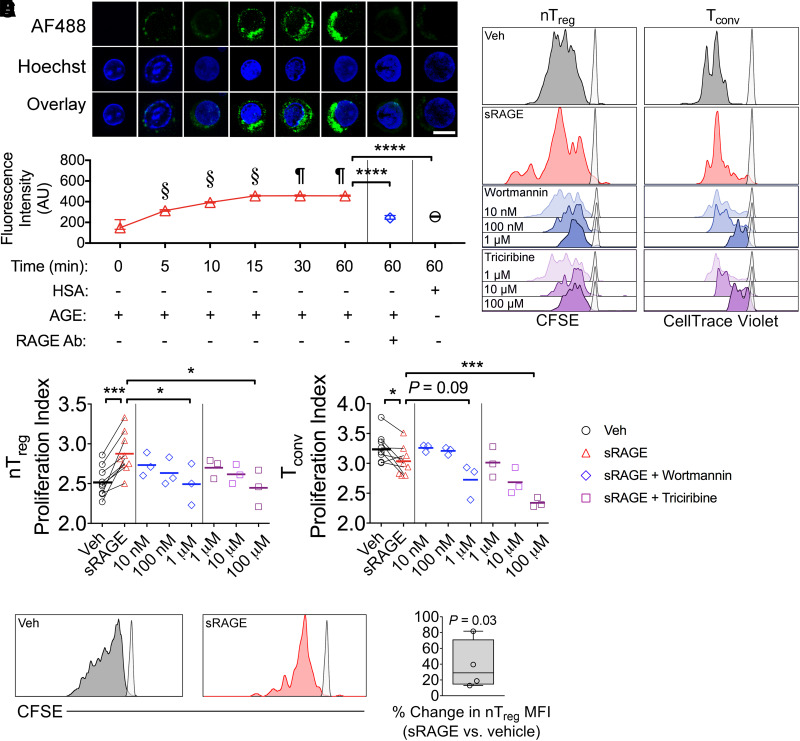
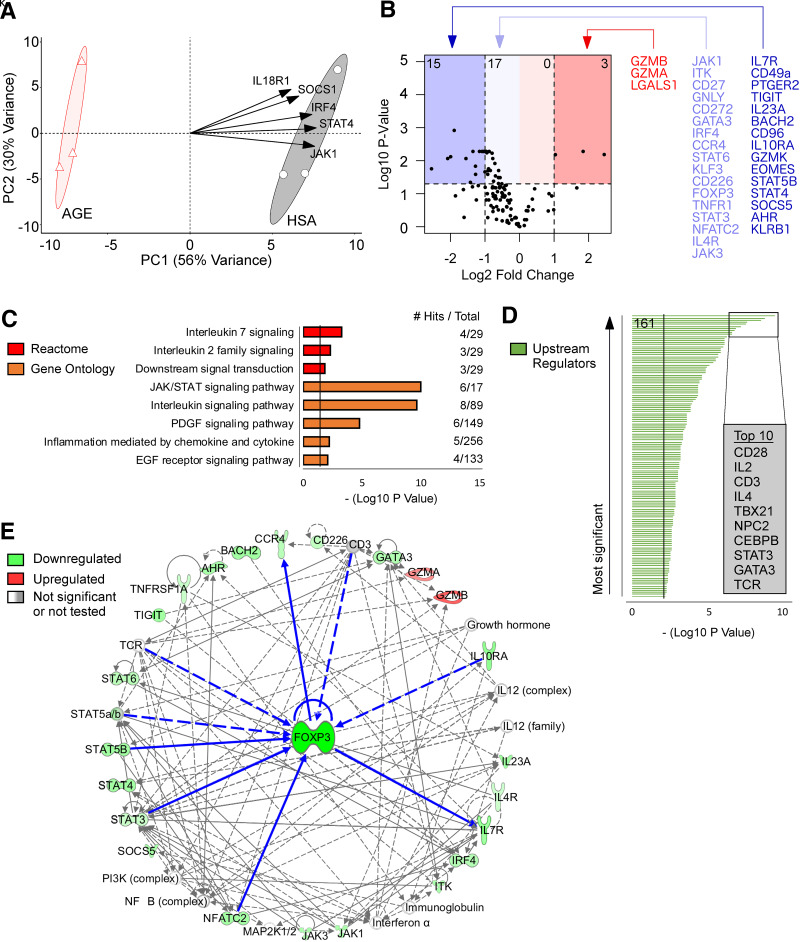
Type 1 diabetes is an autoimmune disease with no cure, where clinical translation of promising therapeutics has been hampered by the reproducibility crisis. Here, short-term administration of an antagonist to the receptor for advanced glycation end products (sRAGE) protected against murine diabetes at two independent research centers. Treatment with sRAGE increased regulatory T cells (Tregs) within the islets, pancreatic lymph nodes, and spleen, increasing islet insulin expression and function. Diabetes protection was abrogated by Treg depletion and shown to be dependent on antagonizing RAGE with use of knockout mice. Human Tregs treated with a RAGE ligand downregulated genes for suppression, migration, and Treg homeostasis (FOXP3, IL7R, TIGIT, JAK1, STAT3, STAT5b, CCR4). Loss of suppressive function was reversed by sRAGE, where Tregs increased proliferation and suppressed conventional T-cell division, confirming that sRAGE expands functional human Tregs. These results highlight sRAGE as an attractive treatment to prevent diabetes, showing efficacy and reproducibility at multiple research centers and in human T cells.

Trial registration: ClinicalTrials.gov NCT01030861 NCT01773707.


Conflict of interest statement

Duality of Interest. P.-H.G. is a board member of AbbVie, AstraZeneca, Boehringer Ingelheim, Cebix, Eli Lilly, Janssen, Medscape, Novartis, Novo Nordisk, and Sanofi. P.-H.G. received lecture honoraria from AstraZeneca, Boehringer Ingelheim, Eli Lilly, Genzyme, Merck Sharp & Dohme, Novartis, Novo Nordisk, and Sanofi. P.-H.G. received grants from Eli Lilly and Roche. M.K. is a board member and minor (<5%) shareholder of Vactech Ltd. M.K. received lecture honoraria from Novo Nordisk. T.E.B. and J.C. received income and research support from Novo Nordisk. No other potential conflicts of interest relevant to this article were reported.

Figures

Figure 1
Figure 1
Treatment with sRAGE provides lasting protection against autoimmune diabetes in an international multisite preclinical trial. A: NOD/ShiLt mice were administered vehicle at site 1 or were untreated at site 2 (black bars/circles) or treated with 25 µg sRAGE twice daily (red bars/triangles) or 100 µg sRAGE once daily (brown bars/triangles) from days 50–64 of life. B: Autoimmune diabetes incidence. Site 1, three independent experiments, n = 23/group; site 2, one independent experiment, n = 14–20/group. C: Nonfasting blood glucose concentrations shown as linear regression ± 95% CI (left) and residuals representing variability of blood glucose levels from the regression line (right). D–F: Pancreatic islet infiltration. D: Islet infiltration index (0 indicates no infiltration; to 1 indicates >75% infiltration). E: Degree of islet infiltration (grade 0, none; grade 1, peri-infiltration; grade 2, <25% infiltration; grade 3, 25–75% infiltration; grade 4, >75% infiltration). F: Representative hematoxylin-eosin photomicrographs (n = 7–33 sections/group from n = 4–7 mice/group; scale bar = 40 µm). G: Islet count normalized by tissue area. Column graphs are shown as median (IQR), with analysis with two-tailed Mann-Whitney U test. Box-and-whisker plot variances were analyzed with F test. Degree of insulitis is shown as mean and proportions analyzed with Fischer exact test. Diabetes incidence is shown with Kaplan-Meier survival curves and was analyzed with log-rank test. *P < 0.05; **P < 0.01; ***P < 0.001.
Figure 2
Figure 2
Tregs are a nonredundant mechanism of action for sRAGE treatment. AF: Flow cytometry quantification of Treg-to-Teff ratios on day 64 (AC) and day 225 (DF) in NOD/ShiLt mice (n = 4–13/group). G: In an adoptive transfer model of autoimmune diabetes, splenocytes from diabetic NOD/ShiLt donors were adoptively transferred into NOD/SCID recipients. Recipient mice were treated with vehicle or 25 µg sRAGE twice daily for 14 days and isotype control or anti-folate receptor 4 (FR4) monoclonal antibodies (mAb) at 3, 7, 10, and 14 days. Diabetes incidence (three independent experiments, n = 16 mice/group) (H) and flow cytometry quantification of Treg frequencies (n = 16 mice/group) (I and J). I: Quantification of frequencies. J: Representative dot plots. Column graphs are shown as median (IQR), with analysis with two-tailed Mann-Whitney U test. Diabetes incidence is shown with Kaplan-Meier survival curves and was analyzed with log-rank test. *P < 0.05; **P < 0.01; ***P < 0.001.
Figure 3
Figure 3
RAGE is required for the modulation of Treg-to-Teff ratios by sRAGE treatment. A and B: Flow cytometry quantification of RAGE expression on CD4+CD8CD25+FoxP3+ Tregs in a mouse model of autoimmune diabetes (NOD/ShiLt) and C57BL/6 mice on day 50 of life. A: Representative histograms. B: Proportion of RAGE+ Tregs (n = 4–8 mice/tissue). C: Wild-type and RAGE KO C57BL/6 mice were administered vehicle (Veh) (black bars/circles) or treated with 25 µg sRAGE twice daily (red bars/triangles) on day 50–64 of life. D and E: Treg-to-Teff ratios on day 64 in wild-type (WT) (D) and RAGE KO (E) mice (n = 8 mice/group). FH: TIGIT, KLRG1, CD62L, CD44, and Ki67 expression. F: Representative histograms and gating strategies. G: Wild-type mice. H: RAGE KO mice. Column graphs are shown as means ± SD, with analysis with two-tailed Student t test. *P<0.05; **P < 0.01; ***P < 0.001; ****P < 0.0001. mAb, monoclonal antibody; NS, not significant; PE, phycoerythrin.
Figure 4
Figure 4
Improvements in islet-infiltrating Tregs, insulin expression, and oral glucose tolerance following sRAGE treatment in NOD/ShiLt mice. AD: Multiplexed immunofluorescence staining and quantification of CD3, CD4, FoxP3, insulin, and DAPI (n = 10–20 sections/mouse from n = 6 mice/group). Inset images are ×2 magnified. A: Proportion of islet-infiltrating CD3+CD4+FoxP3+ Tregs. B: Insulin area per field of view (FOV). C: Representative photomicrographs. Bar, 40 µm. D: Correlation analyses of CD3+CD4+FoxP3+ Treg proportions and insulin area (shaded bars are Kernel plots showing variable distribution). EI: OGTTs on day 80 (n = 15/group) and 225 (n = 3–6/group) of life. E: Day 80 AUCinsulin. F: Day 80 AUCglucose–to–AUCinsulin ratios. G: Day 225 blood glucose concentrations. H: Day 225 AUCglucose. I: Day 225 AUCglucose–to–AUCinsulin ratio. Data shown as means ± SD and were analyzed with two-tailed unpaired or paired Student t tests. Correlation analyses were performed with Spearman test. *P < 0.05 between groups; **P < 0.01 between groups; ****P < 0.0001 between groups; §P < 0.05 vs. 0 min within the same group; ¶P < 0.05 vs. 15- and 30-min time points within the same group. Veh, vehicle.
Figure 5
Figure 5
Human nTregs bind AGEs in a RAGE-dependent manner and proliferate more in coculture when treated with sRAGE. A: Human CD3+CD4+CD25+CD127lo/− nTregs were incubated with AGE-modified HSA (AGE-HSA or AGE) or unmodified HSA (HSA)—both labelled with Alexa Fluor 488 (AF488). Anti-RAGE antibody (Ab) was added to the culture as indicated. Bar, 10 µm. n = 3 donors/group. BD: CFSE-labeled CD3+CD4+CD25+CD127lo/− nTregs and CellTrace Violet–labeled CD3+CD4+CD25 Tconvs were stimulated in 3-day coculture at a 1:1 ratio containing anti-CD3/CD28 MACSiBeads (1:10 bead:cell ratio). B: Representative histograms (unstimulated controls presented as semi-transparent peaks). CD: Proliferation indices of nTregs and Tconvs when administered vehicle or 50 µg sRAGE daily (n = 9/group), as well as sRAGE in addition to PI3K-Akt-mTOR pathway inhibitor wortmannin or triciribine (n = 3/group). E and F: CFSE-labeled CD3+CD4+CD25+CD127lo/− nTregs were stimulated in 3-day monoculture containing anti-CD3/CD28 MACSiBeads (1:20 bead:cell) and 200 IU/mL IL-2. E: Representative histograms. F: Percent change in CFSE mean fluorescence intensity (MFI) (n = 4/group). Data are shown as mean ± SD, with analysis with paired two-tailed Student t tests. §P < 0.05 vs. all previous time points. ¶P < 0.05 vs. 0, 5, 10, and 15 min. *P < 0.05; ***P < 0.001; ****P < 0.0001. AU, arbitrary units; Veh, vehicle.
Figure 6
Figure 6
AGE treatment of human nTregs downregulates key genes for suppressive function and manipulates signaling cascades upstream and downstream of FOXP3. A: PCA with the top five variable loadings shown as arrows. B: Volcano plot visualization for changes in gene expression (number of differentially expressed genes shown in top corners). C: Pathway enrichment analysis with use of the Reactome and Gene Ontology databases. D: Upstream regulator predictions with use of Ingenuity Pathway Analysis (161 significant regulators were identified). E: Network analysis with FOXP3 as the focus node. Neighboring molecules are connected to FOXP3 with bolded blue lines. All other molecules are two to three nodes adjacent to FOXP3. Direct relationships are shown as solid lines, and indirect relationships are shown as dashed lines. n = 3/group. P values were corrected with false discovery rate or Bonferroni adjustment. PC1, principal component 1.

References

    1. Atkinson MA, Eisenbarth GS, Michels AW. Type 1 diabetes. Lancet 2014;383:69–82 - PMC - PubMed
    1. Tao B, Pietropaolo M, Atkinson M, Schatz D, Taylor D. Estimating the cost of type 1 diabetes in the U.S.: a propensity score matching method. PLoS One 2010;5:e11501. - PMC - PubMed
    1. Brusko TM, Wasserfall CH, Clare-Salzler MJ, Schatz DA, Atkinson MA. Functional defects and the influence of age on the frequency of CD4+ CD25+ T-cells in type 1 diabetes. Diabetes 2005;54:1407–1414 - PubMed
    1. Laban S, Suwandi JS, van Unen V, et al. . Heterogeneity of circulating CD8 T-cells specific to islet, neo-antigen and virus in patients with type 1 diabetes mellitus. PLoS One 2018;13:e0200818. - PMC - PubMed
    1. Rosenzwajg M, Churlaud G, Mallone R, et al. . Low-dose interleukin-2 fosters a dose-dependent regulatory T cell tuned milieu in T1D patients. J Autoimmun 2015;58:48–58 - PMC - PubMed

Publication types

Substances

Associated data