Case Reports
. 2022 Jun 17;17(6):e0269306.
doi: 10.1371/journal.pone.0269306. eCollection 2022.

Estimating the basic reproduction number at the beginning of an outbreak

Affiliations
Case Reports

Estimating the basic reproduction number at the beginning of an outbreak

Sawitree Boonpatcharanon et al. PLoS One. .

Abstract

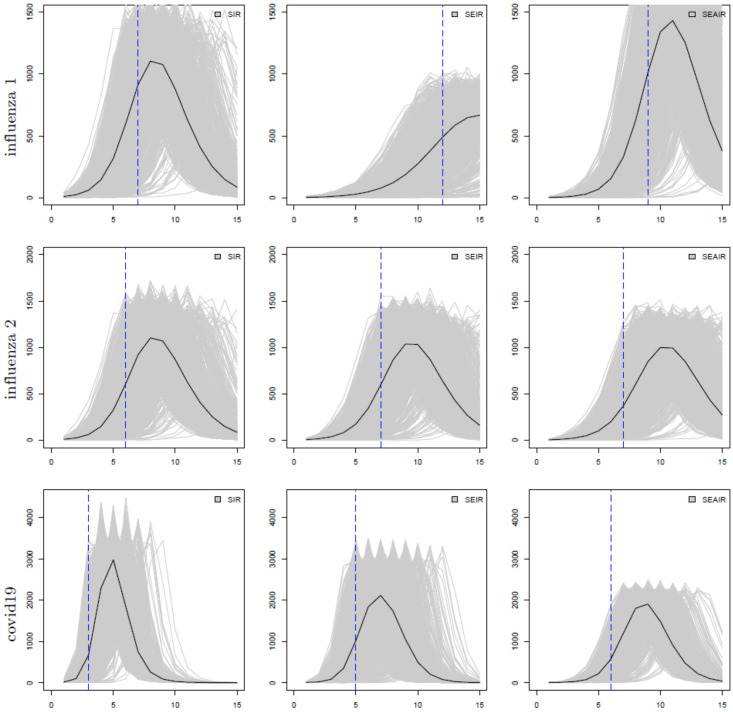
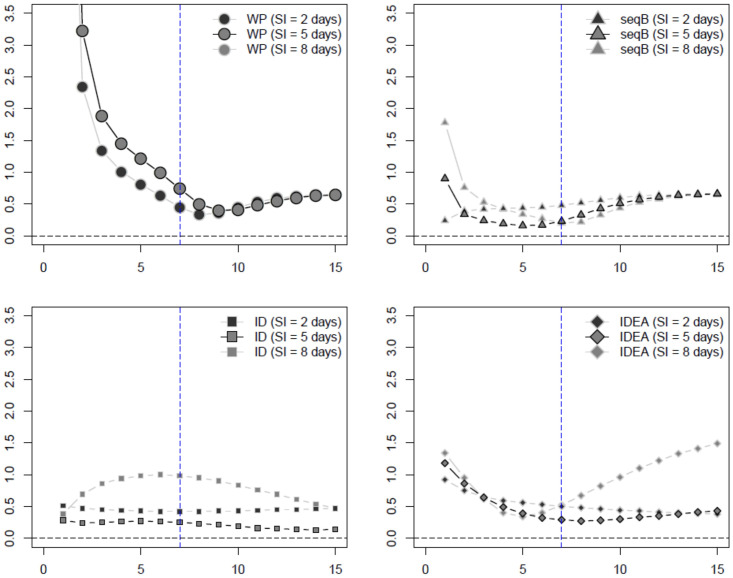
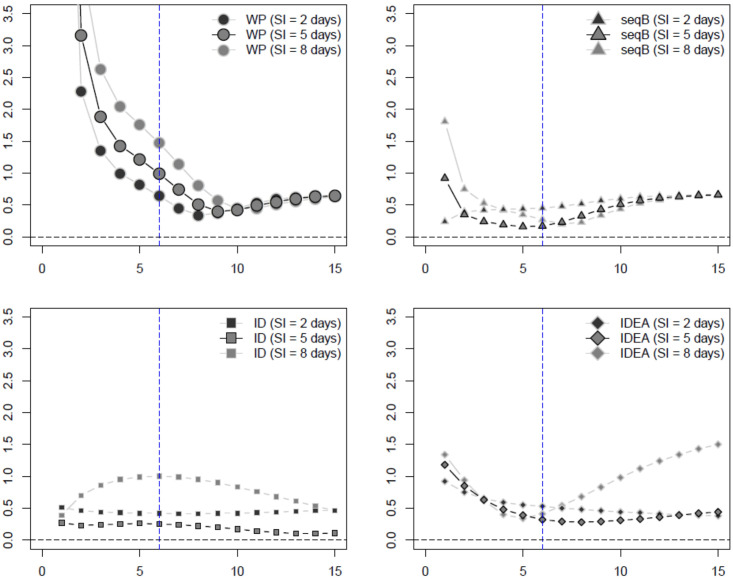
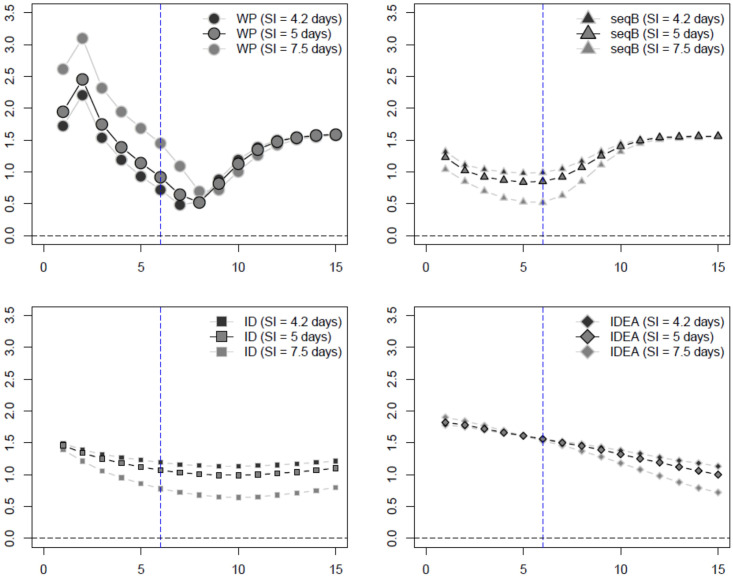
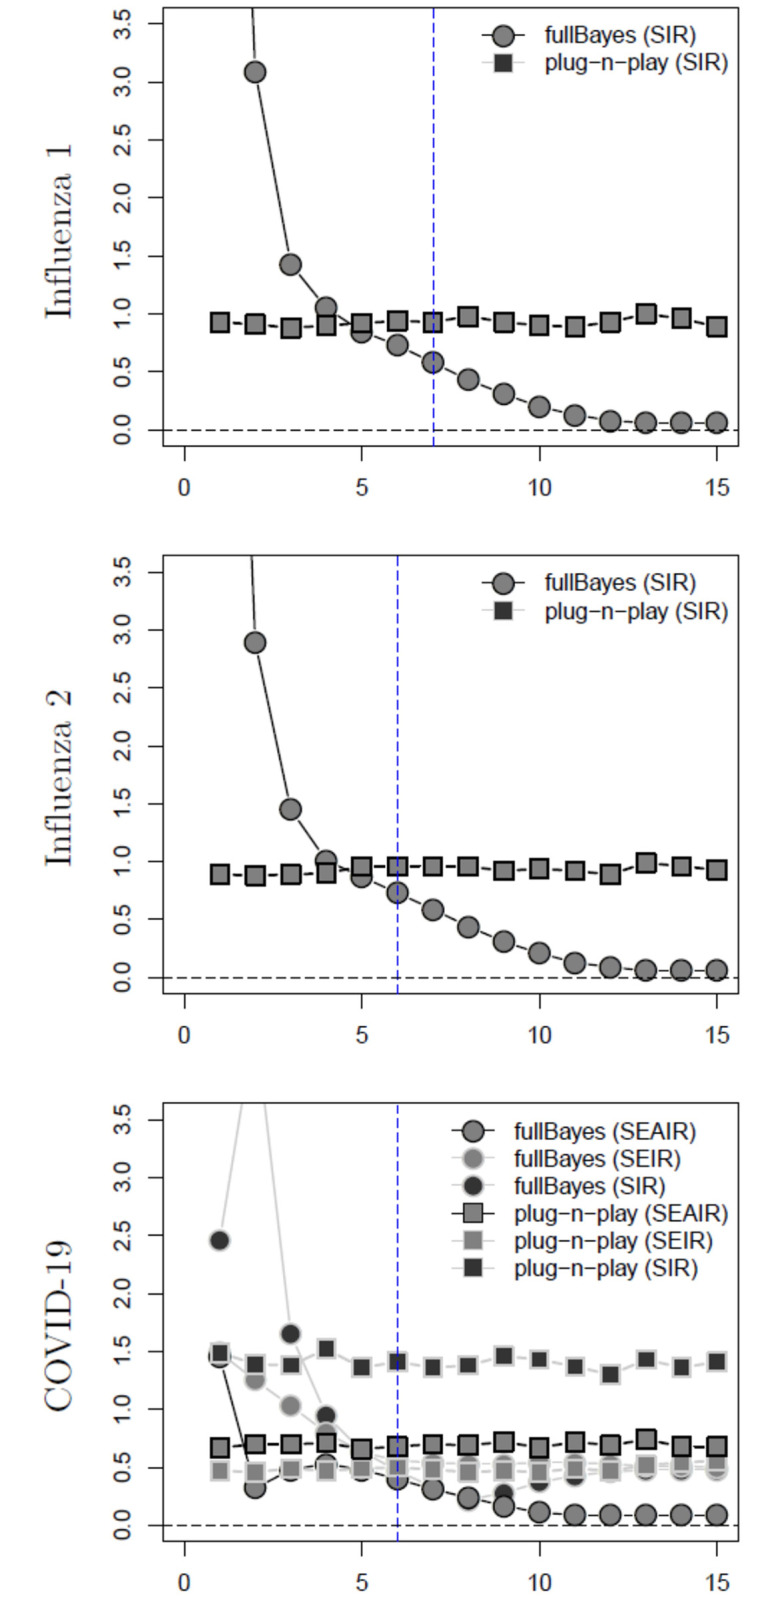
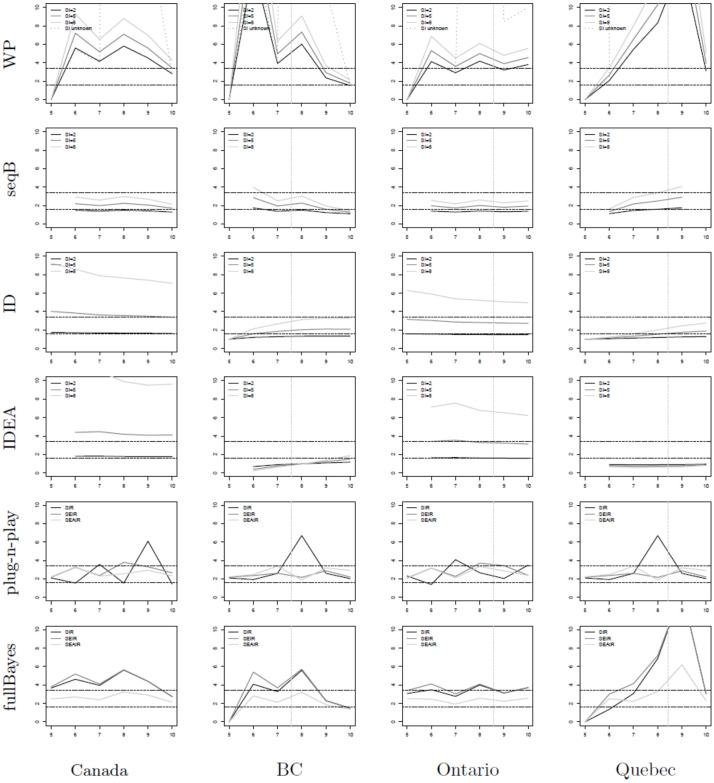
We compare several popular methods of estimating the basic reproduction number, R0, focusing on the early stages of an epidemic, and assuming weekly reports of new infecteds. We study the situation when data is generated by one of three standard epidemiological compartmental models: SIR, SEIR, and SEAIR; and examine the sensitivity of the estimators to the model structure. As some methods are developed assuming specific epidemiological models, our work adds a study of their performance in both a well-specified (data generating model and method model are the same) and miss-specified (data generating model and method model differ) settings. We also study R0 estimation using Canadian COVID-19 case report data. In this study we focus on examples of influenza and COVID-19, though the general approach is easily extendable to other scenarios. Our simulation study reveals that some estimation methods tend to work better than others, however, no singular best method was clearly detected. In the discussion, we provide recommendations for practitioners based on our results.


Conflict of interest statement

The authors have declared that no competing interests exist.

Figures

Fig 1
Fig 1. The number of infectious individuals (y-axis) at time t in weeks (x-axis); from left to right: SIR, SEIR, and SEAIR; from top to bottom the examples are influenza 1, influenza 2, then covid19.
Individual simulated outbreaks from 1000 simulations are shown as grey lines, and their average is denoted as a black line. The blue vertical dashed lines show the inflection points for each model.
Fig 2
Fig 2. Influenza example 1 estimated MSE of R0 estimators assuming known serial interval (SI) with SIR data (week on x-axis).
The inflection point indicated by the blue dashed vertical line.
Fig 3
Fig 3. Influenza example 2 estimated MSE of R0 estimators assuming known serial interval (SI) with SIR data (week on x-axis).
The inflection point indicated by the blue dashed vertical line.
Fig 4
Fig 4. COVID-19 estimated MSE of R0 estimators assuming known serial interval (SI) with SEAIR data (week on x-axis).
The inflection point indicated by the blue dashed vertical line.
Fig 5
Fig 5. Estimated MSE of R0 estimators assuming unknown serial interval (SI) (week on x-axis).
For both influenza examples the data is SIR while for the COVID-19 example the data is SEAIR. The inflection point indicated by the blue dashed vertical line.
Fig 6
Fig 6. R0 estimators (y-axis) for COVID-19 data in Canada.
Data from [52]. The x-axis shows time in weeks where t = 0 denotes January 25, 2020—the date of the first known case in Canada [51]. The vertical gray line shows the date of lockdown for each of the provinces (there was no national lockdown date) [51]; while the horizontal lines denote estimates of R0 from reference [3]. The provinces of BC (second column), Ontario (third column), and Quebec (last column) are studied, as well as the entire nation (first column). The WP, seqB, ID and IDEA methods are applied using assumed known serial intervals of 2, 5, and 8 days.

References

    1. Zhao S, Lin Q, Ran J, Musa SS, Yang G, Wang W, et al.. Preliminary estimation of the basic reproduction number of novel coronavirus (2019-nCoV) in China, from 2019 to 2020: A data-driven analysis in the early phase of the outbreak. International Journal of Infectious Diseases. 2020;92:214–217. doi: 10.1016/j.ijid.2020.01.050 - DOI - PMC - PubMed
    1. Tuite AR, Fisman DN. Reporting, epidemic growth, and reproduction numbers for the 2019 novel coronavirus (2019-nCoV) epidemic. Annals of Internal Medicine. 2020;172(8):567–568. doi: 10.7326/M20-0358 - DOI - PMC - PubMed
    1. Knight J, Mishra S. Estimating effective reproduction number using generation time versus serial interval, with application to COVID-19 in the Greater Toronto Area, Canada. Infectious Disease Modelling. 2020;5:889–896. doi: 10.1016/j.idm.2020.10.009 - DOI - PMC - PubMed
    1. Mellan TA, Hoeltgebaum HH, Mishra S, Whittaker C, Schnekenberg RP, Gandy A, et al.. Report 21: Estimating COVID-19 cases and reproduction number in Brazil. medRxiv. 2020.
    1. Hilton J, Keeling MJ. Estimation of country-level basic reproductive ratios for novel Coronavirus (SARS-CoV-2/COVID-19) using synthetic contact matrices. PLoS Computational Biology. 2020;16(7):e1008031. doi: 10.1371/journal.pcbi.1008031 - DOI - PMC - PubMed

Publication types