. 2022 Jun 17;17(6):e0270168.
doi: 10.1371/journal.pone.0270168. eCollection 2022.

Monitoring occurrence of SARS-CoV-2 in school populations: A wastewater-based approach

Affiliations

Monitoring occurrence of SARS-CoV-2 in school populations: A wastewater-based approach

Victor Castro-Gutierrez et al. PLoS One. .

Abstract

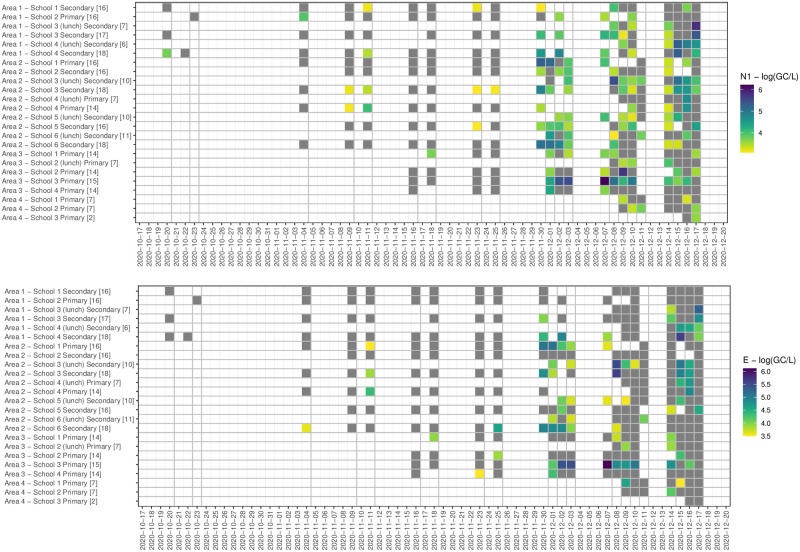
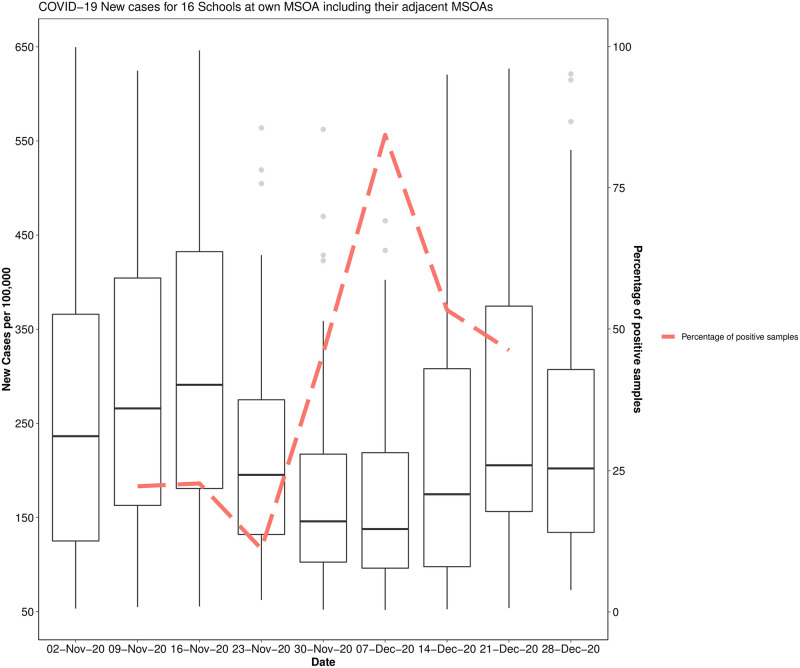
Clinical testing of children in schools is challenging, with economic implications limiting its frequent use as a monitoring tool of the risks assumed by children and staff during the COVID-19 pandemic. Here, a wastewater-based epidemiology approach has been used to monitor 16 schools (10 primary, 5 secondary and 1 post-16 and further education) in England. A total of 296 samples over 9 weeks have been analysed for N1 and E genes using qPCR methods. Of the samples returned, 47.3% were positive for one or both genes with a detection frequency in line with the respective local community. WBE offers a low cost, non-invasive approach for supplementing clinical testing and can provide longitudinal insights that are impractical with traditional clinical testing.


Conflict of interest statement

The authors have declared that no competing interests exist.

Figures

Fig 1
Fig 1. Heatmap detection/non-detection for N1 gene (a) and E gene (b).
Note: number of samples collected for each school/sample pattern is provided in square brackets at the end of the name of the school.
Fig 2
Fig 2. Heatmap detection/non-detection N1 gene and E gene combination.
Note: number of samples collected for each school/sample pattern is provided in square brackets at the end of the name of the school.
Fig 3
Fig 3. Heatmap daily log10(GC/L) N1 gene and E gene (grey indicated non-detection).
Note: number of samples collected for each school/sample pattern is provided in square brackets at the end of the name of the school.
Fig 4
Fig 4. Community level (MSOAs) COVID-19 new cases per 100,000 by week and percentage of positive school samples.
Note: Each box shows the distribution of new cases per 100,000 across the community (MSOA*) of each school and all the adjacent communities for a total of 92 MSOAs). Solid lines show medians; the boxes show Interquartile Ranges; the whiskers show ranges. Dashed lines indicate the percentage of weekly positive samples (weeks in this figure are defined based on the MSOA data availability and may differ from the weeks of the study). * MSOAs (Middle Layer Super Output Areas) are a geographic hierarchy designed to improve the reporting of small area statistics in England and Wales. Source: MSOA level data extracted from https://coronavirus.data.gov.uk/details/download.

References

    1. European Centre for Disease Prevention and Control. COVID-19 in children and the role of school settings in transmission’—first update. Stockholm. 2020.
    1. Hyde Z. COVID‐19, children and schools: overlooked and at risk. Medical Journal of Australia. 2020. Nov;213(10):444–6. doi: 10.5694/mja2.50823 - DOI - PubMed
    1. Lewis D. Why schools probably aren’t COVID hotspots. Nature. 2020. Oct 29;587(7832):17. doi: 10.1038/d41586-020-02973-3 - DOI - PubMed
    1. Coronavirus Disease 2019 in Children—United States, February 12–April 2, 2020. MMWR Morb Mortal Wkly Rep 2020;69:422–426. doi: 10.15585/mmwr.mm6914e4 - DOI - PMC - PubMed
    1. COVID-19 National Incident Room Surveillance Team. COVID-19, Australia: Epidemiology Report 11 (Reporting week to 23:59 AEST 12 April 2020). Communicable diseases intelligence. 2020; 44. doi: 10.33321/cdi.2020.44.34 - DOI - PubMed

Publication types