. 2022 Jun 17;8(24):eabn4564.
doi: 10.1126/sciadv.abn4564. Epub 2022 Jun 17.

Female reproductive life span is extended by targeted removal of fibrotic collagen from the mouse ovary

Affiliations

Female reproductive life span is extended by targeted removal of fibrotic collagen from the mouse ovary

Takashi Umehara et al. Sci Adv. .

Abstract

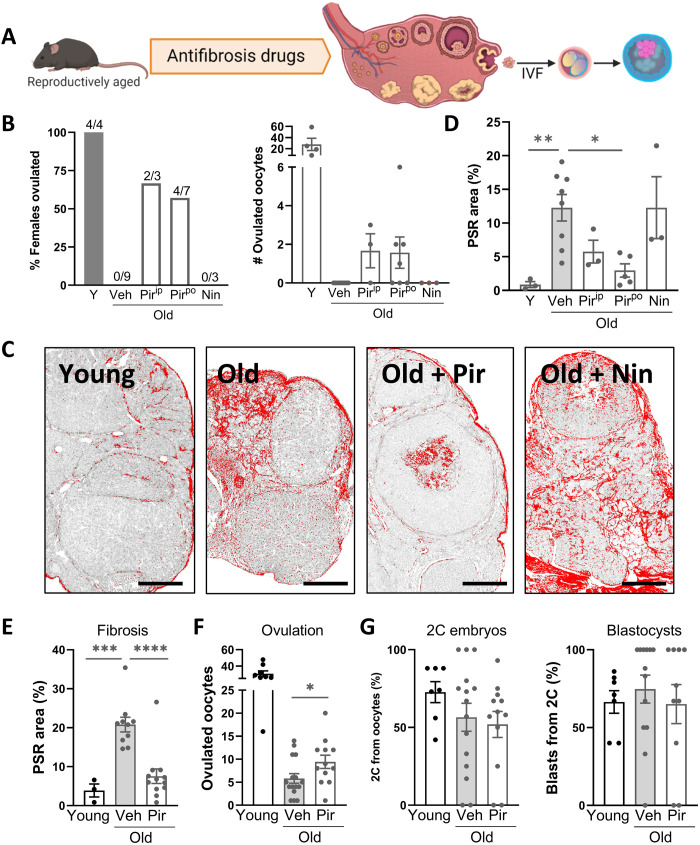
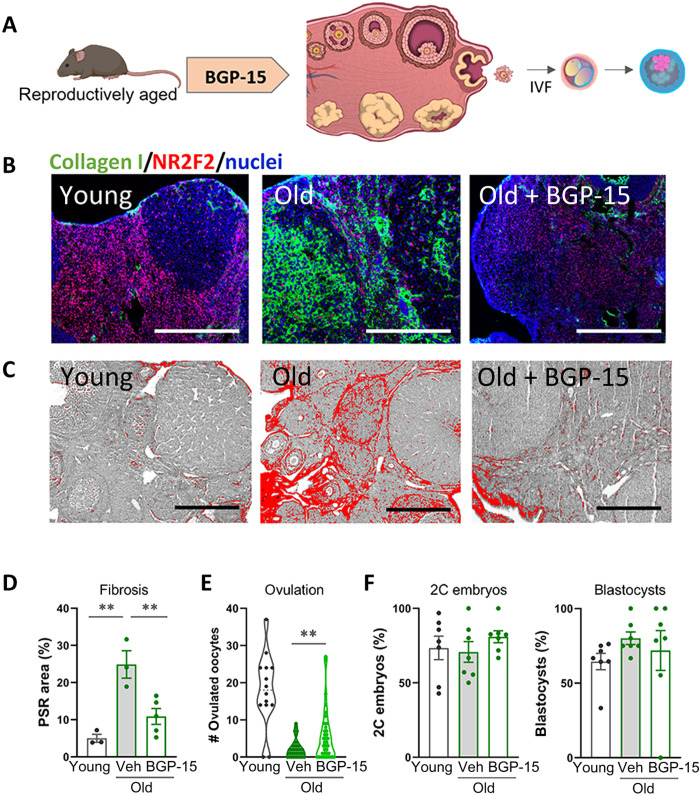
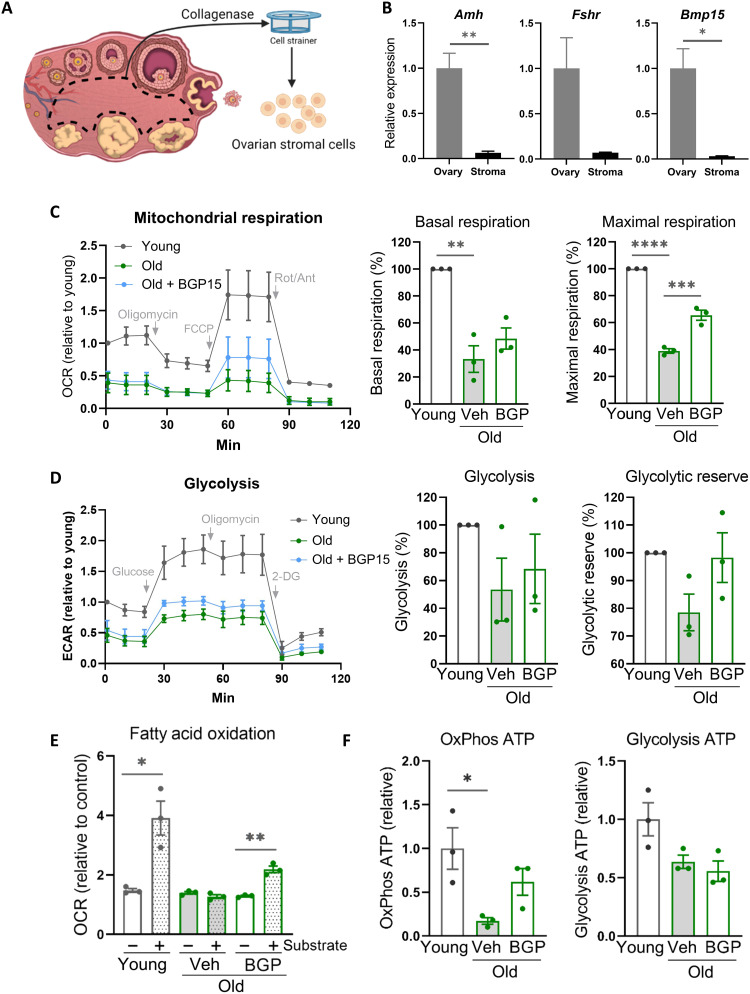
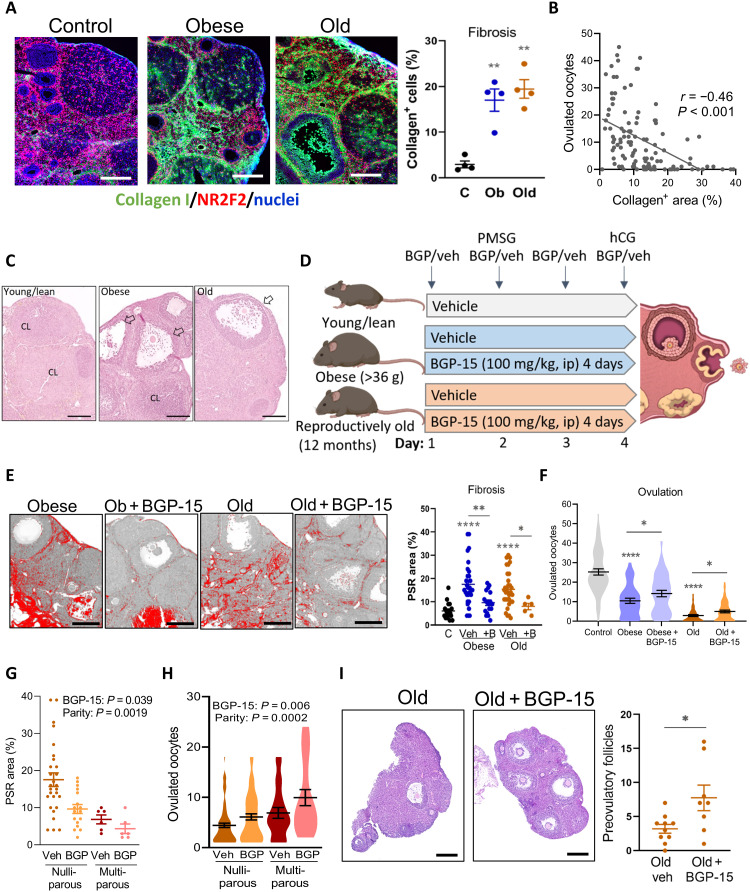
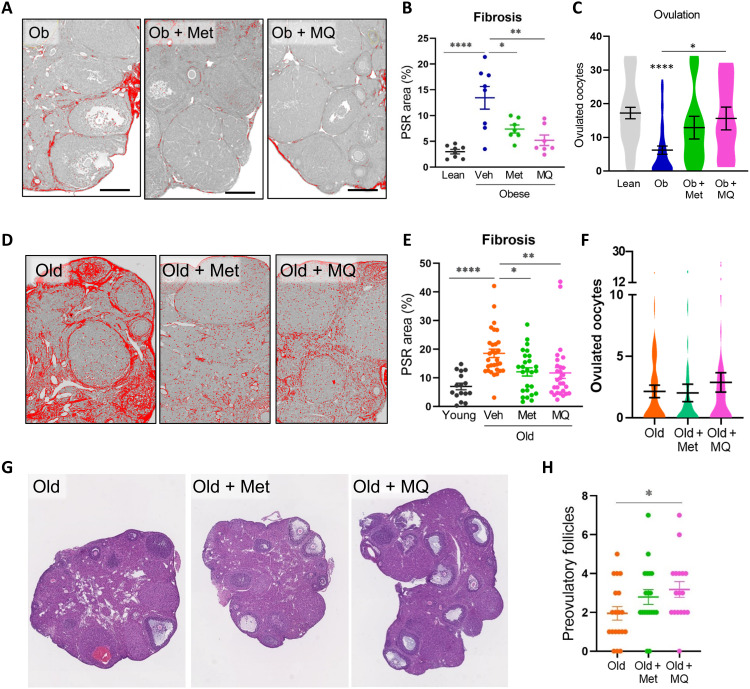
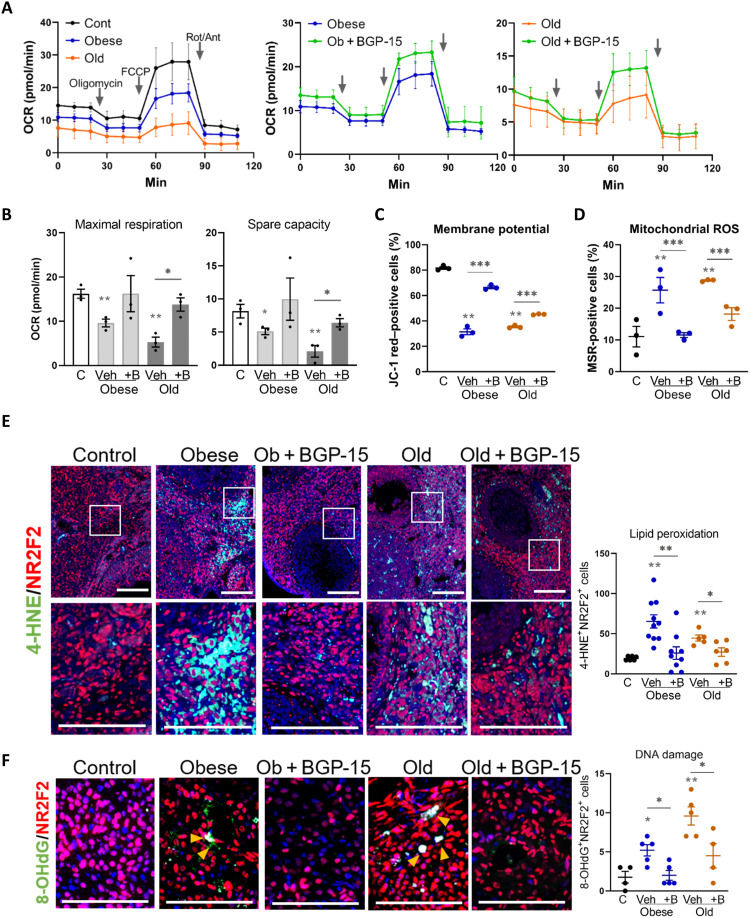
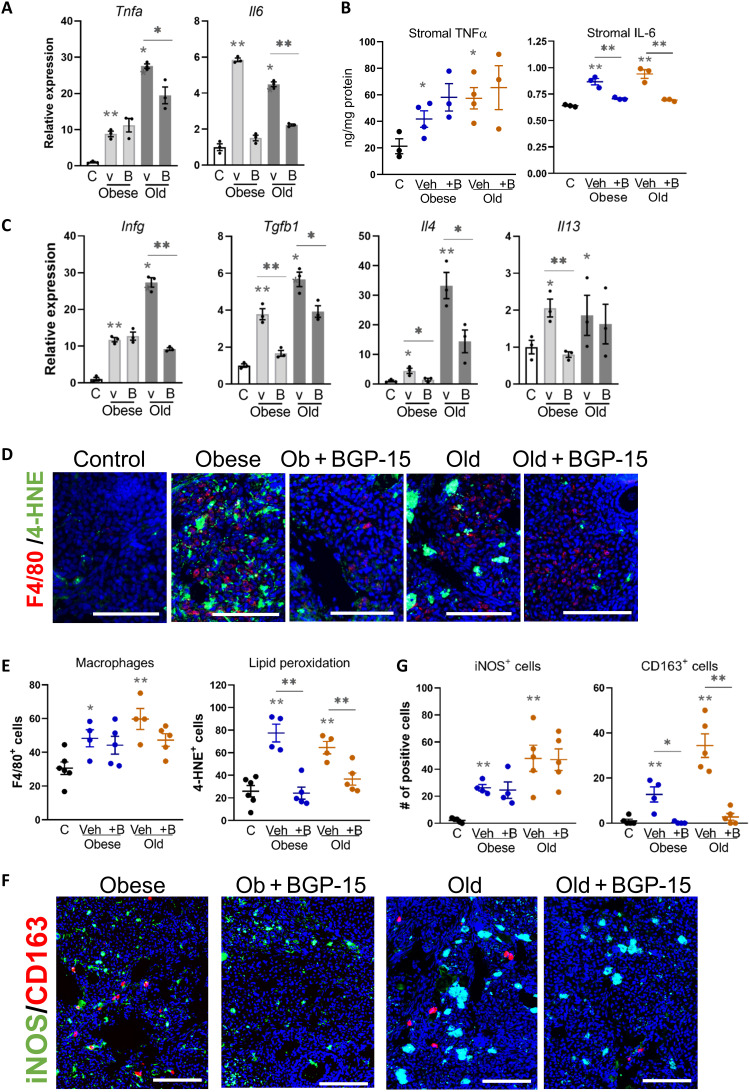
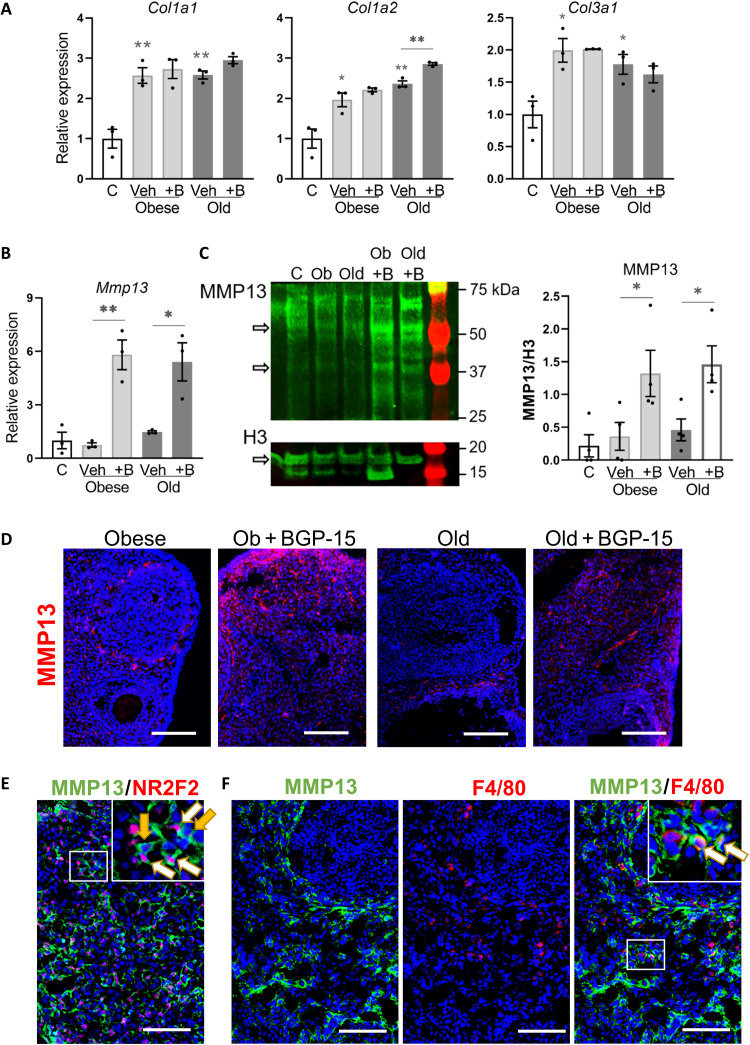
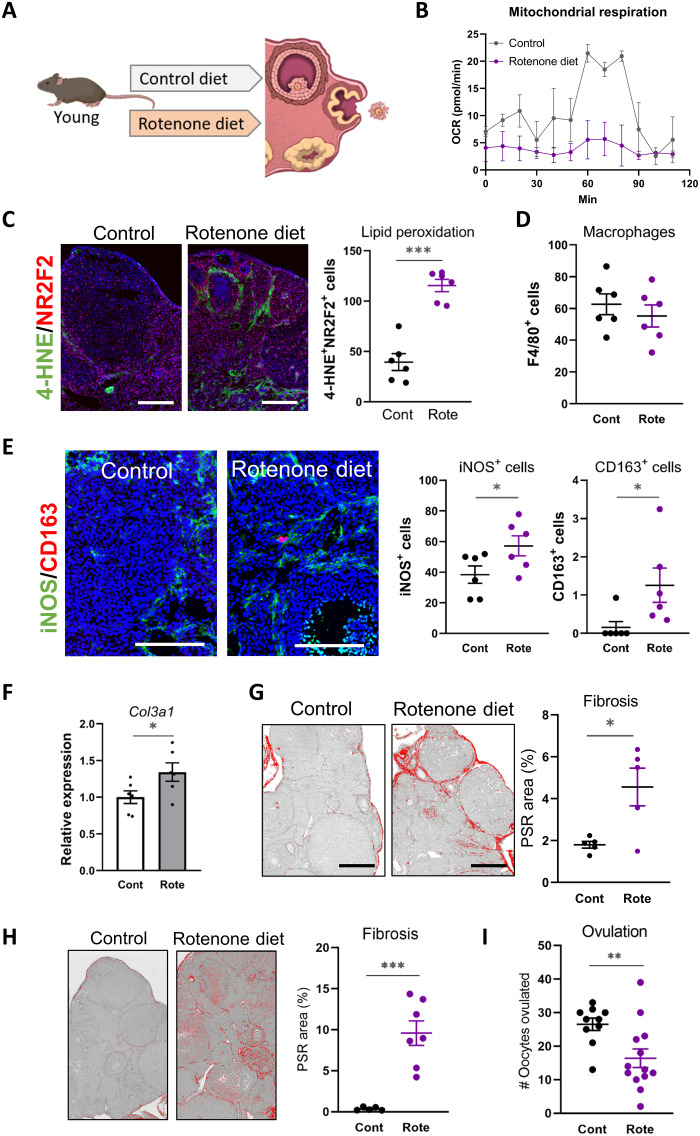
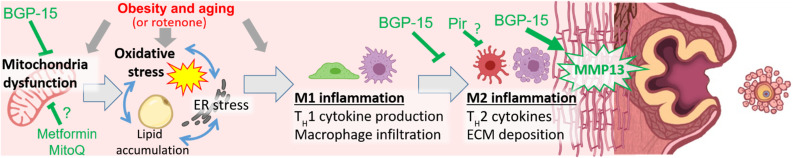
The female ovary contains a finite number of oocytes, and their release at ovulation becomes sporadic and disordered with aging and with obesity, leading to loss of fertility. Understanding the molecular defects underpinning this pathology is essential as age of childbearing and obesity rates increase globally. We identify that fibrosis within the ovarian stromal compartment is an underlying mechanism responsible for impaired oocyte release, which is initiated by mitochondrial dysfunction leading to diminished bioenergetics, oxidative damage, inflammation, and collagen deposition. Furthermore, antifibrosis drugs (pirfenidone and BGP-15) eliminate fibrotic collagen and restore ovulation in reproductively old and obese mice, in association with dampened M2 macrophage polarization and up-regulated MMP13 protease. This is the first evidence that ovarian fibrosis is reversible and indicates that drugs targeting mitochondrial metabolism may be a viable therapeutic strategy for women with metabolic disorders or advancing age to maintain ovarian function and extend fertility.


Figures

Fig. 1.
Fig. 1.. Pirfenidone reduces ovarian collagen and promotes ovulation in reproductively aged mice.
(A) Experimental design to test the effects of candidate antifibrosis drugs on ovarian collagen deposition, ovulation, and oocyte developmental competence. (B to D) Female mice (15 months old) were treated with pirfenidone via injection (250 mg/kg, ip; 4 days) or orally (500 mg/kg, po; 2 weeks) or with nintedinab (50 mg/kg, ip; 4 days) and compared to those treated with vehicle (Veh) and young (Y; 2 months old) controls. Following gonadotropin stimulation, ovaries and oviducts were dissected and ovulation was assessed in each female (B, left) (n = 3 to 9 females per group as indicated) and ovulated oocytes were counted (B, right). Ovarian fibrosis was measured by PSR staining of collagen (C and D). Scale bars, 200 μm. (E to G) Female mice (12 months old) were treated with pirfenidone orally (500 mg/kg; 2 weeks; n = 12) or vehicle (n = 16) alongside young controls (n = 8), and ovarian fibrosis was assessed by PSR strain (E). Ovulated oocytes were counted (F) and subjected to in vitro fertilization, and embryo development was monitored to the two-cell (2C) and blastocyst stage (G). Means ± SEM are shown. *P < 0.05, **P < 0.01, ***P < 0.001, and ****P < 0.0001 by one-way analysis of variance (ANOVA) (D, E, and G) or two-tailed t test (F) compared to vehicle-treated old mice.
Fig. 2.
Fig. 2.. BGP-15 reduces ovarian collagen and promotes ovulation in reproductively aged mice.
(A) Experimental design in which female mice were treated with BGP-15 (100 mg/kg; in drinking water for 2 weeks plus intraperitoneal injection for 4 days immediately before ovulation; n = 36) or vehicle (n = 35) alongside young controls (n = 14), followed by assessments of ovarian fibrosis, ovulation, and oocyte developmental competence. At 14 months of age, ovaries were collected following gonadotropin stimulation and fibrosis was measured in sections from n = 3 to 5 mice per group by immunohistochemistry for collagen type I (green) and stromal cell marker NR2F2 (red) plus 4′,6-diamidino-2-phenylindole (DAPI) nuclear counterstain (blue) (B) and PSR staining (C and D). Scale bars, 200 μm. Ovulated oocytes were counted in all mice (E), pooled into groups of three to six, and subjected to in vitro fertilization and embryo development monitored to the two-cell and blastocyst stage (F). Means ± SEM are shown. **P < 0.01 by one-way ANOVA (D and F) or two-tailed t test (E) compared to vehicle-treated old mice.
Fig. 3.
Fig. 3.. Ovarian stromal cells of reproductively aged mice exhibit deficient mitochondrial bioenergetics that is improved by BGP-15 treatment.
(A) Ovarian stromal cells are isolated by microdissection of follicles and corpora lutea from the ovary followed by digestion and filtration. Low expression of granulosa cell (Amh and Fshr) and oocyte (Bmp15) markers is verified (B). Ovarian stromal cells were isolated from mice that were young, old (14 months), or old and treated with BGP-15 (100 mg/kg for 2 weeks in drinking water plus intraperitoneal injection for 4 days immediately before ovulation) followed by assessment of mitochondrial respiration (C), glycolysis (D), fatty acid oxidation (E), and ATP levels (F). Values represent means ± SEM of n = 3 experimental replicates, each using four to six wells containing cells pooled from three to five mice. *P < 0.05, **P < 0.01, ***P < 0.001, and ****P < 0.0001 by two-tailed t test (B and E) or one-way ANOVA (C, D, and F) or compared to vehicle-treated old mice.
Fig. 4.
Fig. 4.. Obesity and aging cause ovarian fibrosis correlated with ovulation failure, which is mitigated by BGP-15 treatment.
(A) Left: Collagen localization in ovarian stroma of control (C), obese (Ob), and old mice using anti–collagen type I antibody (green) and anti-NR2F2 antibody (red). Scale bars, 200 μm. Right: Percentage of green (collagen) signal/ovarian stromal area. Means ± SEM of n = 4 ovaries (from four mice) per group. (B) Correlation (Pearson’s test) between fibrosis area and ovulation number in control, obese, and old mice; n = 111. (C) Representative hematoxylin and eosin histology showing corpora lutea (CL) and ovulatory yet unruptured follicles (arrows). Scale bars, 200 μm. (D) Experimental groups and treatments. (E) Representative PSR-stained ovarian sections. Scale bars, 200 μm. Fibrosis area quantified (right). Means ± SEM of ovaries from n = 5 to 32 mice per group. (F) Ovulation in young lean controls (n = 53), obese mice treated with saline vehicle (n = 39) or BGP-15 (n = 38), and old mice treated with vehicle (n = 54) or BGP-15 (n = 57). Means ± SEM shown within violin plot. (G) Collagen content (PSR stain) in ovaries from old mice that were nulliparous (n = 17 or 21) or multiparous (n = 6 each vehicle-treated and BGP-15–treated mice) and (H) ovulation in the same types of mice (n = 20 to 79 per group). Effects of parity and BGP-15 identified by two-way ANOVA. (I) Representative ovarian sections of old mice that did not ovulate and number of large preovulatory follicles (right). *P < 0.05, **P < 0.01, and ****P < 0.0001 by one-way ANOVA compared to controls or by two-tailed t test compared to vehicle-treated mice, as indicated. Scale bars, 200 μm.
Fig. 5.
Fig. 5.. Metformin and MitoQ reverse ovarian fibrosis in obese and reproductively old mice.
Obese (Ob) or reproductively old mice (12 months) were treated with metformin (Met) or MitoQ (MQ) via drinking water or untreated (Veh) and compared to lean/young (4 to 5 months old) controls. (A) Representative PSR-stained ovarian sections from obese mice and quantification of fibrosis area in the stroma (B). (C) Number of oocytes ovulated following gonadotropin stimulation of obese mice and controls. n = 35 (Lean), n = 42 (Obese), and n = 11 (Ob + Met and Ob + MQ). (D) Representative PSR-stained ovarian sections from old mice and quantification of stromal fibrosis area (E). (F) Number of oocytes ovulated in each group of reproductively old females. n = 44 (Old), n = 38 (Old + Met), and n = 44 (Old + MQ). Young females ovulated 21.0 ± 2.8 oocytes. (G) Preovulatory follicles were counted in ovarian sections of old females that failed to ovulate. (H) n = 19 (Old and Old + Met) and n = 17 (Old + MQ). Means ± SEM are shown. *P < 0.05, **P < 0.01, and ****P < 0.0001 by one-way ANOVA compared to lean/young controls or compared to untreated (Veh) mice as indicated (B, C, and E to G).
Fig. 6.
Fig. 6.. Mitochondrial dysfunction and oxidative stress in ovarian stroma with obesity or aging are recovered by BGP-15.
(A) Kinetics of oxygen consumption rate (OCR) in ovarian stromal cells from control mice or those that are obese or old and compared to those from mice treated with BGP-15 using the Seahorse XF Analyzer. Values represent means ± SEM of n = 3 experimental replicates, each using four to six wells containing cells pooled from three to five mice. (B) Maximal respiration and spare capacity calculated from OCR of ovarian stromal cells from control (C), obese, and old mice with/without BGP-15 (+B) treatment. (C) Percent of JC-1 red–positive (high mitochondrial membrane potential) ovarian stroma cells from control, obese, and old mice with/without BGP-15 treatment. (D) Percent of MitoSOX Red–positive ovarian stroma cells from control, obese, and old mice with/without BGP-15 treatment. (C and D) n = 3 replicates of cells pooled from four to six animals each and analyzed by flow cytometry. (E) Localization of oxidized lipid marker 4-HNE (green) in the ovarian stroma of obese and old mice treated with BGP-15 (or vehicle), colocalized with anti-NR2F2 stromal cell marker (red). The boxed area is shown in the bottom panel. Scale bars, 100 μm. Number of 4-HNE and NR2F2 double-positive cells in the ovarian stromal area (right). n = 5 to 10 mice per group. (F) Localization of oxidized DNA marker 8-OHdG (green) in the ovarian stroma of obese and old mice treated with BGP-15 (or vehicle), colocalized with anti-NR2F2 stromal cell marker (red). 8-OHdG and NR2F2 double-positive cells in the ovarian stromal area (right). n = 4 to 5 mice per group. (B to F) *P < 0.05, **P < 0.01, and ***P < 0.001 by one-way ANOVA compared to controls or by two-tailed t test between BGP-15–treated and vehicle-treated mice as indicated.
Fig. 7.
Fig. 7.. M1 and M2 inflammation are evident in ovarian stroma with obesity and aging, with M2 macrophage phenotype reduced in BGP-15–treated mice.
(A) Gene expression of inflammatory cytokines (Tnfa and Il6) in ovarian stromal cells of control (C), obese, and old mice treated with BGP-15 (B) or vehicle (v). Expression was normalized to L19 and was presented relative to controls. Values represent means ± SEM of n = 3 replicate pools of stromal cells from multiple mice. (B) TNFα and IL-6 (normalized to total protein) in ovarian stromal cells. Values represent means ± SEM of n = 3 to 4 replicate samples of material pooled from multiple mice. (C) Gene expression of Ifng and anti-inflammatory cytokines (Tgfb1, Il4, and Il13) in ovarian stromal cells from (A). (D) Localization of macrophages in the ovarian stroma using anti-F4/80 antibody (red; macrophages) and anti–4-HNE antibody (green; lipid peroxidation). Scale bars, 100 μm. (E) Numbers of F4/80+ (left) or 4-HNE+ (right) cells in the ovarian stroma. (F) Localization of iNOS (marker of M1 macrophage; green) and CD163 (marker of M2 macrophage; red) in ovarian stroma by immunohistochemistry. Scale bars, 100 μm. (G) Number of iNOS+ or CD163+ cells within the area of ovarian stroma. *P < 0.05 and **P < 0.01 by one-way ANOVA compared with controls or by two-tailed t test compared to vehicle-treated mice as indicated.
Fig. 8.
Fig. 8.. Increased MMP13 metalloprotease expression in ovarian stroma following BGP-15 treatment.
(A) Gene expression of collagen-encoding genes (Col1a1, Col1a2, and Col3a1) in ovarian stromal cells of control (C), obese, and old mice treated with BGP-15 (+B) or vehicle (veh). Expression was normalized to L19 and presented relative to controls. (B) Expression of MMP Mmp13 in the same samples. Values represent means ± SEM of n = 3 replicate pools of stromal cells from multiple mice. (C) Western blot of MMP13 in ovarian stromal cells of mice as above. Histone H3 is used as a loading control. Active MMP13-positive bands were 48 and 60 kDa. Histone H3–positive band was 17 kDa. Quantification of MMP13 Western blots (right) by measuring the intensity of MMP-13–specific bands normalized to H3. Values are means ± SEM of n = 4 replicate Western blots using different pools of stromal cells each collected from multiple mice. *P < 0.05 and **P < 0.01 by one-way ANOVA compared with controls or by two-tailed t test compared with vehicle-treated mice as indicated. (D) Representative sections showing localization of MMP13 in ovaries by immunohistochemistry using anti-MMP13 antibody (red) and DAPI (blue) nuclear counterstain. Scale bars, 100 μm. (E) Immunohistochemical colocalization of MMP13 (green) with stromal cell marker NR2F2 (red) in ovarian sections, with white arrows indicating MMP13 expression in NR2F2+ cells and yellow arrows indicating MMP13 expression in NR2F2 cells. (F) Immunohistochemical colocalization of MMP13 (green) with macrophage marker F4/80 (red) in ovarian sections, with white arrows indicating F4/80+ cells expressing MMP13. Inset images (E and F) are magnification of white boxed area Scale bars, 100 μm.
Fig. 9.
Fig. 9.. Rotenone diet induces fibrosis in the ovarian stroma.
(A) Schematic of experimental design with young lean mice administered with rotenone (150 ppm in diet; to disrupt oxidative phosphorylation) or matched control diet for 3 weeks (B to G) or 5 weeks (H and I), followed by gonadotropin treatment to induce ovulation. (B) Kinetics of OCR in ovarian stromal cells using the Seahorse XF Analyzer. Values represent means ± SEM of n = 2 replicate wells containing cells pooled from four mice. Scale bar, 200 μm. (C) Representative immunodetection of 4-HNE (oxidation marker; green) colocalized with stromal marker NR2F2 (red) in ovaries of mice fed rotenone (Rote) or matching control (Cont) diet, and quantification of double-positive cells (right). (D) Macrophages were localized by immunohistochemistry using anti-F4/80 antibody, and positive cells were counted. (E) Macrophage phenotyping in ovarian sections using anti-iNOS (M1 marker; green) and anti-CD163 (M2 marker; red), followed by quantification of each cell type (right). Scale bars, 200 μm. (F) Gene expression of Col3a1 in ovarian stroma. n = 6 samples of stromal cells from individual mice. (G) Representative PSR-stained ovarian sections from mice fed rotenone diet or control and quantification of fibrosis area (right). Values represent means ± SEM of ovaries from n = 5 mice per group. Scale bars, 200 μm. (H) Representative PSR-stained ovarian sections from mice fed rotenone diet or control (for 5 weeks) and quantification of fibrosis area (right). Values represent means ± SEM of ovaries from n = 5 or n = 7 mice per group. (I) Number of ovulated oocytes in mice fed rotenone diet or control for 5 weeks. Values represent means ± SEM of n = 10 or n = 13 mice per group. *P < 0.05, **P < 0.01, and ***P < 0.001 by two-tailed t test.
Fig. 10.
Fig. 10.. Summary of findings and proposed mechanisms that cause fibrosis in the ovary and that can be targeted to remove excess collagen and promote ovulation.
Mitochondrial dysfunction (as occurs with obesity, aging, or rotenone toxicant) is linked to a cascade of intracellular stress pathways within the ovarian stroma, particularly oxidative stress, which trigger proinflammatory (M1) and anti-inflammatory (M2) responses resulting in fibrotic collagen deposition (vertical red line pattern). BGP-15 treatment of obese or reproductively old female mice improves mitochondrial activity in ovarian stromal cells, reduces oxidative stress, and dampens M2 inflammation. BGP-15 treatment also results in MMP13 protease induction, collagen removal, and improved oocyte release. Mice treated with pirfenidone (Pir), metformin, or MitoQ also exhibit reduced ovarian fibrosis, but whether the mechanisms are identical to those of BGP-15 remains to be determined.

References

    1. Heffner L. J., Advanced maternal age—How old is too old? N. Engl. J. Med. 351, 1927–1929 (2004). - PubMed
    1. Broekmans F. J., Soules M. R., Fauser B. C., Ovarian aging: Mechanisms and clinical consequences. Endocr. Rev. 30, 465–493 (2009). - PubMed
    1. Faddy M. J., Gosden R. G., Gougeon A., Richardson S. J., Nelson J. F., Accelerated disappearance of ovarian follicles in mid-life: Implications for forecasting menopause. Hum. Reprod. 7, 1342–1346 (1992). - PubMed
    1. McCloskey C. W., Cook D. P., Kelly B. S., Azzi F., Allen C. H., Forsyth A., Upham J., Rayner K. J., Gray D. A., Boyd R. W., Murugkar S., Lo B., Trudel D., Senterman M. K., Vanderhyden B. C., Metformin abrogates age-associated ovarian fibrosis. Clin. Cancer Res. 26, 632–642 (2020). - PubMed
    1. Amargant F., Manuel S. L., Tu Q., Parkes W. S., Rivas F., Zhou L. T., Rowley J. E., Villanueva C. E., Hornick J. E., Shekhawat G. S., Wei J. J., Pavone M. E., Hall A. R., Pritchard M. T., Duncan F. E., Ovarian stiffness increases with age in the mammalian ovary and depends on collagen and hyaluronan matrices. Aging Cell 19, e13259 (2020). - PMC - PubMed