. 2022 Jun 17;8(24):eabm4937.
doi: 10.1126/sciadv.abm4937. Epub 2022 Jun 17.

The phagocytic cyst cells in Drosophila testis eliminate germ cell progenitors via phagoptosis

Affiliations

The phagocytic cyst cells in Drosophila testis eliminate germ cell progenitors via phagoptosis

Maayan Zohar-Fux et al. Sci Adv. .

Abstract

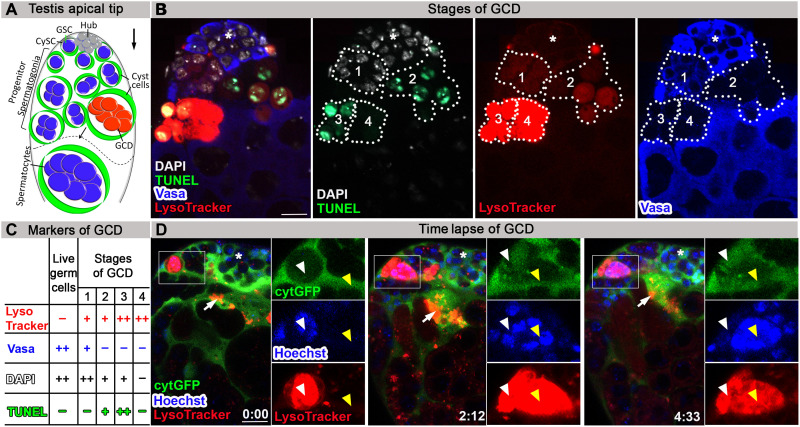
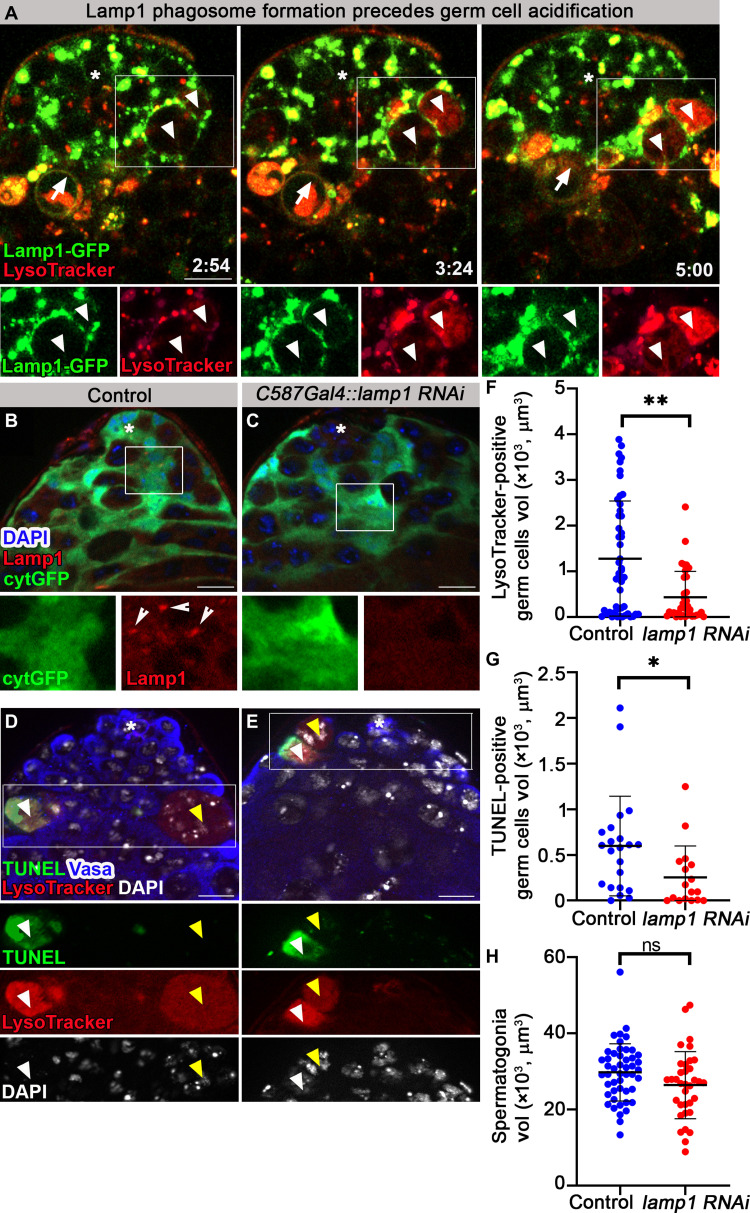
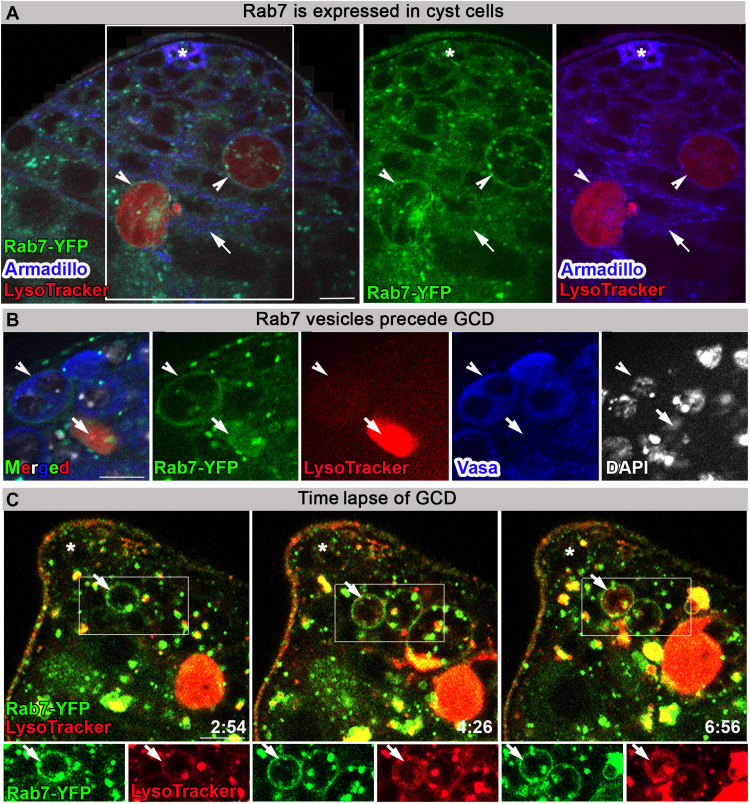
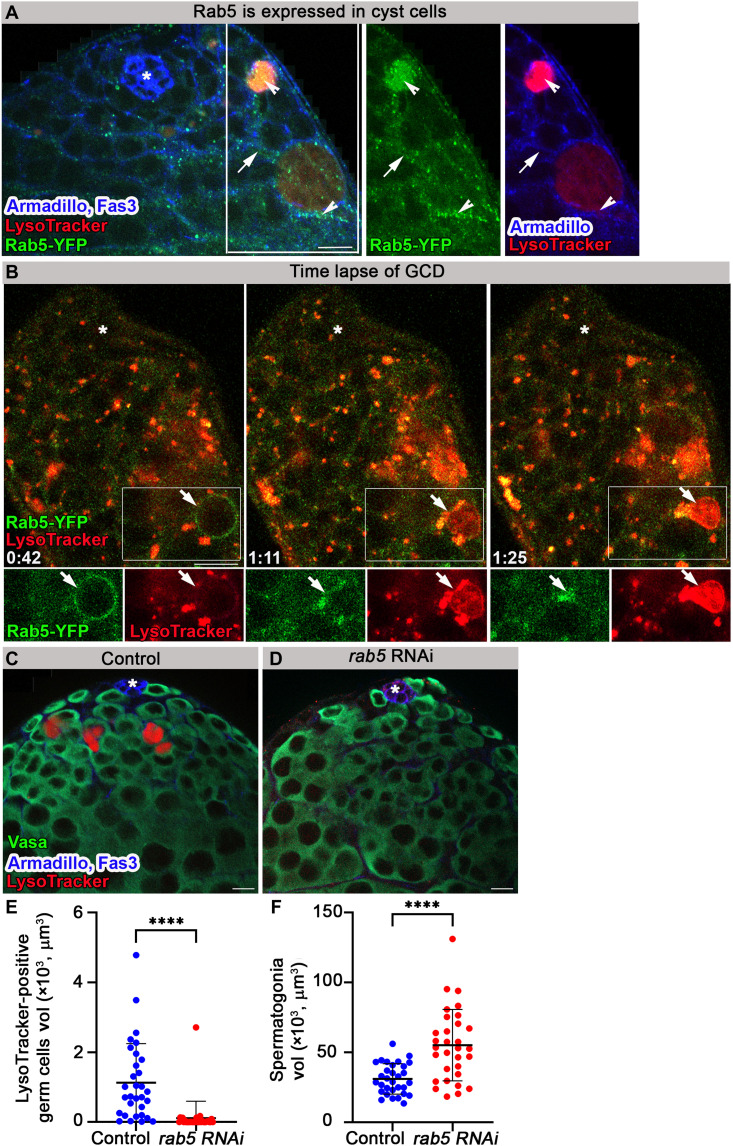
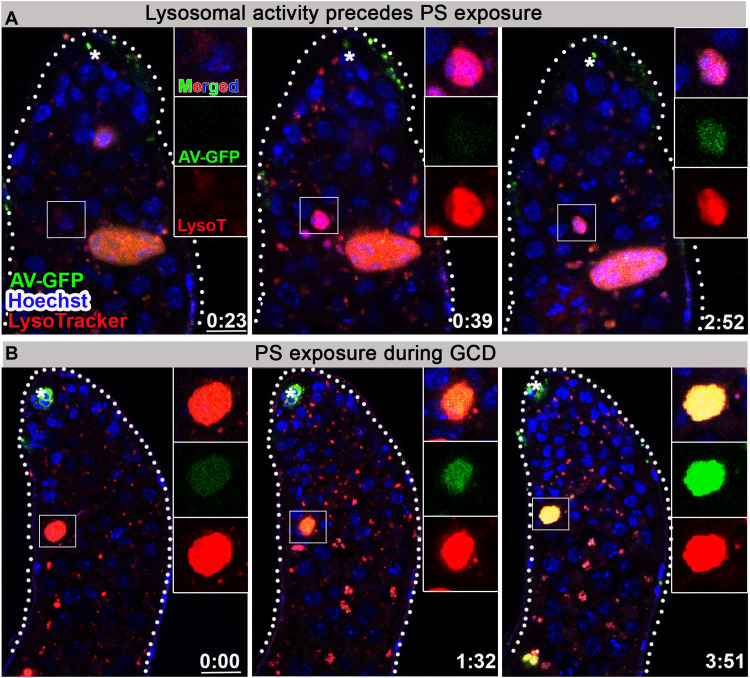
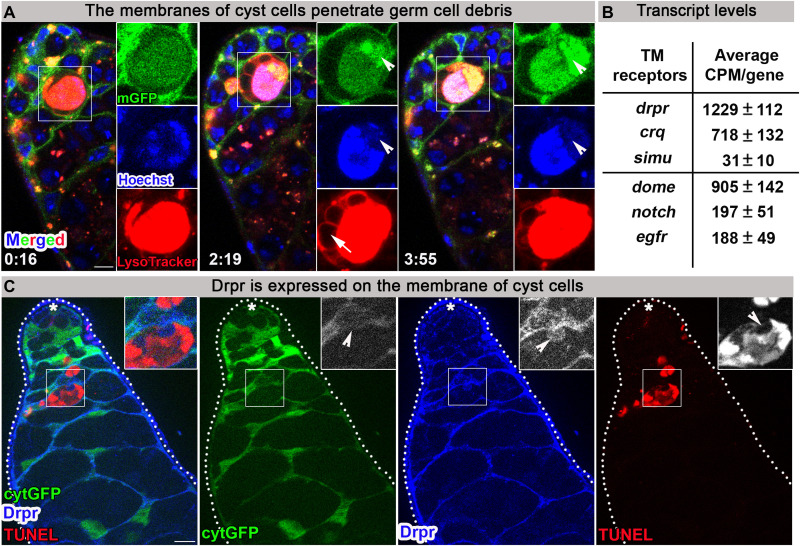
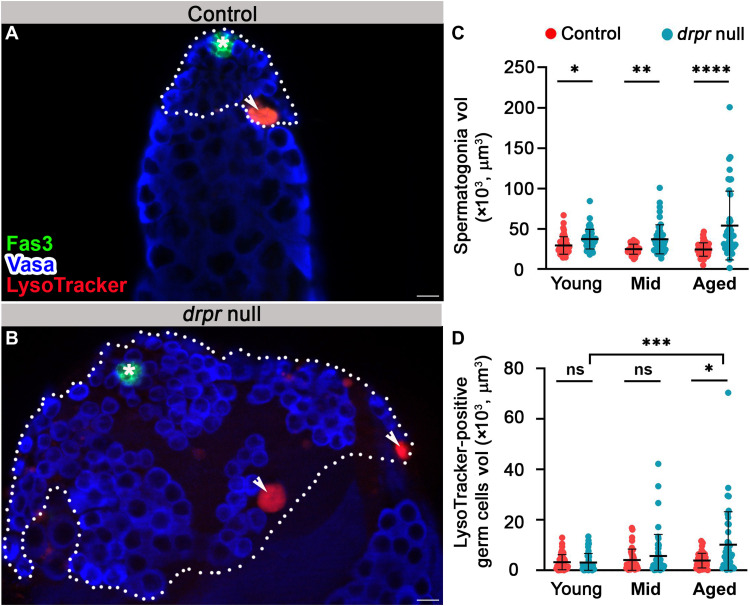
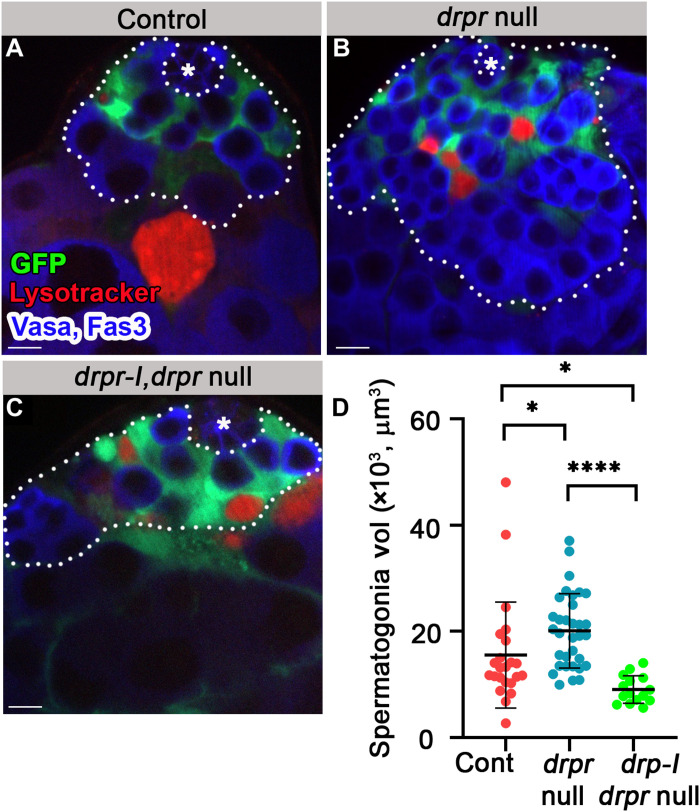
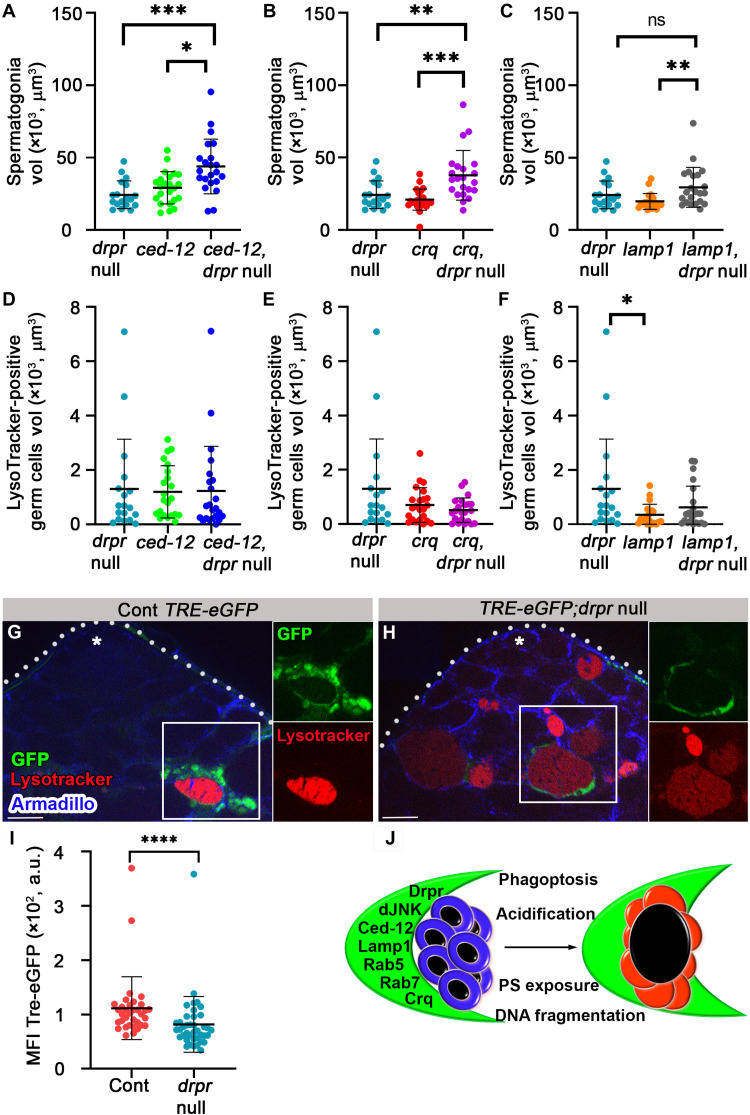
Phagoptosis is a frequently occurring nonautonomous cell death pathway in which phagocytes eliminate viable cells. While it is thought that phosphatidylserine (PS) "eat-me" signals on target cells initiate the process, the precise sequence of events is largely unknown. Here, we show that in Drosophila testes, progenitor germ cells are spontaneously removed by neighboring cyst cells through phagoptosis. Using live imaging with multiple markers, we demonstrate that cyst cell-derived early/late endosomes and lysosomes fused around live progenitors to acidify them, before DNA fragmentation and substantial PS exposure on the germ cell surface. Furthermore, the phagocytic receptor Draper is expressed on cyst cell membranes and is necessary for phagoptosis. Significantly, germ cell death is blocked by knockdown of either the endosomal component Rab5 or the lysosomal associated protein Lamp1, within the cyst cells. These data ascribe an active role for phagocytic cyst cells in removal of live germ cell progenitors.


Figures

Fig. 1.
Fig. 1.. Lysosomal activity precedes DNA fragmentation in dying germ cells.
(A) Schematic representation of the apical tip of the testis (side view). GSCs (blue) intermingle with cyst stem cells (CySCs; green) around the hub (gray). Spermatogonia germ cells (blue) are transit-amplified progenitor cells encapsulated by cyst cells (green). About one-quarter of spermatogonia undergo GCD (red). The dashed line separates spermatogonia from terminally differentiated spermatocytes. The differentiation axis (arrow) runs from the apical (stem cell niche) to the basal end (sperm maturation). (B) Representative wild-type testis (w1118, 2 days old, n = 49) immunostained for TUNEL (green, fragmented DNA), DAPI (white, DNA), LysoTracker (red, lysosomal activity), and Vasa (blue, germ cells). Different combination of the markers appears in four stages of GCD progression. Note the lysosomal activity at stage 1 without TUNEL and with Vasa staining. (C) Summary of the markers that appear in live germ cells and in the four stages of GCD. (D) Snapshots of live-imaged testis, marked with LysoTracker (red), Hoechst (blue, nuclei), and GFP (cyst cells, c587Gal4;UAS-cytGFP). Time (hour:min) is shown on the bottom middle of the images. Note rectangles and blown-up insets highlighting two adjacent GCD events, marked with yellow and white arrowheads. White arrowheads mark GCD event that is completely degraded within a cyst cell within ~2 hours. Yellow arrowheads mark GCD event that begins after ~2 hours with the onset of LysoTracker, depicting packed DNA in separate nuclei that are further involuted into one bundle. Arrows mark cyst cell containing LysoTracker-positive debris, asterisks mark the hub, and scale bars correspond to 10 μm.
Fig. 2.
Fig. 2.. Cyst cell–derived Lamp1-containing lysosomes acidify germ cells.
(A) Snapshots of live-imaged testis expressing Lamp1-GFP in cyst cells (green, c587Gal4;UAS-lamp1-GFP) and marked with LysoTracker (red). Time (hour:min) is shown on the bottom right of the images. Bottom images (single-channel views of the boxed regions) highlight Lamp1-GFP–positive phagosomes around two adjacent live spermatogonia (white arrowheads) that are gradually filled with LysoTracker. A phagosome (arrow) containing LysoTracker-positive debris is faded away after ~5 hours, when debris is degraded. (B and C) Immunofluorescence images of testes from control flies expressing cytGFP in cyst cells [(B) c587Gal4;UAS-cytGFP] and a lamp1 RNAi transgene [(C) c587Gal4;UAS-cytGFP,UAS- lamp1 RNAi] stained for Lamp1 (red) and DAPI (blue). Bottom images are high-magnification views of the boxed regions, highlighting Lamp1 expression in cyst cells of control [(B) arrowheads] and lamp1 RNAi (C). (D and E) Testes of control [(D) c587Gal4 outcrossed to w1118, n = 48] and a lamp1 RNAi transgene expressed in cyst cells [(E) c587-Gal4,UAS- lamp1 RNAi, n = 35] were stained for Vasa and Fas3 (blue, germ and hub cells), TUNEL (green), LysoTracker (red), and DAPI (white). Bottom images (single-channel views of the boxed regions) highlighting GCD events at stage 1, positive for LysoTracker and DAPI but negative for TUNEL (yellow arrowheads), or positive for LysoTracker and TUNEL and negative for DAPI (white arrowheads). (F to H) Quantification of the volume of LysoTracker-positive germ cells (F), TUNEL-positive germ cells (G), and live spermatogonia cells (H) as measured with Imaris (control, blue dots; and lamp1 RNAi, red dots). Note the significant reduction in GCD in testes of lamp1 RNAi–expressing flies (F and G) and no significant change in spermatogonia volume (H). Statistical significance was determined by a Mann-Whitney test, *P ≤ 0.05, **P ≤ 0.01. ns, not significant. Asterisks mark the hub, and scale bars correspond to 10 μm.
Fig. 3.
Fig. 3.. Rab7-containing late endosomes appear before GCD.
(A) Immunofluorescence images of testis from flies expressing YFP at endogenous chromosomal locus of rab7 (green, Rab7-YFP) labeled with LysoTracker (red) and Armadillo (blue, cyst and hub cells). Arrow marks Rab7 expression in cyst cells. Arrowheads mark Rab7 expression around dying germ cells. (B) Immunofluorescence images of Rab7-YFP (green) testis labeled with LysoTracker (red), Vasa (blue, live germ cells), and DAPI (white). Arrowhead marks Rab7-YFP phagosome around live germ cells expressing Vasa, and arrow marks germ cell debris with strong LysoTracker signal and no Vasa staining. (C) Snapshots of live-imaged testis from Rab7-YFP (green) marked with LysoTracker (red). Time (hour:min) is shown on the bottom right of the images. Bottom images are high-magnification views of the boxed regions, highlighting late endosomes (arrow) surrounding live germ cells that are gradually filled with LysoTracker. Asterisks mark the hub, and scale bars correspond to 10 μm.
Fig. 4.
Fig. 4.. Rab5-containing early endosomes are necessary for GCD.
(A) Immunofluorescence images of testis from flies expressing YFP at endogenous chromosomal locus of rab5 (green, Rab5-YFP) labeled with LysoTracker (red) and Armadillo (blue, cyst and hub cells). Arrow marks Rab5 expression in cyst cells. Arrowheads mark Rab5 expression around and in dying germ cells. (B) Snapshots of live-imaged testis from Rab5-YFP–expressing flies (green) marked with LysoTracker (red). Insets are high-magnification views of boxed areas, highlighting early endosomes surrounding live germ cells, which are gradually filled with LysoTracker. Time (hour:min) is shown on the bottom left of the images. (C to F) Testes of 3-day control [(C) c587Gal4;Gal80TS outcrossed to w1118, n = 31] and a rab5 RNAi transgene expressed in cyst cells of adult males by TARGET driver [(D) c587Gal4;Gal80TS,UAS-rab5RNAi, n = 31] were stained for Armadillo and Fas3 (blue, cyst cells and hub, respectively), Vasa (green, germ cells), and LysoTracker (red). Quantification of the volume of LysoTracker-positive germ cells (E) and live spermatogonia cells (F) as measured with Imaris (control, blue dots and rab5 RNAi, red dots). Note significant reduction in GCD in testes of rab5 RNAi–expressing flies. Statistical significance was determined by a Mann-Whitney test, ****P ≤ 0.0001. Asterisks mark the hub, and scale bars correspond to 10 μm.
Fig. 5.
Fig. 5.. PS is exposed by dying germ cells after lysosomal activity.
(A and B) Snapshots of live-imaged testes, labeled with LysoTracker (red), Hoechst (blue, nuclei), and AV-GFP expressed in and secreted from hub cells (green, updGal4;UAS-AV-GFP; hub cells are indicated by asterisk). Insets are high-magnification views of boxed regions highlighting progression of GCD. (A) Live germ cell marked only by Hoechst first becomes positive for lysosomal activity and only after ~2 hours are labeled by AV-GFP indicating PS exposure. (B) AV-GFP signal of PS exposure accumulates and progresses for ~4 hours. Time (hour:min) is shown on the bottom right of the images, and scale bars correspond to 10 μm.
Fig. 6.
Fig. 6.. The phagocytic transmembrane receptor Drpr is expressed in cyst cells.
(A) Snapshots of live-imaged testis, marked with LysoTracker (red), Hoechst (blue, nuclei), and a membrane-targeted mGFP (cyst cells, c587Gal4;UAS-mGFP). Insets are high-magnification views of boxed regions, highlighting progression of GCD. Arrowheads mark membrane accumulation in DNA degradation domain. Arrow marks LysoTracker-free blebs surrounding dying germ cell. Time (hour:min) is shown on the bottom left of the images. (B) mRNA levels of six transmembrane (TM) receptors analyzed from the transcriptome of cDNA libraries prepared from RNA samples (four biological repeats) extracted from testes of wild-type young males (2 days old). Shown are transcript levels of three phagocytic TM receptors [drpr, simu, and crq (upper)] and three TM receptors previously reported as expressed in the apical tip of the testis [dome, notch, and egfr (lower)]. (C) The apical tip of a testis that expresses cytGFP in cyst cells (green, c587Gal4;UAS-cytGFP), immunostained for Drpr (blue) and TUNEL (red, dying germ cells). Insets are high-magnification views of boxed regions, highlighting how the cyst cell membrane expressing Drpr protrudes into dying germ cell (arrowheads). Asterisks mark the hub, and scale bars correspond to 10 μm.
Fig. 7.
Fig. 7.. Hyperplasia of progenitor germ cells and attenuated degradation in testes of drpr-null males.
(A and B) Representative images of the apical tip of testes from 7-day-old males of control [(A) w1118] and drpr-null flies (B). Testes were immunostained for Fas3 (green, hub), Vasa (blue, germ cells), and LysoTracker (red, dying germ cells). The white dashed line delineates spermatogonia cells. Asterisks mark the hub, arrowheads mark LysoTracker-positive germ cells, and scale bars correspond to 10 μm. (C and D) Quantification of the volume of live spermatogonia cells (C) and LysoTracker-positive germ cells (D) as measured with Imaris in control (red dots, w1118) and drpr null (blue dots). Young: control (n = 48) and drpr null (n = 49); mid-aged: control (n = 42) and drpr null (n = 48); and aged: control (n = 47) and drpr null (n = 41). Note the age-dependent increases in hyperplasia and volume of germ cell debris only in drpr null samples. Statistical significance was determined by a Kruskal-Wallis test; *P ≤ 0.05, **P ≤ 0.01, ***P ≤ 0.001, and ****P ≤ 0.0001; ns, not significant.
Fig. 8.
Fig. 8.. Drpr-I expression in the cyst cells of drpr-null flies rescues hyperplasia.
(A to D) Testes from 7-day-old control [(A) c587Gal4;UAS-cytGFP;drpr null/TM6, n = 23], drpr null [(B) c587Gal4;UAS-cytGFP;drpr null, n = 33], and drpr-I, drpr null [(C) c587Gal4;UAS-cytGFP,UAS-drpr-I;drpr null, n = 15] males. Testes expressing GFP in cyst cells (green) immunostained for Fas3 and Vasa (blue, hub and germ cells) and LysoTracker (red, dying germ cells). The white dashed line delineates spermatogonia cells. Asterisks mark the hub, and scale bars correspond to 10 μm. (D) Quantification of the volume of spermatogonia cells as measured with Imaris. Note that drpr-I expression in cyst cells rescues the hyperplasia of drpr-null flies. Statistical significance was determined by a Kruskal-Wallis test; *P ≤ 0.05 and ****P ≤ 0.0001.
Fig. 9.
Fig. 9.. drpr acts in parallel with ced12 and crq and upstream of lamp1 and dJNK in cyst cells during phagoptosis.
(A to F) Quantification of the volume of live spermatogonia cells (A to C) and LysoTracker-positive germ cells (D to F) as measured with Imaris in testes from drpr null (c587Gal4;UAS-cytGFP/CyO;drpr null, n = 18), ced-12 RNAi (c587-Gal4;UAS-cytGFP/UAS-ced-12 RNAi; drpr null/TM2, n = 23), ced-12 RNAi and drpr-null double mutants (c587-Gal4;UAS-cytGFP/UAS-ced-12 RNAi; drpr null, n = 22), crq RNAi (c587-Gal4;UAS-cytGFP/UAS-crq RNAi; drpr null/TM2, n = 23), crq RNAi and drpr-null double mutants (c587-Gal4;UAS-cytGFP/UAS-crq RNAi; drpr null, n = 22), lamp1 RNAi (c587-Gal4;UAS-cytGFP/UAS-lamp1 RNAi; drpr null/TM2, n = 21), and lamp1 RNAi and drpr-null double mutants (c587-Gal4;UAS-cytGFP/UAS-lamp1 RNAi; drpr null, n = 22). Note that drpr acts in parallel with ced-12 and crq in engulfment and upstream of lamp1. Statistical significance was determined by a Kruskal-Wallis test; *P ≤ 0.05, **P ≤ 0.01, and ***P ≤ 0.001. (G and H) Expression of TRE-eGFP reporter in wild-type (G) and drpr-null testes (H) labeled with LysoTracker (red) and immunostained for Armadillo (blue, cyst cells). Insets are views of single channels of boxed regions. Asterisks mark the hub, and scale bars correspond to 10 μm. (I) The mean fluorescence intensity (MFI) of GFP signal quantification (n = 42 regions of germ cell debris in each genotype) is shown. Note the reduced GFP signal in the testis of drpr-null animals. Statistical significance was determined by a Mann-Whitney test, ****P ≤ 0.0001. (J) Schematic summarizing how cyst cells (green) induce phagoptosis of live germ cells (blue, left) resulting in lysosomal activity, DNA fragmentation, and PS exposure in germ cells (red, right).

References

    1. Galluzzi L., Vitale I., Aaronson S. A., Abrams J. M., Adam D., Agostinis P., Alnemri E. S., Altucci L., Amelio I., Andrews D. W., Annicchiarico-Petruzzelli M., Antonov A. V., Arama E., Baehrecke E. H., Barlev N. A., Bazan N. G., Bernassola F., Bertrand M. J. M., Bianchi K., Blagosklonny M. V., Blomgren K., Borner C., Boya P., Brenner C., Campanella M., Candi E., Carmona-Gutierrez D., Cecconi F., Chan F. K. M., Chandel N. S., Cheng E. H., Chipuk J. E., Cidlowski J. A., Ciechanover A., Cohen G. M., Conrad M., Cubillos-Ruiz J. R., Czabotar P. E., D’Angiolella V., Dawson T. M., Dawson V. L., de Laurenzi V., de Maria R., Debatin K. M., DeBerardinis R. J., Deshmukh M., di Daniele N., di Virgilio F., Dixit V. M., Dixon S. J., Duckett C. S., Dynlacht B. D., el-Deiry W. S., Elrod J. W., Fimia G. M., Fulda S., García-Sáez A. J., Garg A. D., Garrido C., Gavathiotis E., Golstein P., Gottlieb E., Green D. R., Greene L. A., Gronemeyer H., Gross A., Hajnoczky G., Hardwick J. M., Harris I. S., Hengartner M. O., Hetz C., Ichijo H., Jäättelä M., Joseph B., Jost P. J., Juin P. P., Kaiser W. J., Karin M., Kaufmann T., Kepp O., Kimchi A., Kitsis R. N., Klionsky D. J., Knight R. A., Kumar S., Lee S. W., Lemasters J. J., Levine B., Linkermann A., Lipton S. A., Lockshin R. A., López-Otín C., Lowe S. W., Luedde T., Lugli E., MacFarlane M., Madeo F., Malewicz M., Malorni W., Manic G., Marine J. C., Martin S. J., Martinou J. C., Medema J. P., Mehlen P., Meier P., Melino S., Miao E. A., Molkentin J. D., Moll U. M., Muñoz-Pinedo C., Nagata S., Nuñez G., Oberst A., Oren M., Overholtzer M., Pagano M., Panaretakis T., Pasparakis M., Penninger J. M., Pereira D. M., Pervaiz S., Peter M. E., Piacentini M., Pinton P., Prehn J. H. M., Puthalakath H., Rabinovich G. A., Rehm M., Rizzuto R., Rodrigues C. M. P., Rubinsztein D. C., Rudel T., Ryan K. M., Sayan E., Scorrano L., Shao F., Shi Y., Silke J., Simon H. U., Sistigu A., Stockwell B. R., Strasser A., Szabadkai G., Tait S. W. G., Tang D., Tavernarakis N., Thorburn A., Tsujimoto Y., Turk B., vanden Berghe T., Vandenabeele P., Vander Heiden M. G., Villunger A., Virgin H. W., Vousden K. H., Vucic D., Wagner E. F., Walczak H., Wallach D., Wang Y., Wells J. A., Wood W., Yuan J., Zakeri Z., Zhivotovsky B., Zitvogel L., Melino G., Kroemer G., Molecular mechanisms of cell death: Recommendations of the nomenclature committee on cell death 2018. Cell Death Differ. 25, 486–541 (2018). - PMC - PubMed
    1. Shklover J., Levy-Adam F., Kurant E., Apoptotic cell clearance in development. Curr. Top. Dev. Biol. 114, 297–334 (2015). - PubMed
    1. Elliott M. R., Ravichandran K. S., The dynamics of apoptotic cell clearance. Dev. Cell 38, 147–160 (2016). - PMC - PubMed
    1. Brown G. C., Vilalta A., Fricker M., Phagoptosis - Cell death by phagocytosis – Plays central roles in physiology, host defense and pathology. Curr. Mol. Med. 15, 842–851 (2015). - PubMed
    1. Brown G. C., Neher J. J., Eaten alive! Cell death by primary phagocytosis: ‘Phagoptosis’. Trends Biochem. Sci. 37, 325–332 (2012). - PubMed

Substances

LinkOut - more resources