

The Origin and Evolution of RNase T2 Family and Gametophytic Self-incompatibility System in Plants
- PMID: 35714207
- PMCID: PMC9250077
- DOI: 10.1093/gbe/evac093
The Origin and Evolution of RNase T2 Family and Gametophytic Self-incompatibility System in Plants
Abstract
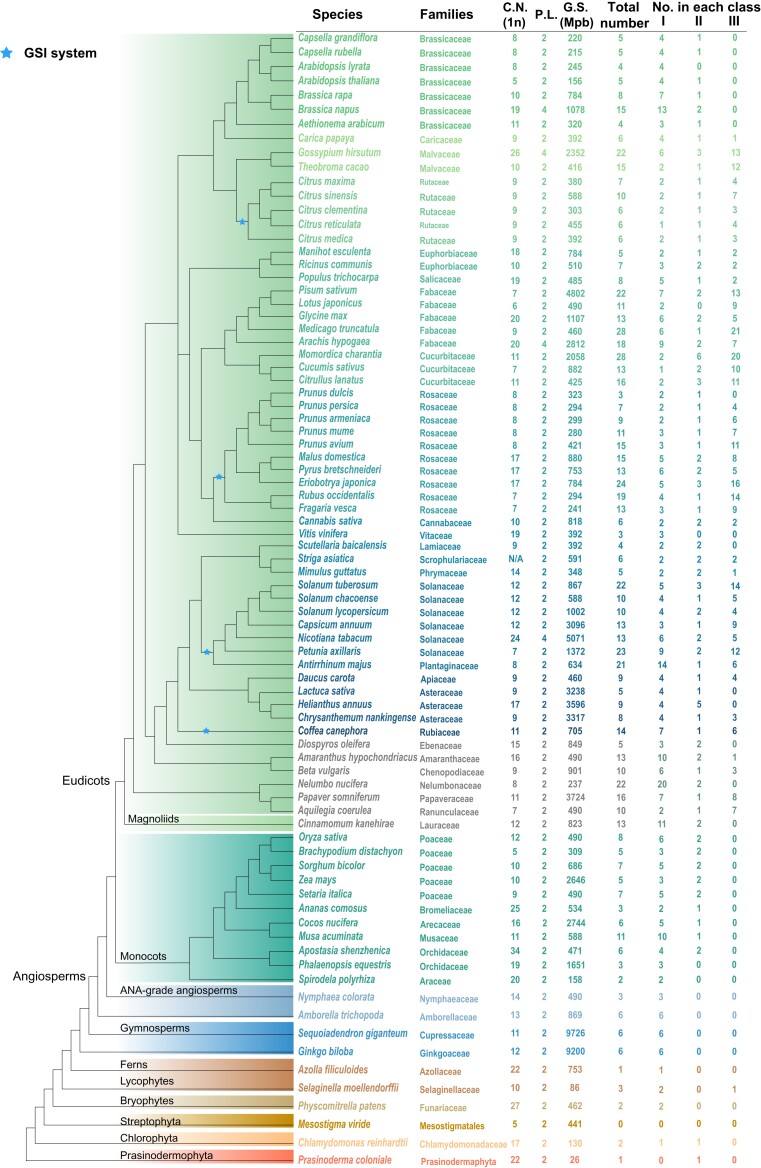
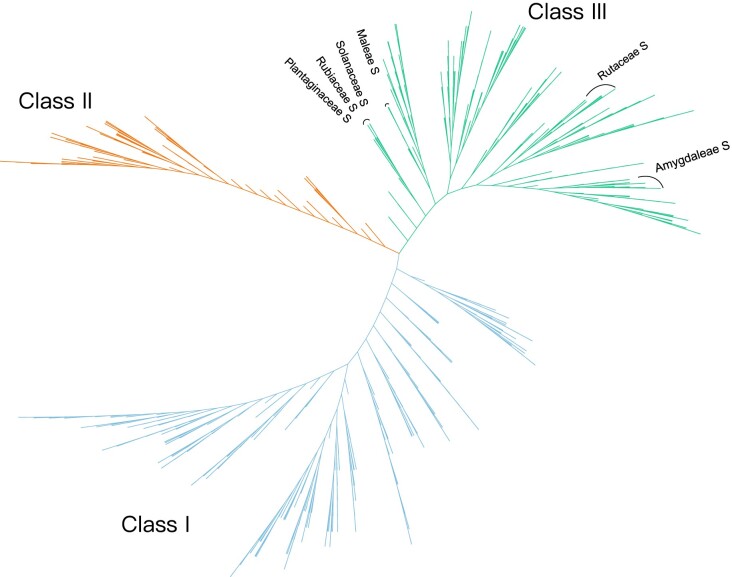
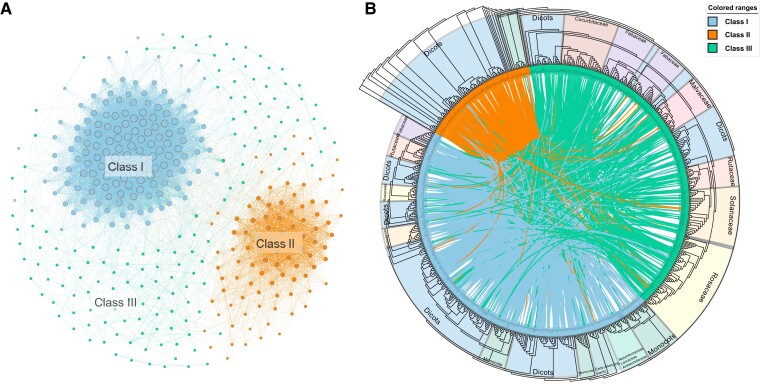
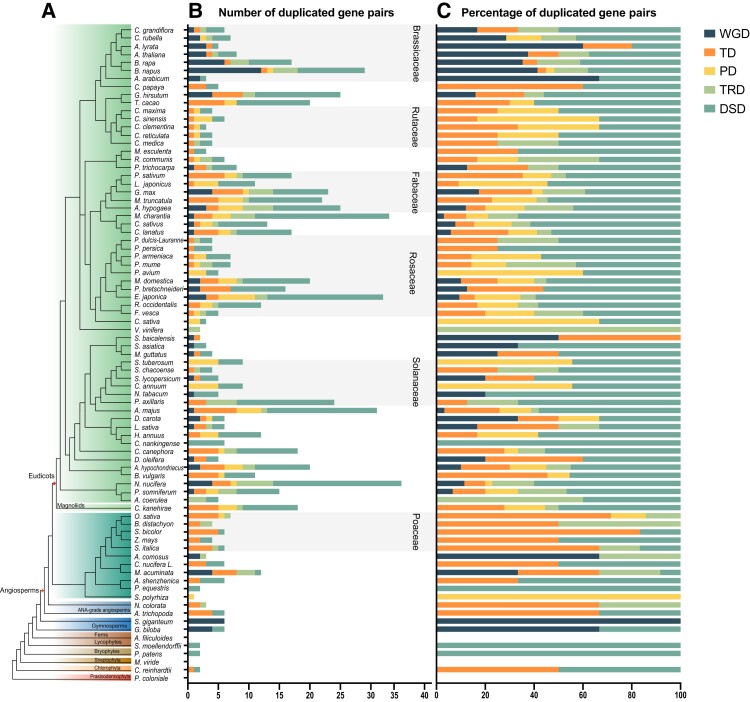
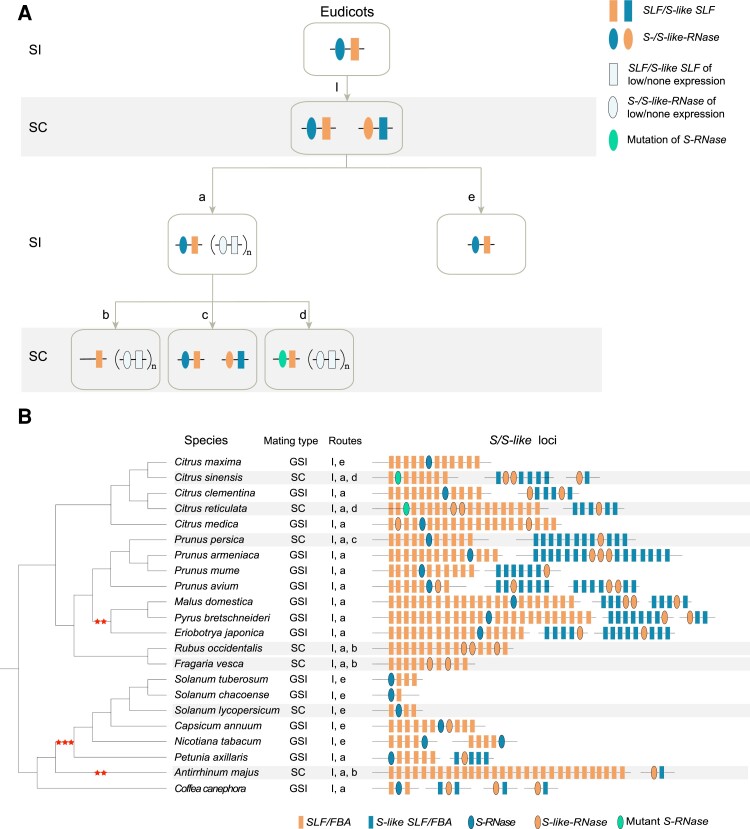
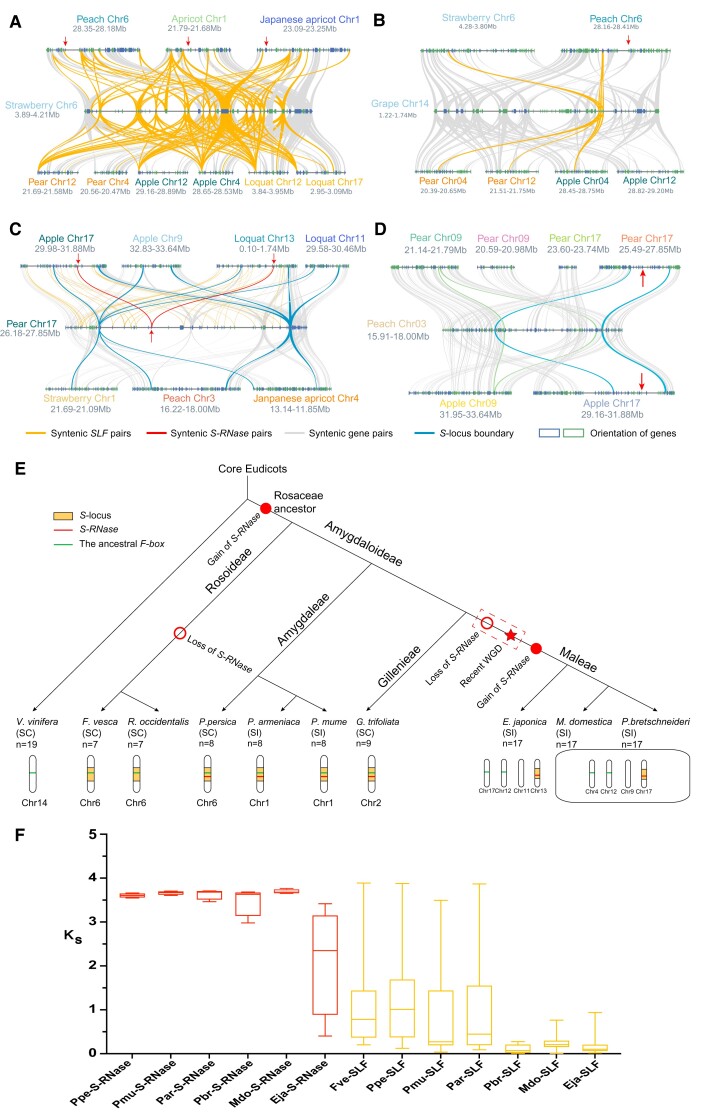
Ribonuclease (RNase) T2 genes are found widely in both eukaryotes and prokaryotes, and genes from this family have been revealed to have various functions in plants. In particular, S-RNase is known to be the female determinant in the S-RNase-based gametophytic self-incompatibility (GSI) system. However, the origin and evolution of the RNase T2 gene family and GSI system are not well understood. In this study, 785 RNase T2 genes were identified in 81 sequenced plant genomes representing broad-scale diversity and divided into three subgroups (Class I, II, and III) based on phylogenetic and synteny network analysis. Class I was found to be of ancient origin and to emerge in green algae, Class II was shown to originate with the appearance of angiosperms, while Class III was discovered to be eudicot-specific. Each of the three major classes could be further classified into several subclasses of which some subclasses were found to be lineage-specific. Furthermore, duplication, deletion, or inactivation of the S/S-like-locus was revealed to be linked to repeated loss and gain of self-incompatibility in different species from distantly related plant families with GSI. Finally, the origin and evolutionary history of S-locus in Rosaceae species was unraveled with independent loss and gain of S-RNase occurred in different subfamilies of Rosaceae. Our findings provide insights into the origin and evolution of the RNase T2 family and the GSI system in plants.
Keywords: S-locus; RNase T2 family; evolution; gametophytic self-incompatibility; phylogeny.
© The Author(s) 2022. Published by Oxford University Press on behalf of Society for Molecular Biology and Evolution.
Figures
Similar articles
-
S-RNase evolution in self-incompatibility: Phylogenomic insights into synteny with Class I T2 RNase genes.Plant Physiol. 2025 Mar 1;197(3):kiaf072. doi: 10.1093/plphys/kiaf072. Plant Physiol. 2025. PMID: 39977114
-
No evidence for Fabaceae Gametophytic self-incompatibility being determined by Rosaceae, Solanaceae, and Plantaginaceae S-RNase lineage genes.BMC Plant Biol. 2015 Jun 2;15:129. doi: 10.1186/s12870-015-0497-2. BMC Plant Biol. 2015. PMID: 26032621 Free PMC article.
-
Self-incompatibility (S) alleles of the Rosaceae encode members of a distinct class of the T2/S ribonuclease superfamily.Mol Gen Genet. 1996 Mar 20;250(5):547-57. doi: 10.1007/BF02174443. Mol Gen Genet. 1996. PMID: 8676858
-
Pollen-expressed F-box gene family and mechanism of S-RNase-based gametophytic self-incompatibility (GSI) in Rosaceae.Sex Plant Reprod. 2010 Mar;23(1):39-43. doi: 10.1007/s00497-009-0111-6. Epub 2009 Aug 30. Sex Plant Reprod. 2010. PMID: 20165962 Review.
-
Molecular mechanisms underlying the breakdown of gametophytic self-incompatibility.Q Rev Biol. 2002 Mar;77(1):17-32. doi: 10.1086/339200. Q Rev Biol. 2002. PMID: 11963459 Review.
Cited by
-
Rapid detection of RNase-based self-incompatibility in Lysimachia monelli (Primulaceae).Am J Bot. 2025 Jan;112(1):e16449. doi: 10.1002/ajb2.16449. Epub 2025 Jan 13. Am J Bot. 2025. PMID: 39806558 Free PMC article.
-
The Snapdragon Genomes Reveal the Evolutionary Dynamics of the S-Locus Supergene.Mol Biol Evol. 2023 Apr 4;40(4):msad080. doi: 10.1093/molbev/msad080. Mol Biol Evol. 2023. PMID: 37014787 Free PMC article.
-
Comparative stigmatic transcriptomics reveals self and cross pollination responses to heteromorphic incompatibility in Plumbago auriculata Lam.Front Genet. 2024 Mar 6;15:1372644. doi: 10.3389/fgene.2024.1372644. eCollection 2024. Front Genet. 2024. PMID: 38510275 Free PMC article.
-
Genomic evolution of BA.5.2 and BF.7.14 derived lineages causing SARS-CoV-2 outbreak at the end of 2022 in China.Front Public Health. 2023 Nov 30;11:1273745. doi: 10.3389/fpubh.2023.1273745. eCollection 2023. Front Public Health. 2023. PMID: 38106899 Free PMC article.
-
Molecular insights into self-incompatibility systems: From evolution to breeding.Plant Commun. 2024 Feb 12;5(2):100719. doi: 10.1016/j.xplc.2023.100719. Epub 2023 Sep 16. Plant Commun. 2024. PMID: 37718509 Free PMC article. Review.
References
-
- Ashkani J, Rees DJ. 2016. A comprehensive study of molecular evolution at the self-incompatibility locus of rosaceae. J Mol Evol. 82(2–3):128–145. - PubMed
-
- Bombarely A, et al. 2016. Insight into the evolution of the Solanaceae from the parental genomes of Petunia hybrida. Nat Plants 2(6):16074. - PubMed
Publication types
MeSH terms
Substances
LinkOut - more resources
Full Text Sources
