

Cellular and humoral immune response to SARS-CoV-2 vaccination and booster dose in immunosuppressed patients: An observational cohort study
- PMID: 35714462
- PMCID: PMC9188451
- DOI: 10.1016/j.jcv.2022.105217
Cellular and humoral immune response to SARS-CoV-2 vaccination and booster dose in immunosuppressed patients: An observational cohort study
Abstract
Background: Humoral and cellular immune responses to SARS-CoV-2 vaccination among immunosuppressed patients remain poorly defined, as well as variables associated with poor response.
Methods: We performed a retrospective observational cohort study at a large Northern California healthcare system of infection-naïve individuals fully vaccinated against SARS-CoV-2 (mRNA-1273, BNT162b2, or Ad26.COV2.S) with clinical SARS-CoV-2 interferon gamma release assay (IGRA) ordered between January through November 2021. Humoral and cellular immune responses were measured by anti-SARS-CoV-2 S1 IgG ELISA (anti-S1 IgG) and IGRA, respectively, following primary and/or booster vaccination.
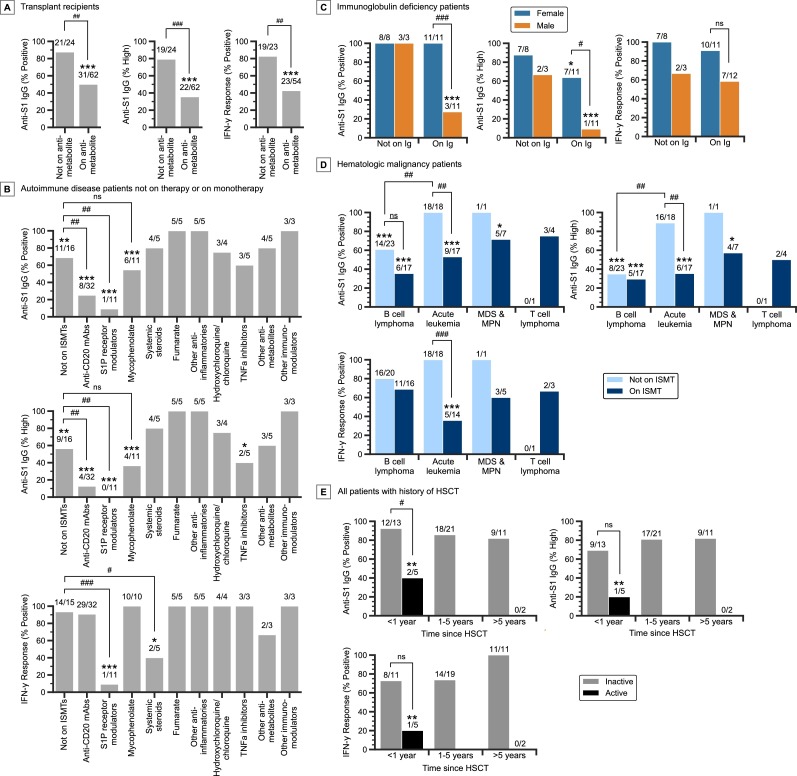
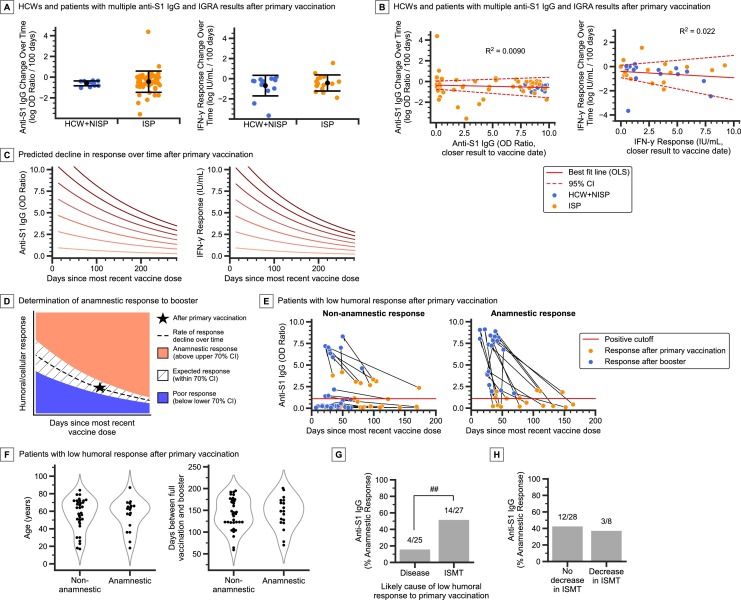
Results: 496 immunosuppressed patients (54% female; median age 50 years) were included. 62% (261/419) of patients had positive anti-S1 IgG and 71% (277/389) had positive IGRA after primary vaccination, with 20% of patients having a positive IGRA only. Following booster, 69% (81/118) had positive anti-S1 IgG and 73% (91/124) had positive IGRA. Factors associated with low humoral response rates after primary vaccination included anti-CD20 monoclonal antibodies (P < 0.001), sphingosine 1-phsophate (S1P) receptor modulators (P < 0.001), mycophenolate (P = 0.002), and B cell lymphoma (P = 0.004); those associated with low cellular response rates included S1P receptor modulators (P < 0.001) and mycophenolate (P < 0.001). Of patients who had poor humoral response to primary vaccination, 35% (18/52) developed a significantly higher response after the booster. Only 5% (2/42) of patients developed a significantly higher cellular response to the booster dose compared to primary vaccination.
Conclusions: Humoral and cellular response rates to primary and booster SARS-CoV-2 vaccination differ among immunosuppressed patient groups. Clinical testing of cellular immunity is important in monitoring vaccine response in vulnerable populations.
Keywords: COVID-19; IGRA; Immunosuppression; SARS-CoV-2; Serology; Vaccination.
Copyright © 2022. Published by Elsevier B.V.
Conflict of interest statement
The authors declare no competing interests.
Figures
Similar articles
-
Kinetics and Persistence of the Cellular and Humoral Immune Responses to BNT162b2 mRNA Vaccine in SARS-CoV-2-Naive and -Experienced Subjects: Impact of Booster Dose and Breakthrough Infections.Front Immunol. 2022 May 31;13:863554. doi: 10.3389/fimmu.2022.863554. eCollection 2022. Front Immunol. 2022. PMID: 35711445 Free PMC article.
-
NVX-CoV2373-induced T- and B-cellular immunity in immunosuppressed people with multiple sclerosis that failed to respond to mRNA and viral vector SARS-CoV-2 vaccines.Front Immunol. 2023 Jul 20;14:1081933. doi: 10.3389/fimmu.2023.1081933. eCollection 2023. Front Immunol. 2023. PMID: 37545513 Free PMC article.
-
Humoral and cellular immunogenicity of homologous and heterologous booster vaccination in Ad26.COV2.S-primed individuals: Comparison by breakthrough infection.Front Immunol. 2023 Mar 7;14:1131229. doi: 10.3389/fimmu.2023.1131229. eCollection 2023. Front Immunol. 2023. PMID: 36960070 Free PMC article.
-
Study of the cellular and humoral immune responses to SARS-CoV-2 vaccination.Heliyon. 2024 Apr 2;10(7):e29116. doi: 10.1016/j.heliyon.2024.e29116. eCollection 2024 Apr 15. Heliyon. 2024. PMID: 38601689 Free PMC article. Review.
-
The effectiveness of the first dose COVID-19 booster vs. full vaccination to prevent SARS-CoV-2 infection and severe COVID-19 clinical event: a meta-analysis and systematic review of longitudinal studies.Front Public Health. 2023 Jun 1;11:1165611. doi: 10.3389/fpubh.2023.1165611. eCollection 2023. Front Public Health. 2023. PMID: 37325336 Free PMC article.
Cited by
-
Immunogenicity Rates after SARS-CoV-2 Three-Dose Vaccination in Patients under Dialysis: A Systematic Review and Meta-Analysis.Vaccines (Basel). 2022 Dec 2;10(12):2070. doi: 10.3390/vaccines10122070. Vaccines (Basel). 2022. PMID: 36560480 Free PMC article. Review.
-
Impact of Immunomodulatory Therapy on COVID-19 Vaccine Response in Patients with Autoimmune Inflammatory Rheumatic Diseases.Vaccines (Basel). 2024 Mar 6;12(3):274. doi: 10.3390/vaccines12030274. Vaccines (Basel). 2024. PMID: 38543908 Free PMC article. Review.
-
Comparative effectiveness of mRNA-1273 and BNT162b2 COVID-19 vaccines in immunocompromised individuals: a systematic review and meta-analysis using the GRADE framework.Front Immunol. 2023 Sep 12;14:1204831. doi: 10.3389/fimmu.2023.1204831. eCollection 2023. Front Immunol. 2023. PMID: 37771594 Free PMC article.
-
Cellular and humoral responses after second and third SARS-CoV-2 vaccinations in patients with autoimmune diseases treated with rituximab: specific T cell immunity remains longer and plays a protective role against SARS-CoV-2 reinfections.Front Immunol. 2023 Apr 27;14:1146841. doi: 10.3389/fimmu.2023.1146841. eCollection 2023. Front Immunol. 2023. PMID: 37180097 Free PMC article.
-
Measures to Increase Immunogenicity of SARS-CoV-2 Vaccines in Solid Organ Transplant Recipients: A Narrative Review.Vaccines (Basel). 2023 Nov 25;11(12):1755. doi: 10.3390/vaccines11121755. Vaccines (Basel). 2023. PMID: 38140160 Free PMC article. Review.
References
-
- Harpaz R., Dahl R.M., Dooling K.L. Prevalence of immunosuppression among US adults, 2013. JAMA. 2016;316:2547–2548. - PubMed
Publication types
MeSH terms
Substances
LinkOut - more resources
Full Text Sources
Medical
Miscellaneous
