. 2022 Jul 12;17(7):1683-1698.
doi: 10.1016/j.stemcr.2022.05.008. Epub 2022 Jun 16.

Zika virus induces FOXG1 nuclear displacement and downregulation in human neural progenitors

Affiliations

Zika virus induces FOXG1 nuclear displacement and downregulation in human neural progenitors

Giulia Lottini et al. Stem Cell Reports. .

Abstract

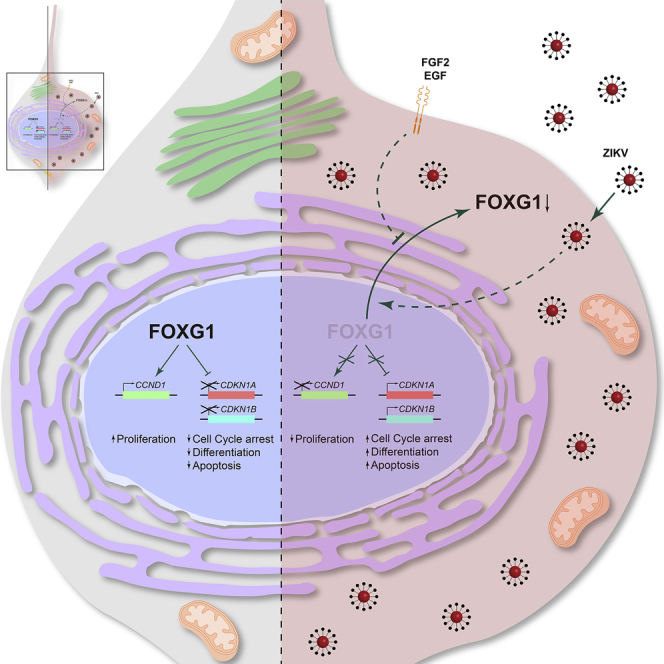
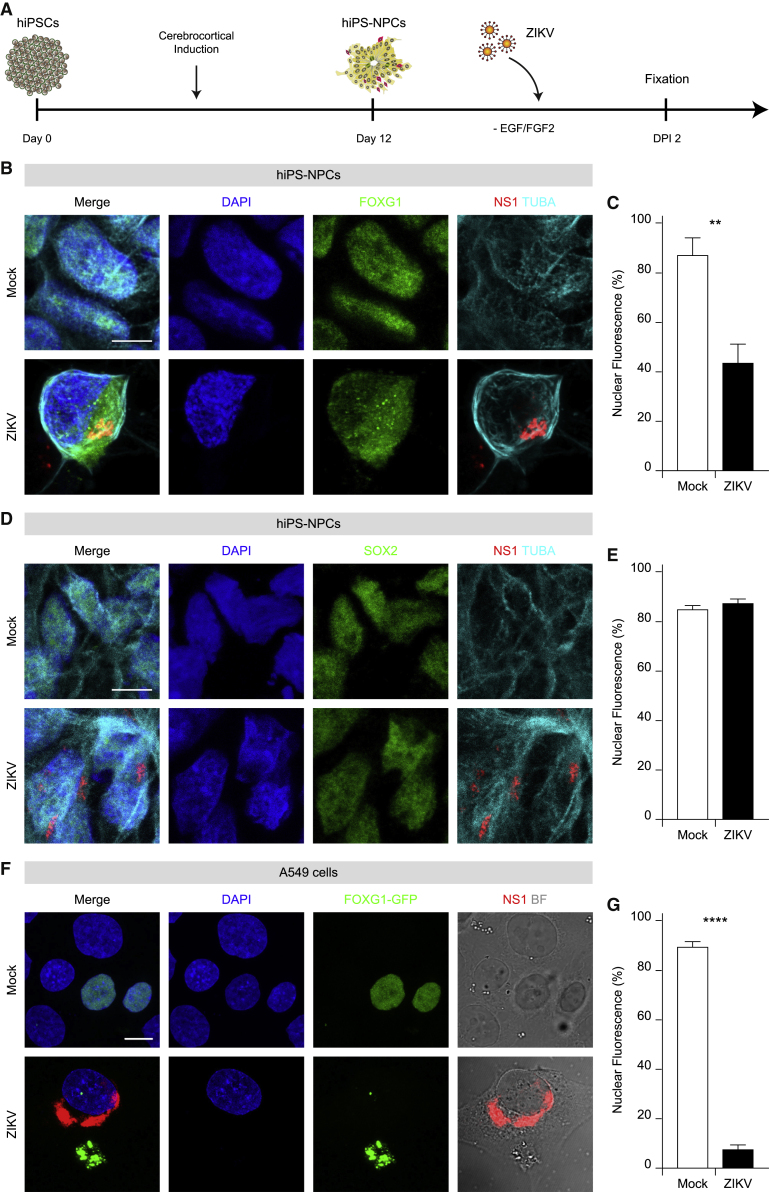
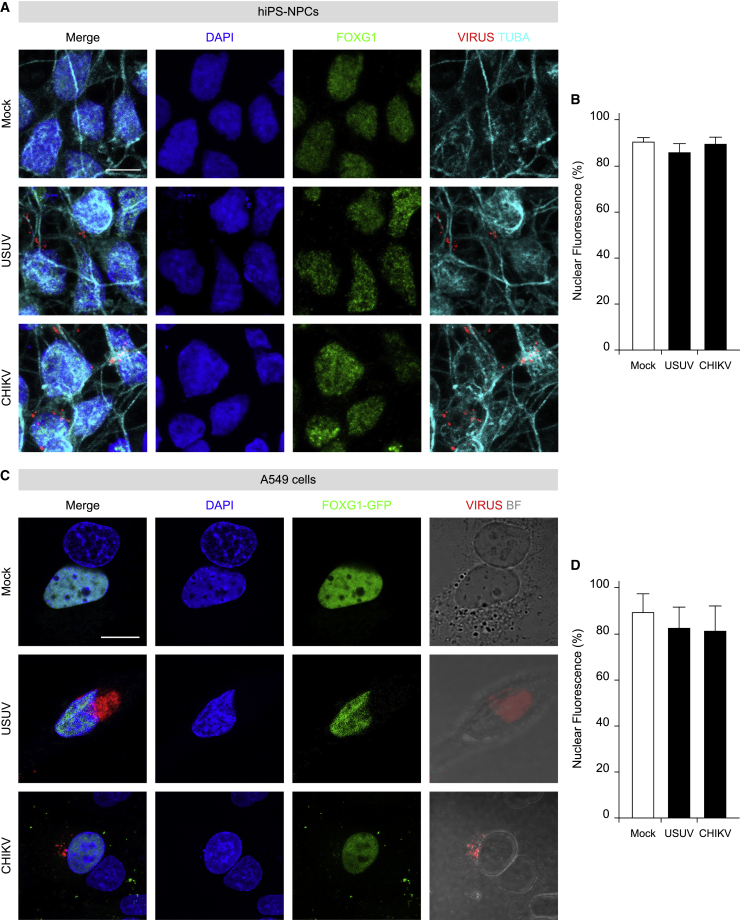
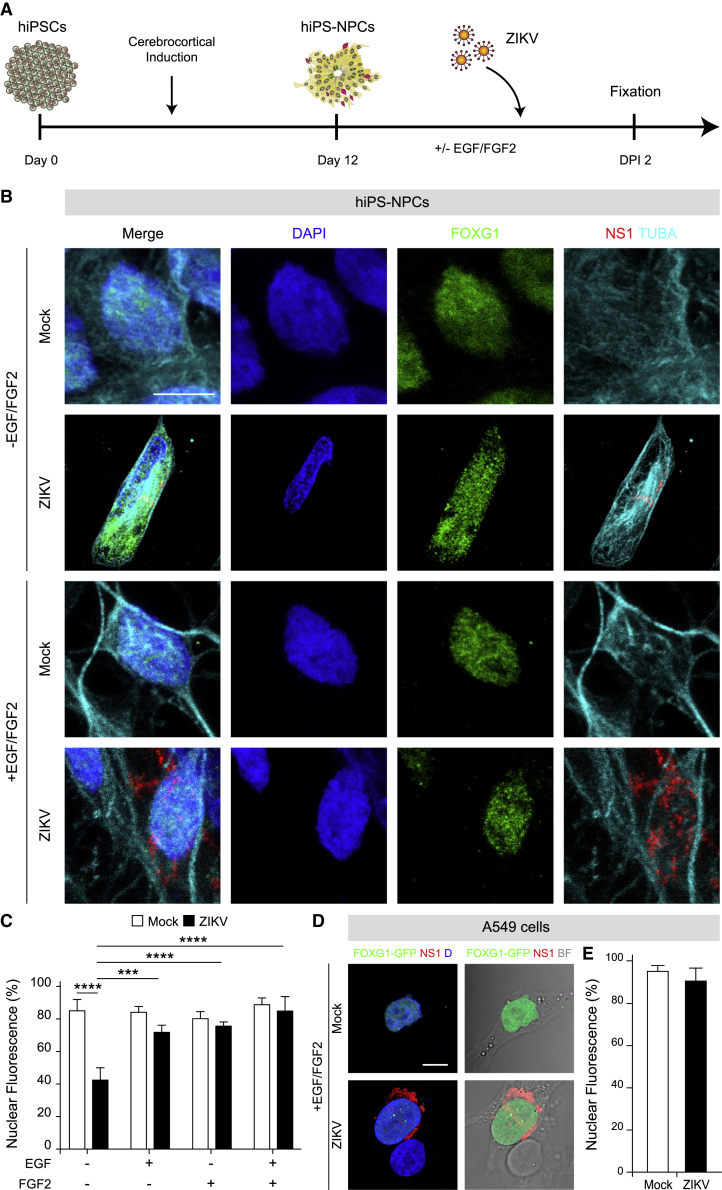
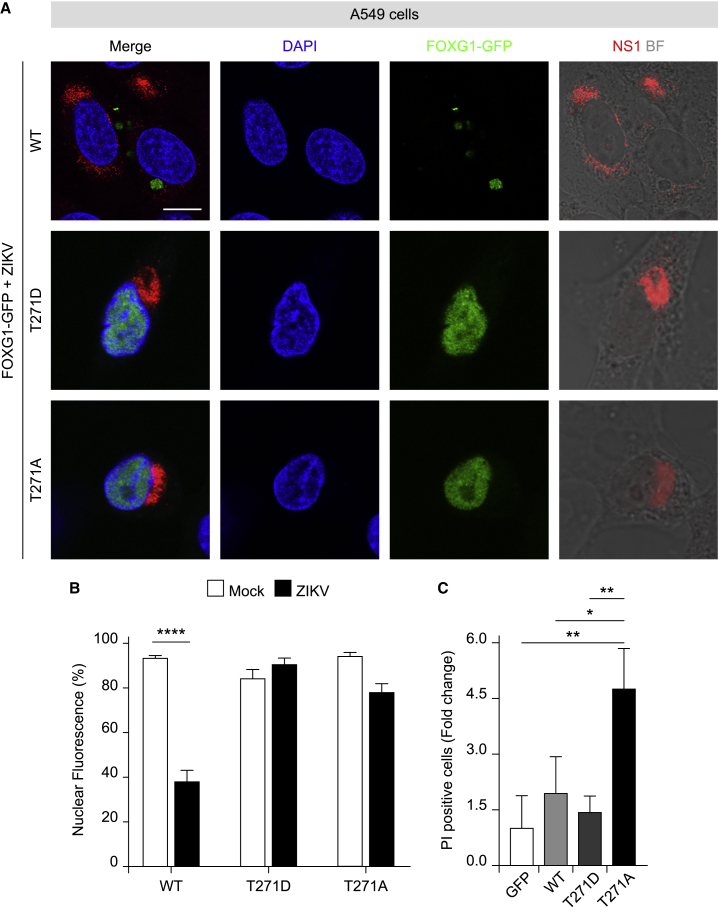
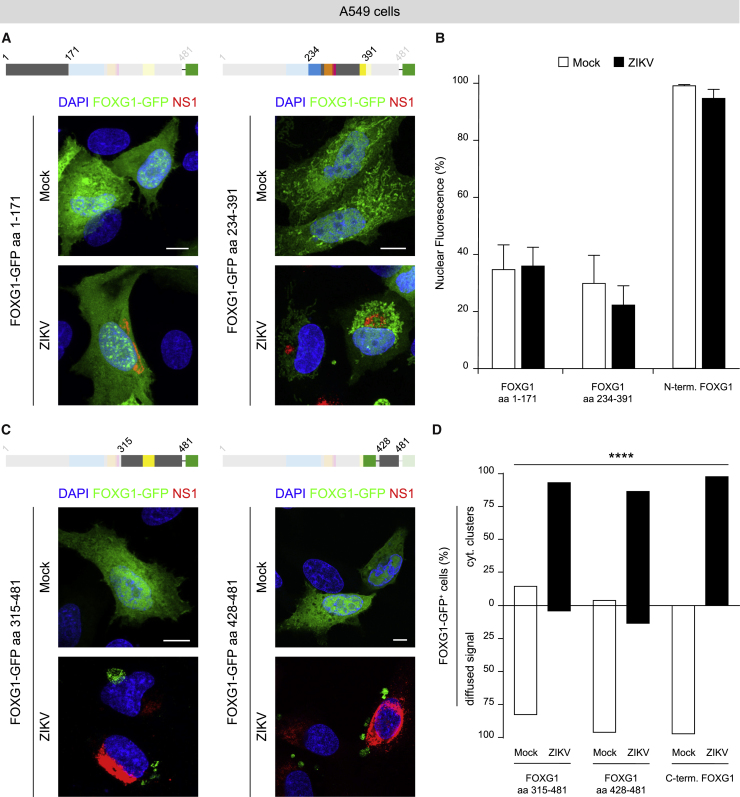
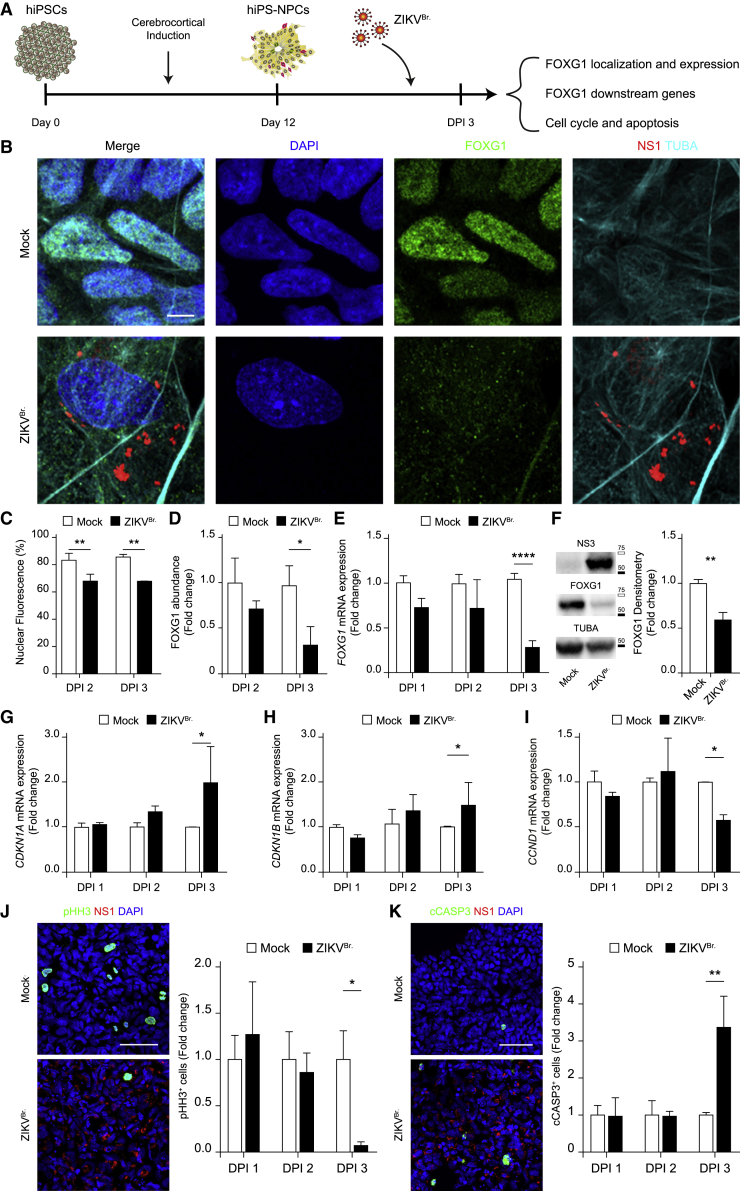
Congenital alterations in the levels of the transcription factor Forkhead box g1 (FOXG1) coding gene trigger "FOXG1 syndrome," a spectrum that recapitulates birth defects found in the "congenital Zika syndrome," such as microcephaly and other neurodevelopmental conditions. Here, we report that Zika virus (ZIKV) infection alters FOXG1 nuclear localization and causes its downregulation, thus impairing expression of genes involved in cell replication and apoptosis in several cell models, including human neural progenitor cells. Growth factors, such as EGF and FGF2, and Thr271 residue located in FOXG1 AKT domain, take part in the nuclear displacement and apoptosis protection, respectively. Finally, by progressive deletion of FOXG1 sequence, we identify the C-terminus and the residues 428-481 as critical domains. Collectively, our data suggest a causal mechanism by which ZIKV affects FOXG1, its target genes, cell cycle progression, and survival of human neural progenitors, thus contributing to microcephaly.

Keywords: FGF2; FOXG1; Zika virus; autism; brain cancer; congenital brain malformations; hiPSCs; microcephaly; neural stem cells; neurodevelopment; neurotropic virus.


Figures

None
Graphical abstract
Figure 1
Figure 1
Mislocalization of FOXG1 after ZIKV infection in hiPS-NPCs and A549 cells (A) Schematic representation of NPC derivation and viral infection. (B) Representative confocal images of FOXG1, ZIKV NS1, TUBA (TUBA1A, α-tubulin), and DAPI in mock and ZIKV-infected hiPS-NPCs. Analyses were performed at DPI 2. Scale bar, 10 μm. (C) Bar plot indicating the ratio of FOXG1 nuclear fluorescence on total fluorescence in mock and ZIKV-infected conditions (total cells, n = 40), p < 0.01. (D) Representative confocal images of mock and ZIKV-infected hiPS-NPCs showing SOX2 pattern after ZIKV infection at DPI 2. Scale bar, 10 μm. (E) Bar plot indicating the ratio of SOX2 nuclear fluorescence on total fluorescence in mock and ZIKV-infected conditions (total cells, n = 40), p > 0.05. (F) Representative confocal images of FOXG1-GFP transfected A549 cells. BF, Bright field. Analyses were performed at DPI 1. Scale bar, 10 μm. (G) Bar plot indicating the ratio of FOXG1 nuclear fluorescence on total fluorescence in mock and ZIKV-infected conditions. Data are shown as mean ± SEM (total cells, n = 37), p < 0.0001 (Kolmogorov-Smirnov test). (C and E) Data are shown as mean ± SD (unpaired Student’s t test). See also Figures S1 and S2.
Figure 2
Figure 2
Other arboviruses do not affect FOXG1 localization in hiPS-NPCs and A549 cells (A) Representative confocal images of FOXG1, Virus, TUBA (α-tubulin), and DAPI of mock and hiPS-NPCs infected with USUV or CHIKV. Analyses were performed at DPI 2. Scale bar, 10 μm. (B) Bar plot indicating the ratio of FOXG1 nuclear fluorescence on total fluorescence in mock and infected conditions (total cells, n = 60), p > 0.05. (C) Representative confocal images of FOXG1-GFP transfected A549 cells after infection with USUV or CHIKV. BF, Bright field. Analyses were performed at DPI 1. Scale bar, 10 μm. (D) Bar plot indicating the ratio of FOXG1 nuclear fluorescence on total cellular fluorescence in mock and infected conditions (total cells, n = 36), p > 0.05. (B and D) Data are shown as mean ± SD (one-way ANOVA, post hoc Tukey’s test).
Figure 3
Figure 3
ZIKV-induced FOXG1 displacement is inhibited by GF treatment in hiPS-NPCs and A549 cells (A) Schematic representation of NPC derivation from hiPSCs and viral infection in the presence of EGF and FGF2 (GFs). (B) Representative confocal images of FOXG1, ZIKV NS1, TUBA (α-tubulin), and DAPI in mock and ZIKV-infected hiPS-NPCs in the absence and in the presence of GFs. Analyses were performed at DPI 2. Scale bar, 10 μm. (C) Bar plot indicating the ratio of FOXG1 nuclear fluorescence on total fluorescence in mock and ZIKV-infected conditions. Data are shown as mean ± SD (total cells, n = 160), p < 0.001 (two-way ANOVA, post hoc Tukey’s test). (D) Representative confocal images of FOXG1-GFP transfected A549 cells in the presence of GFs, infected or not with ZIKV. BF, Bright field; D, DAPI. Analyses were performed at DPI 1. Scale bar, 10 μm. (E) Bar plot indicating the ratio of FOXG1 nuclear fluorescence on total fluorescence in mock and ZIKV-infected cells. Data are shown as mean ± SD (total cells, n = 20), p > 0.05 (unpaired Student’s t test with Welch’s correction). See also Figures S3 and S4.
Figure 4
Figure 4
Thr271 in FOXG1 AKT domain is essential for ZIKV-induced FOXG1 nuclear displacement and cell death protection (A) Representative confocal images of WT FOXG1-GFP, FOXG1-GFP-T271D, and FOXG1-GFP-T271A transfected A549 cells and infected with ZIKV. BF, Bright field. Analyses were performed at DPI 1. Scale bar, 10 μm. (B) Bar plot indicating the ratio of FOXG1 nuclear fluorescence on total fluorescence in mock and ZIKV-infected conditions (total cells, n = 49), p < 0.0001. (C) A549 cells, transfected with a GFP-only plasmid, WT FOXG1-GFP, FOXG1-GFP-T271D, or FOXG1-GFP-T271A constructs, were treated with Staurosporine (STS) or DMSO after which they were allowed to recover for 24 h. Cell death was assessed by Hoechst 33258 and propidium iodide (PI) staining. PI-positive nuclei were scored as dead cells and normalized on DMSO treatment. Bar blot indicating fold change in the ratio of PI-positive cells on GFP-only plasmid (total cells, n = 1428), p < 0.05. (B and C) Data are shown as mean ± SD; (B) two-way ANOVA, post hoc Tukey’s test; (C) One-way ANOVA, post hoc Tukey’s test. See also Figures S5.
Figure 5
Figure 5
FOXG1 C-terminus is essential for reacting to ZIKV infection (A) Schematic illustration of FOXG1-GFP constructs. Representative confocal images of FOXG1-GFP aa 1–171 or FOXG1-GFP aa 234–391 transfected A549 cells in mock and ZIKV-infected conditions. Analyses were performed at DPI 1. Scale bar, 10 μm. (B) Bar plot indicating the ratio of FOXG1 nuclear fluorescence on total fluorescence in mock and ZIKV-infected conditions in mouse FOXG1 aa 1–171, mouse FOXG1 aa 234–391 and human N-terminal FOXG1 aa 1–280 transfected A549 cells. Data are shown as mean ± SD (total cells, n = 29), p > 0.05 (two-way ANOVA, post hoc Tukey’s test). (C) Representative confocal images of FOXG1-GFP aa 315–481 or FOXG1-GFP aa 428–481 transfected A549 cells in mock and ZIKV-infected conditions. Analyses were performed at DPI 1. Scale bar, 10 μm. (D) Bar plot indicating the percentage of cells with FOXG1-GFP diffused signal or FOXG1-GFP cytoplasmic (cyt.) clusters in mock and ZIKV-infected conditions in mouse FOXG1 aa 315–481, mouse FOXG1 aa 428–481, and human C-terminal FOXG1 aa 280–489 transfected A549 cells. Data are shown as mean (total cells, n = 30), p < 0.0001 (chi-square test). FHD, Forkhead Domain (blue); MIT, Mitochondrial domain (orange); GTB, GROUCHO/TLE-Binding domain (pink); JBD, JARID1B Binding Domain (yellow); GFP, Green Fluorescence Protein (green). See also Figures S5 and S6.
Figure 6
Figure 6
Brazilian ZIKV infection induces FOXG1 nuclear displacement and downregulation, dysregulation in FOXG1 downstream genes affecting cell cycle progression and survival (A) Schematic representation of NPC derivation from hiPSCs, viral infection, and effects. (B) Representative confocal images of FOXG1, Brazilian ZIKV (ZIKVBr.) NS1, TUBA (α-tubulin), and DAPI, in mock and ZIKVBr.-infected hiPS-NPCs. Analyses were performed at DPI 3. Scale bar, 5 μm. (C) Bar plot indicating the ratio of FOXG1 nuclear fluorescence on total fluorescence in mock and ZIKVBr.-infected conditions (total cells, n = 240), p < 0.01. (D) Bar plot indicating fold change in FOXG1 total fluorescence normalized to mock, in mock and ZIKVBr.-infected hiPS-NPCs (total cells, n = 240), p < 0.05. (E) Bar plot indicating fold change in FOXG1 mRNA level in mock and ZIKVBr.-infected conditions (n = 3), p < 0.0001. (F) Western blot and densitometric analysis showed the comparison between the level of FOXG1 in mock and ZIKVBr.-infected conditions (n = 4), p < 0.01. White box = 75 kDa, Black box = 50 kDa. Bar plot indicating fold change in (G) CDKN1A (n = 3), p < 0.05; (H) CDKN1B (n = 3), p < 0.05; and (I) CCND1 mRNA levels in mock and ZIKVBr.-infected conditions (n = 3), p < 0.05. (J) Representative confocal images of pHH3, ZIKVBr. NS1, and DAPI in mock and ZIKVBr.-infected hiPS-NPCs at DPI 3. Scale bar, 50 μm. Bar plot indicating fold change in pHH3 positivity normalized to mock, in mock and ZIKVBr.-infected hiPS-NPCs (total cells, n = 60.036), p < 0.05. (K) Representative confocal images of cleaved CASP3 (cCASP3), ZIKVBr. NS1, and DAPI in mock and ZIKVBr.-infected hiPS-NPCs at DPI 3. Scale bar, 50 μm. Bar plot indicating fold change in cCASP3 positivity normalized to mock, in mock and ZIKVBr.-infected hiPS-NPCs (total cells, n = 58.209), p < 0.01. (C–K) Data are shown as mean ± SD; (C–E), (G–K) two-way ANOVA, post hoc Tukey’s test; (F) unpaired Student’s t test.

References

    1. Baek S.T., Copeland B., Yun E.-J., Kwon S.-K., Guemez-Gamboa A., Schaffer A.E., Kim S., Kang H.-C., Song S., Mathern G.W., et al. An AKT3-FOXG1-reelin network underlies defective migration in human focal malformations of cortical development. Nat. Med. 2015;21:1445–1454. doi: 10.1038/nm.3982. - DOI - PMC - PubMed
    1. Baggiani M., Dell’Anno M.T., Pistello M., Conti L., Onorati M. Human neural stem cell systems to explore pathogen-related neurodevelopmental and neurodegenerative disorders. Cells. 2020;9:1893. doi: 10.3390/cells9081893. - DOI - PMC - PubMed
    1. Blackmon K., Waechter R., Landon B., Noël T., Macpherson C., Donald T., Cudjoe N., Evans R., Burgen K.S., Jayatilake P., et al. Epilepsy surveillance in normocephalic children with and without prenatal Zika virus exposure. PLoS Neglected Trop. Dis. 2020;14:e0008874. doi: 10.1371/journal.pntd.0008874. - DOI - PMC - PubMed
    1. Boggio E.M., Pancrazi L., Gennaro M., lo Rizzo C., Mari F., Meloni I., Ariani F., Panighini A., Novelli E., Biagioni M., et al. Visual impairment in FOXG1-mutated individuals and mice. Neuroscience. 2016;324:496–508. doi: 10.1016/j.neuroscience.2016.03.027. - DOI - PubMed
    1. Bulstrode H., Johnstone E., Marques-Torrejon M.A., Ferguson K.M., Bressan R.B., Blin C., Grant V., Gogolok S., Gangoso E., Gagrica S., et al. Elevated FOXG1 and SOX2 in glioblastoma enforces neural stem cell identity through transcriptional control of cell cycle and epigenetic regulators. Genes Dev. 2017;31:757–773. doi: 10.1101/gad.293027.116. - DOI - PMC - PubMed

Publication types

MeSH terms

Substances