. 2022 Jul 7;185(14):2542-2558.e18.
doi: 10.1016/j.cell.2022.05.018. Epub 2022 Jun 16.

Thymic epithelial cells co-opt lineage-defining transcription factors to eliminate autoreactive T cells

Affiliations

Thymic epithelial cells co-opt lineage-defining transcription factors to eliminate autoreactive T cells

Daniel A Michelson et al. Cell. .

Abstract

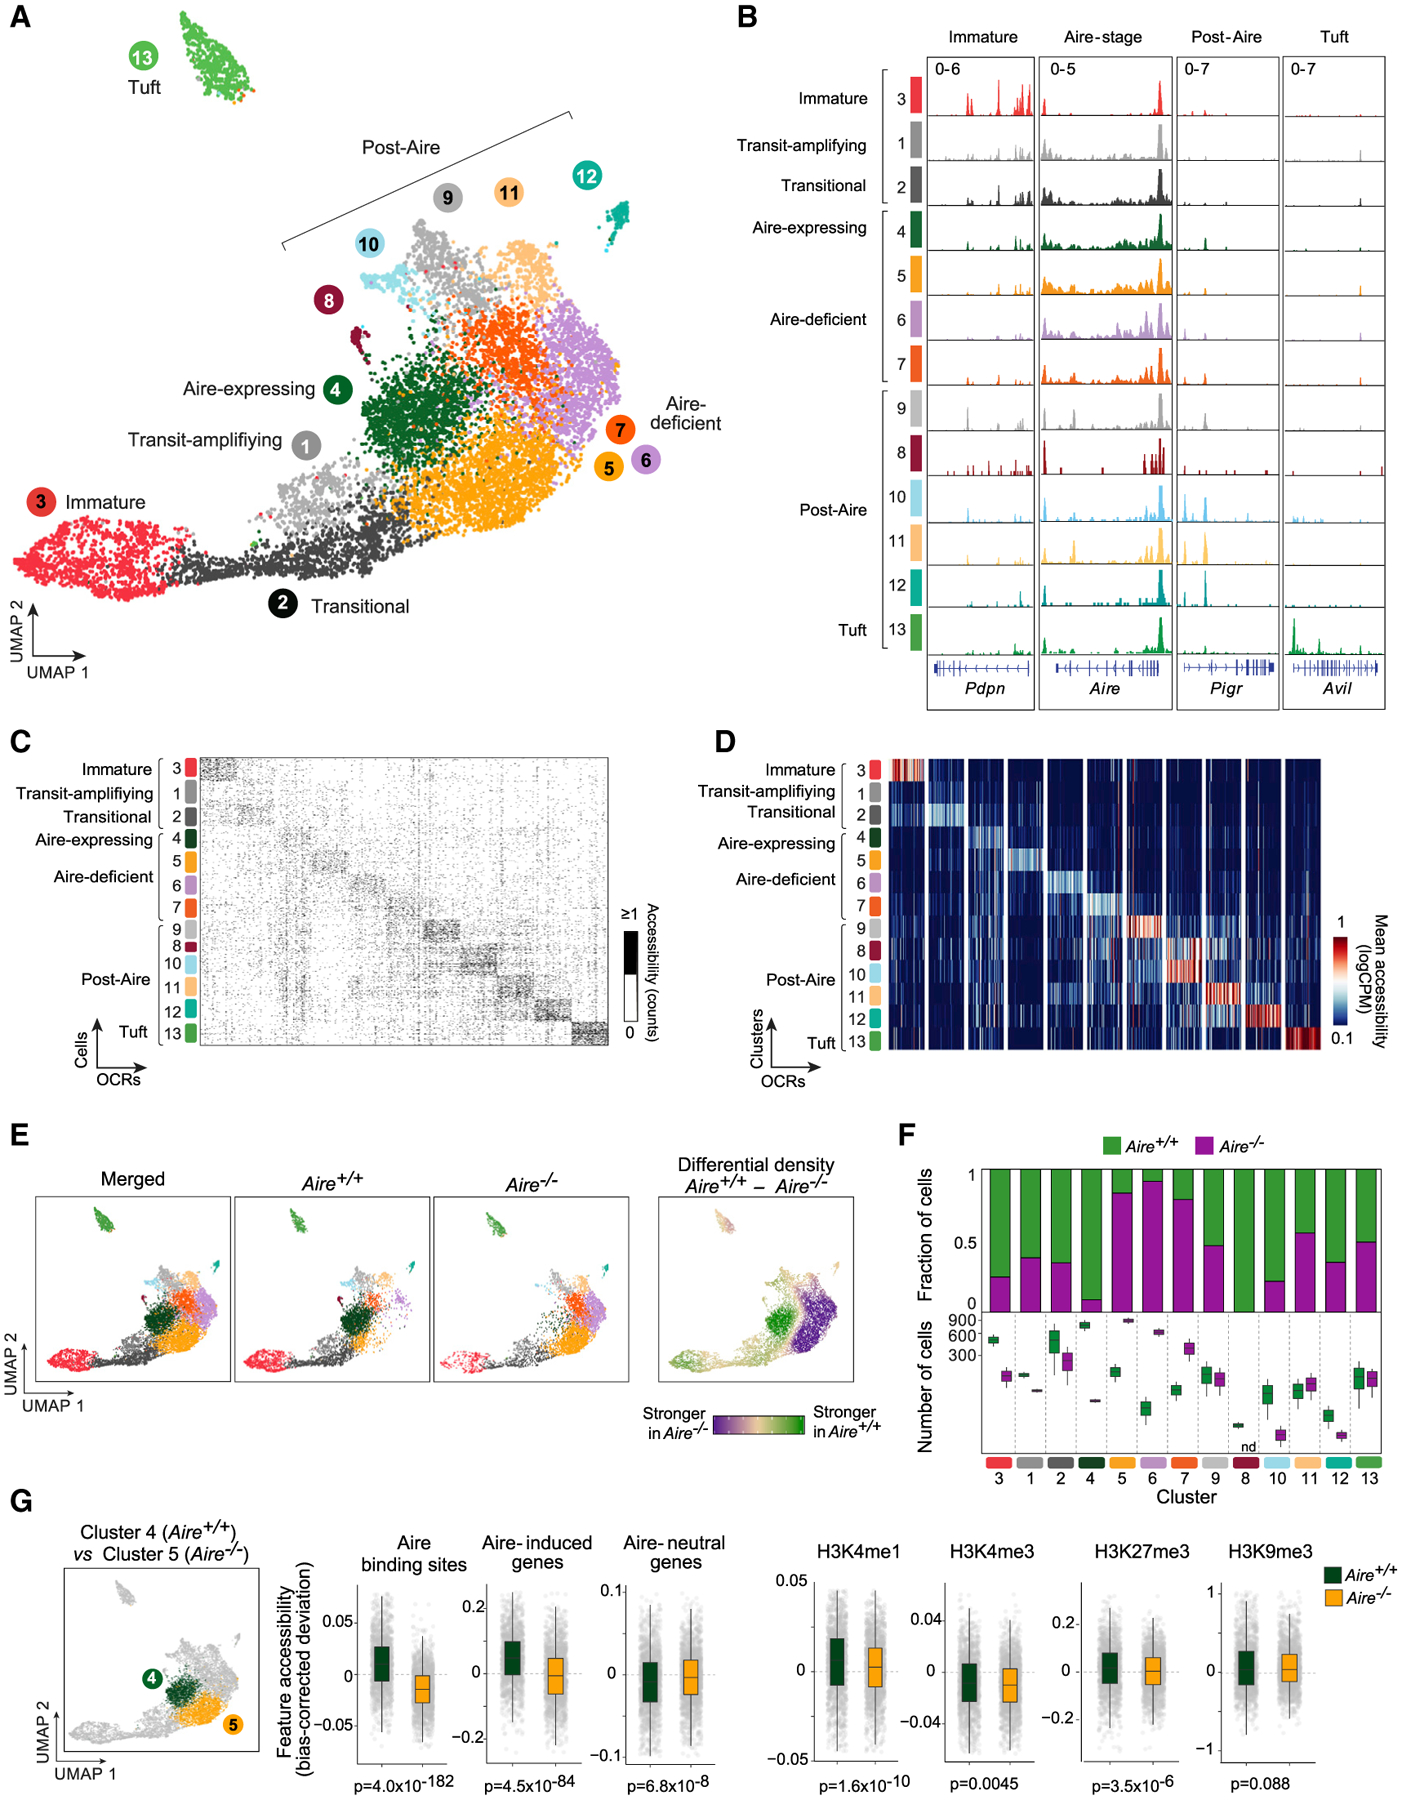
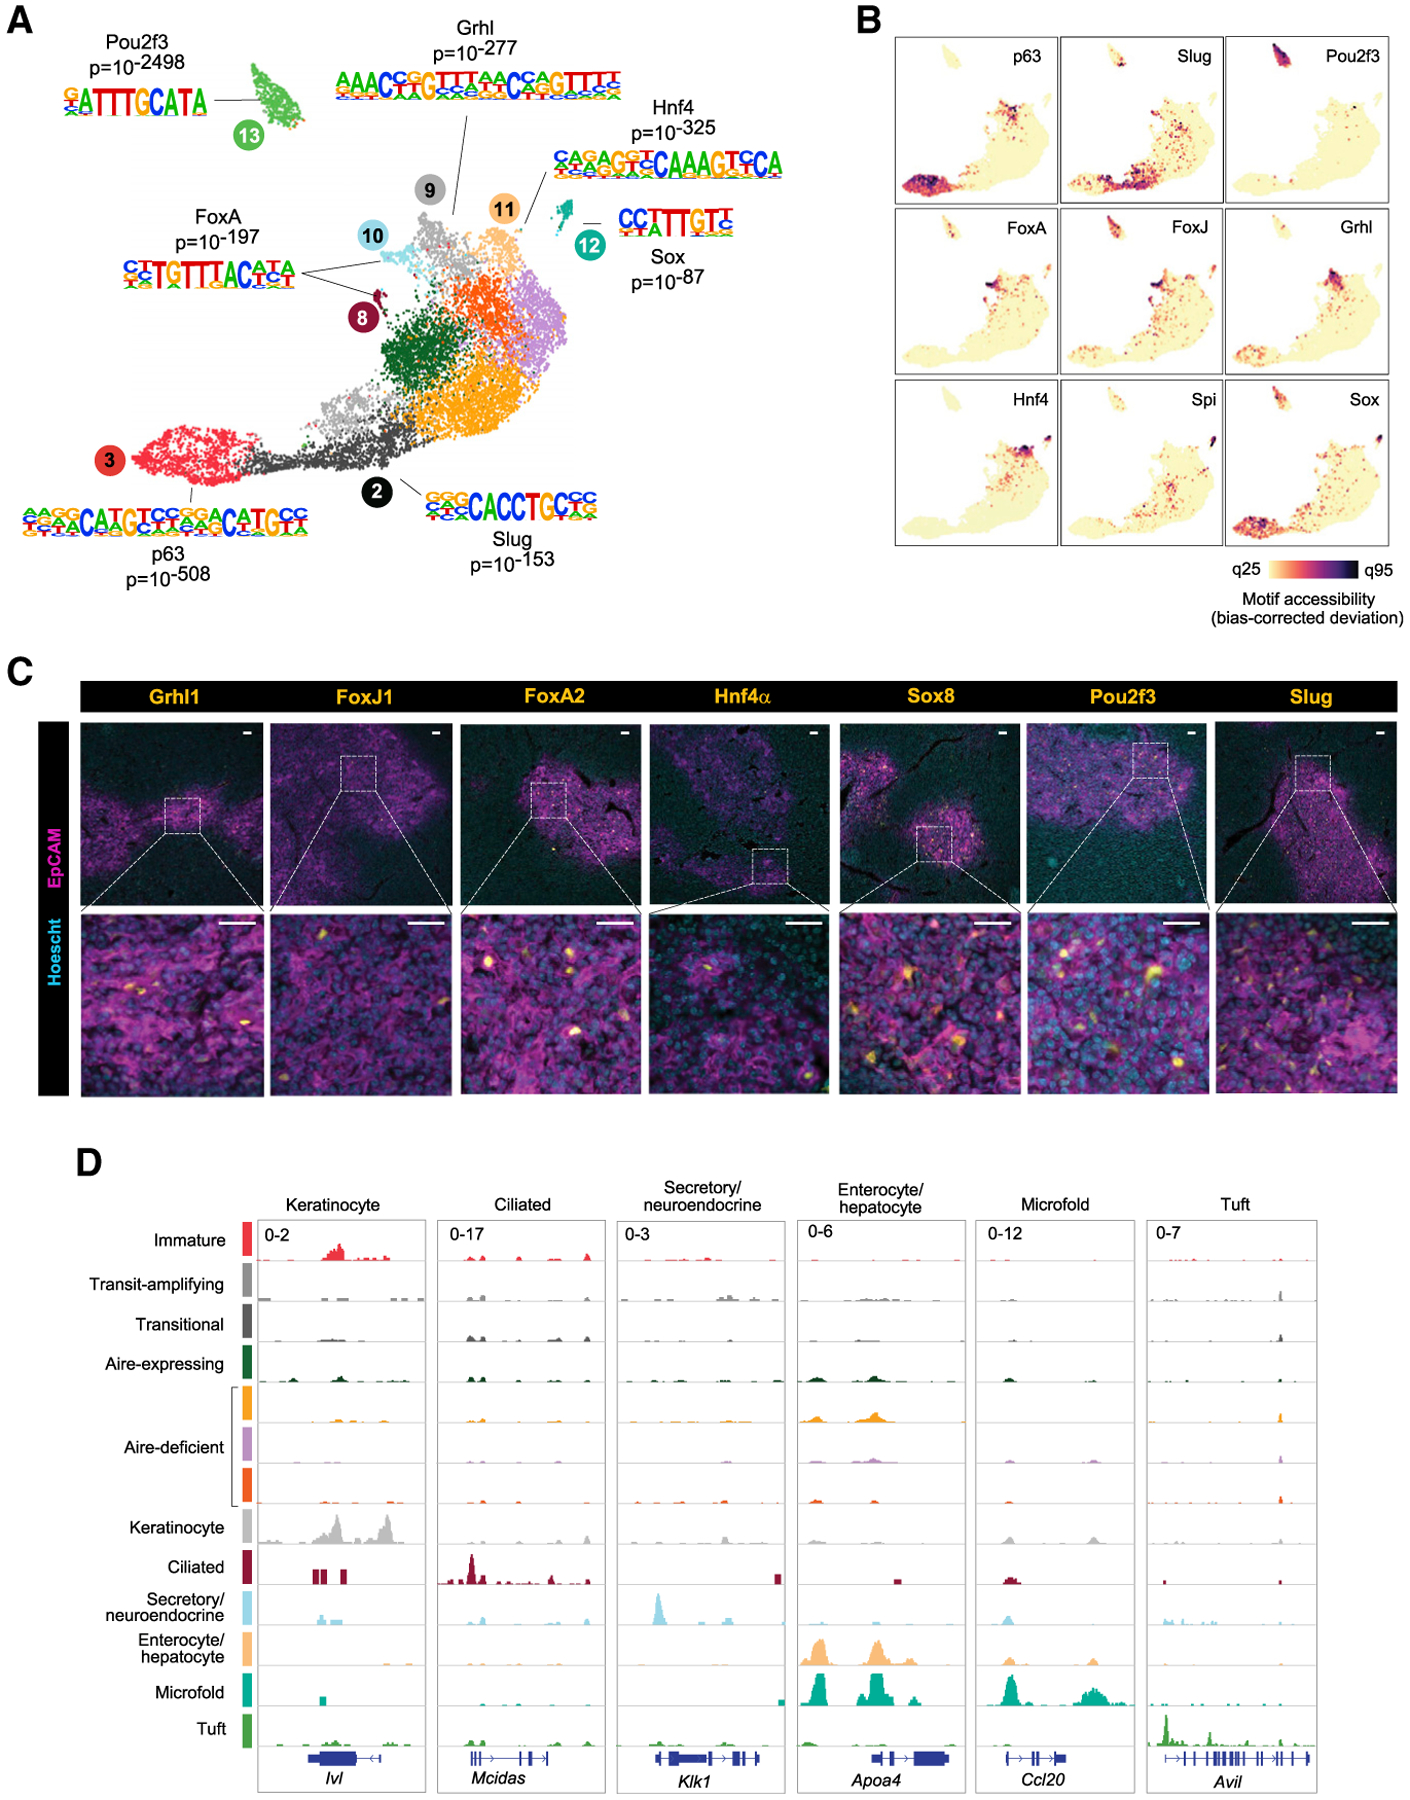
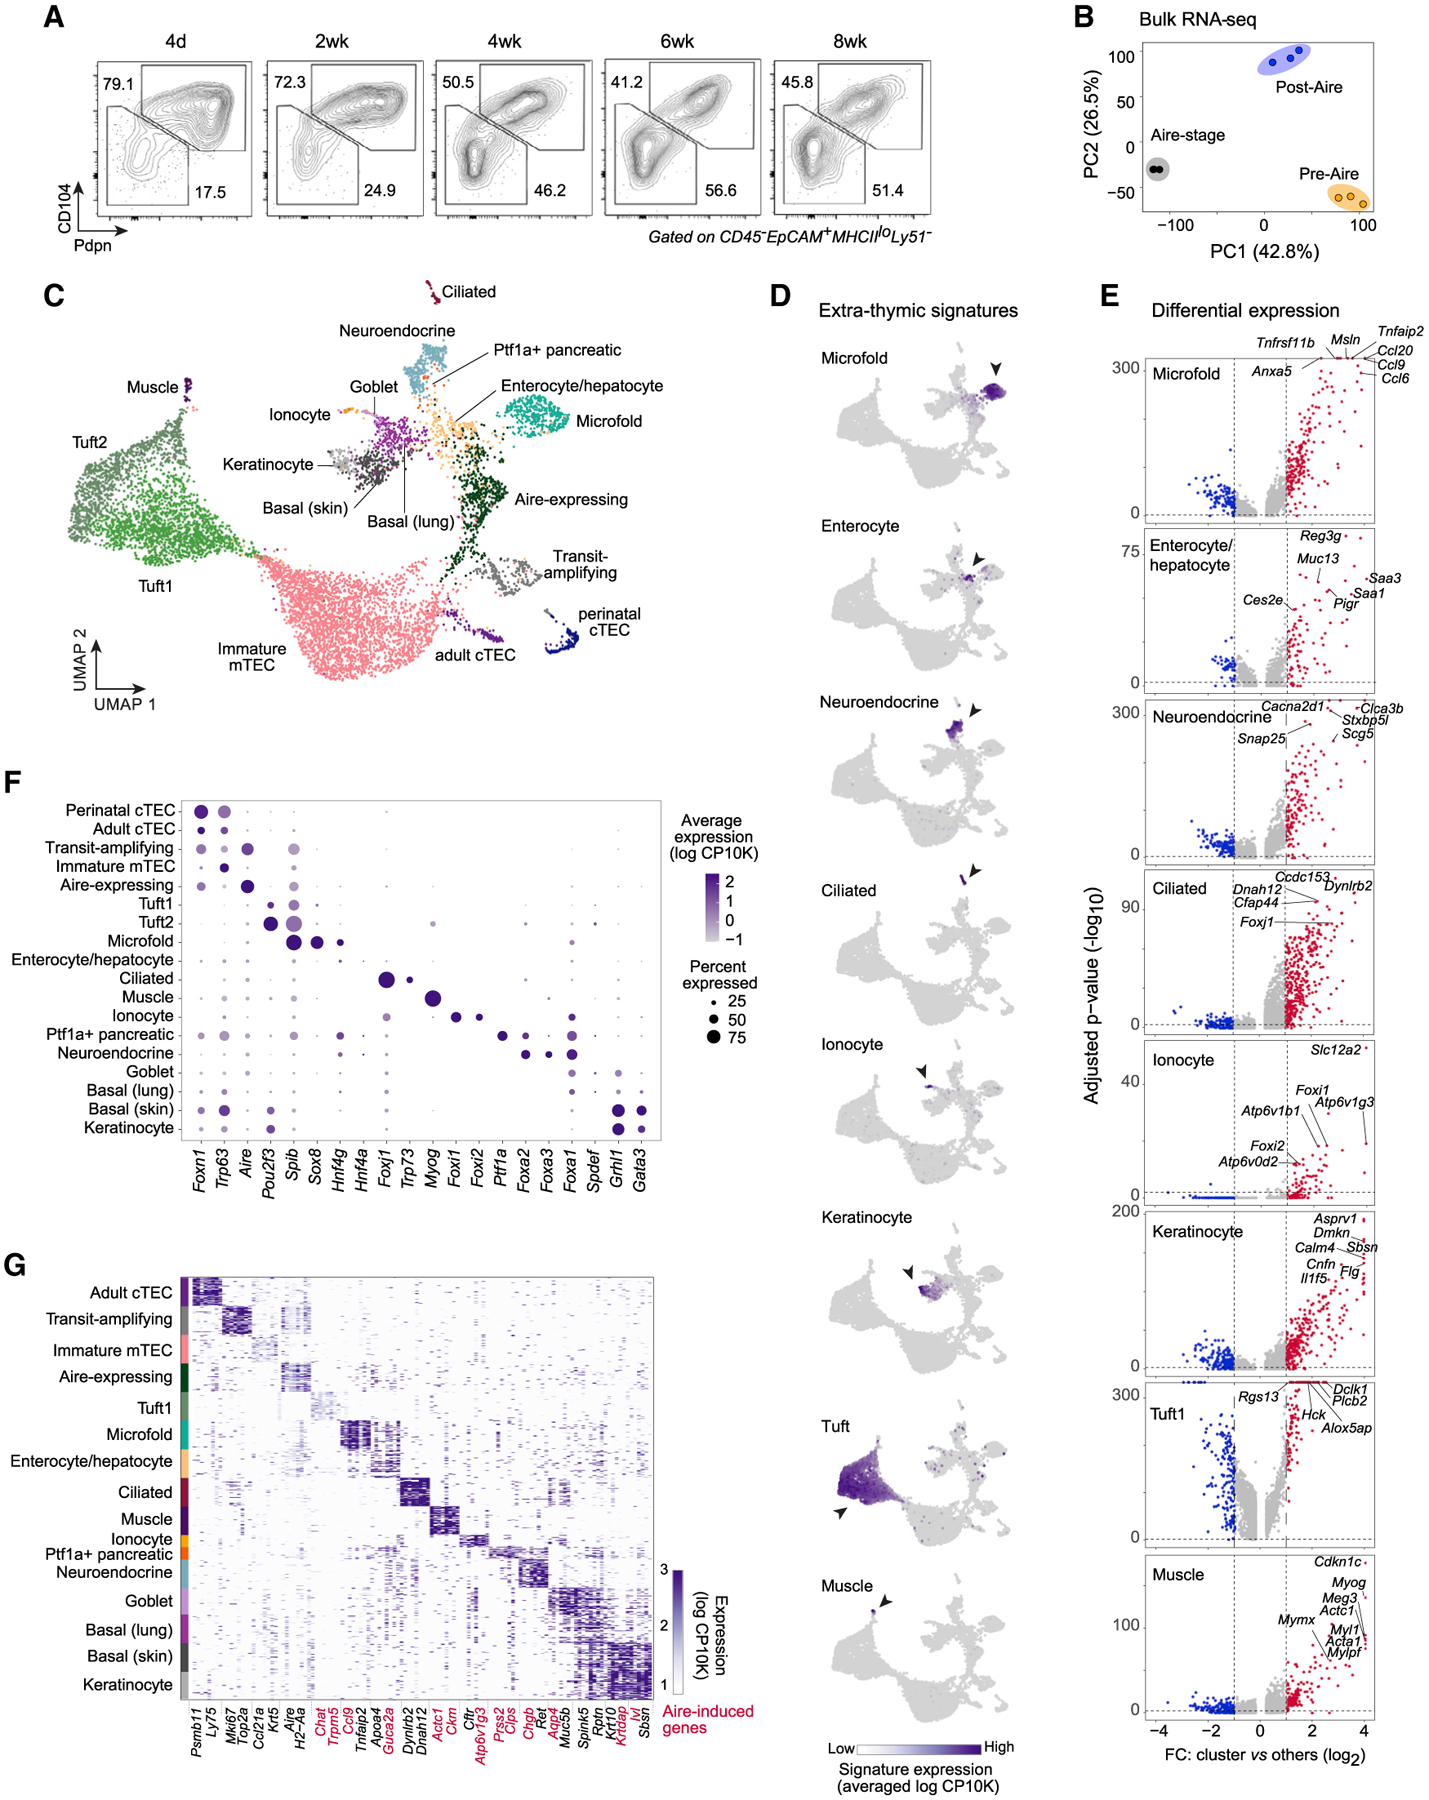
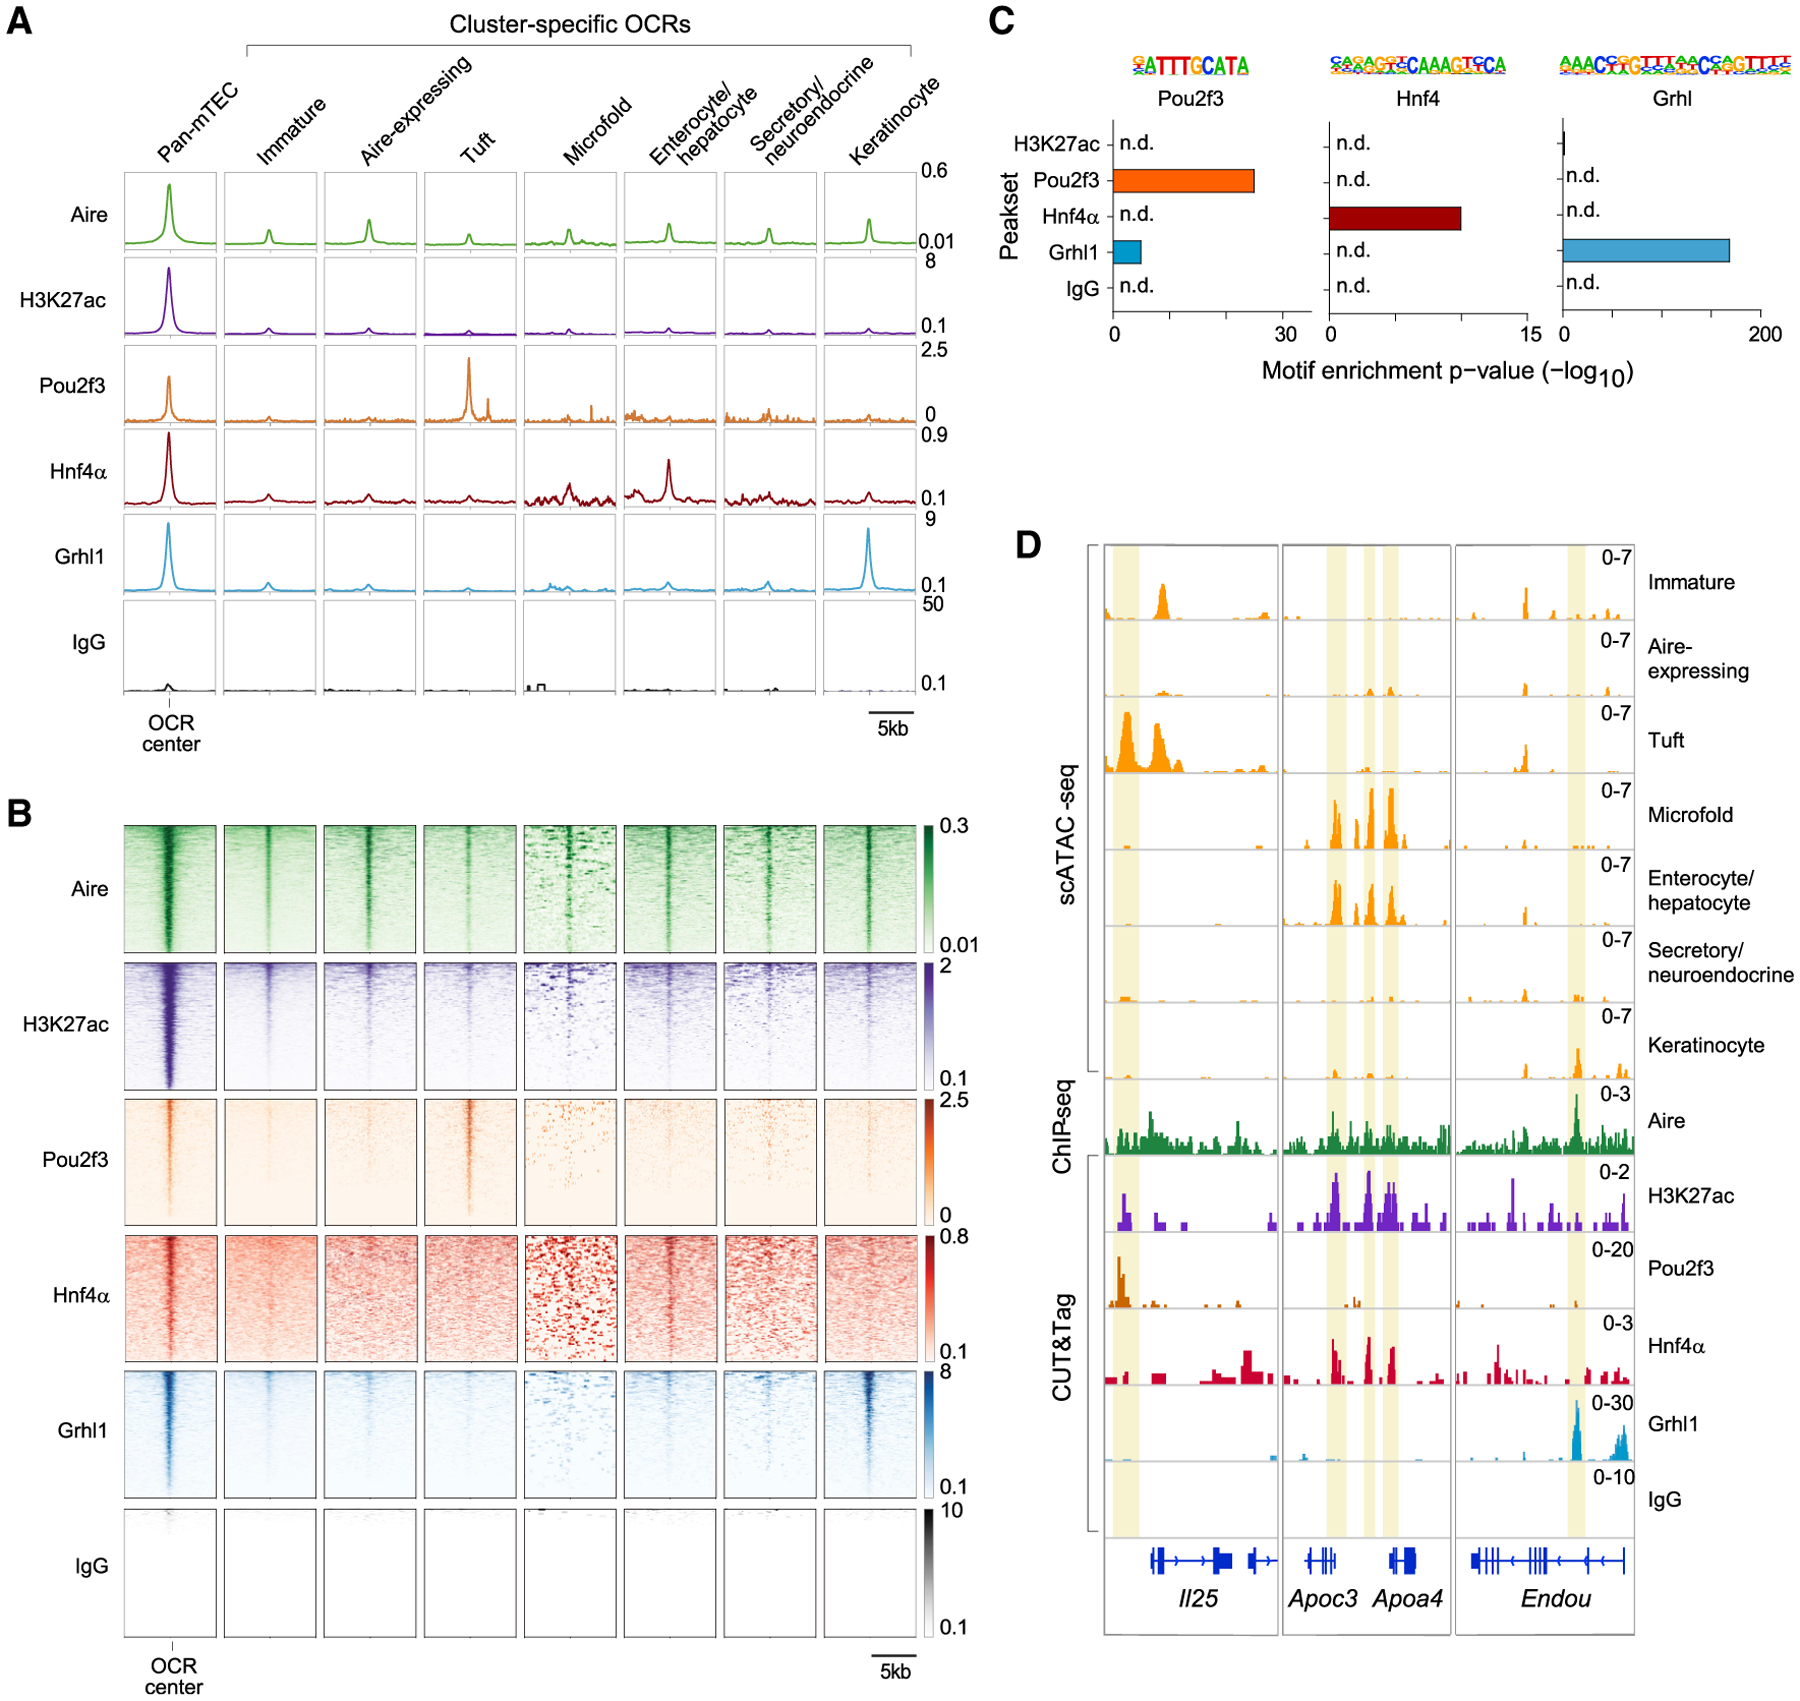
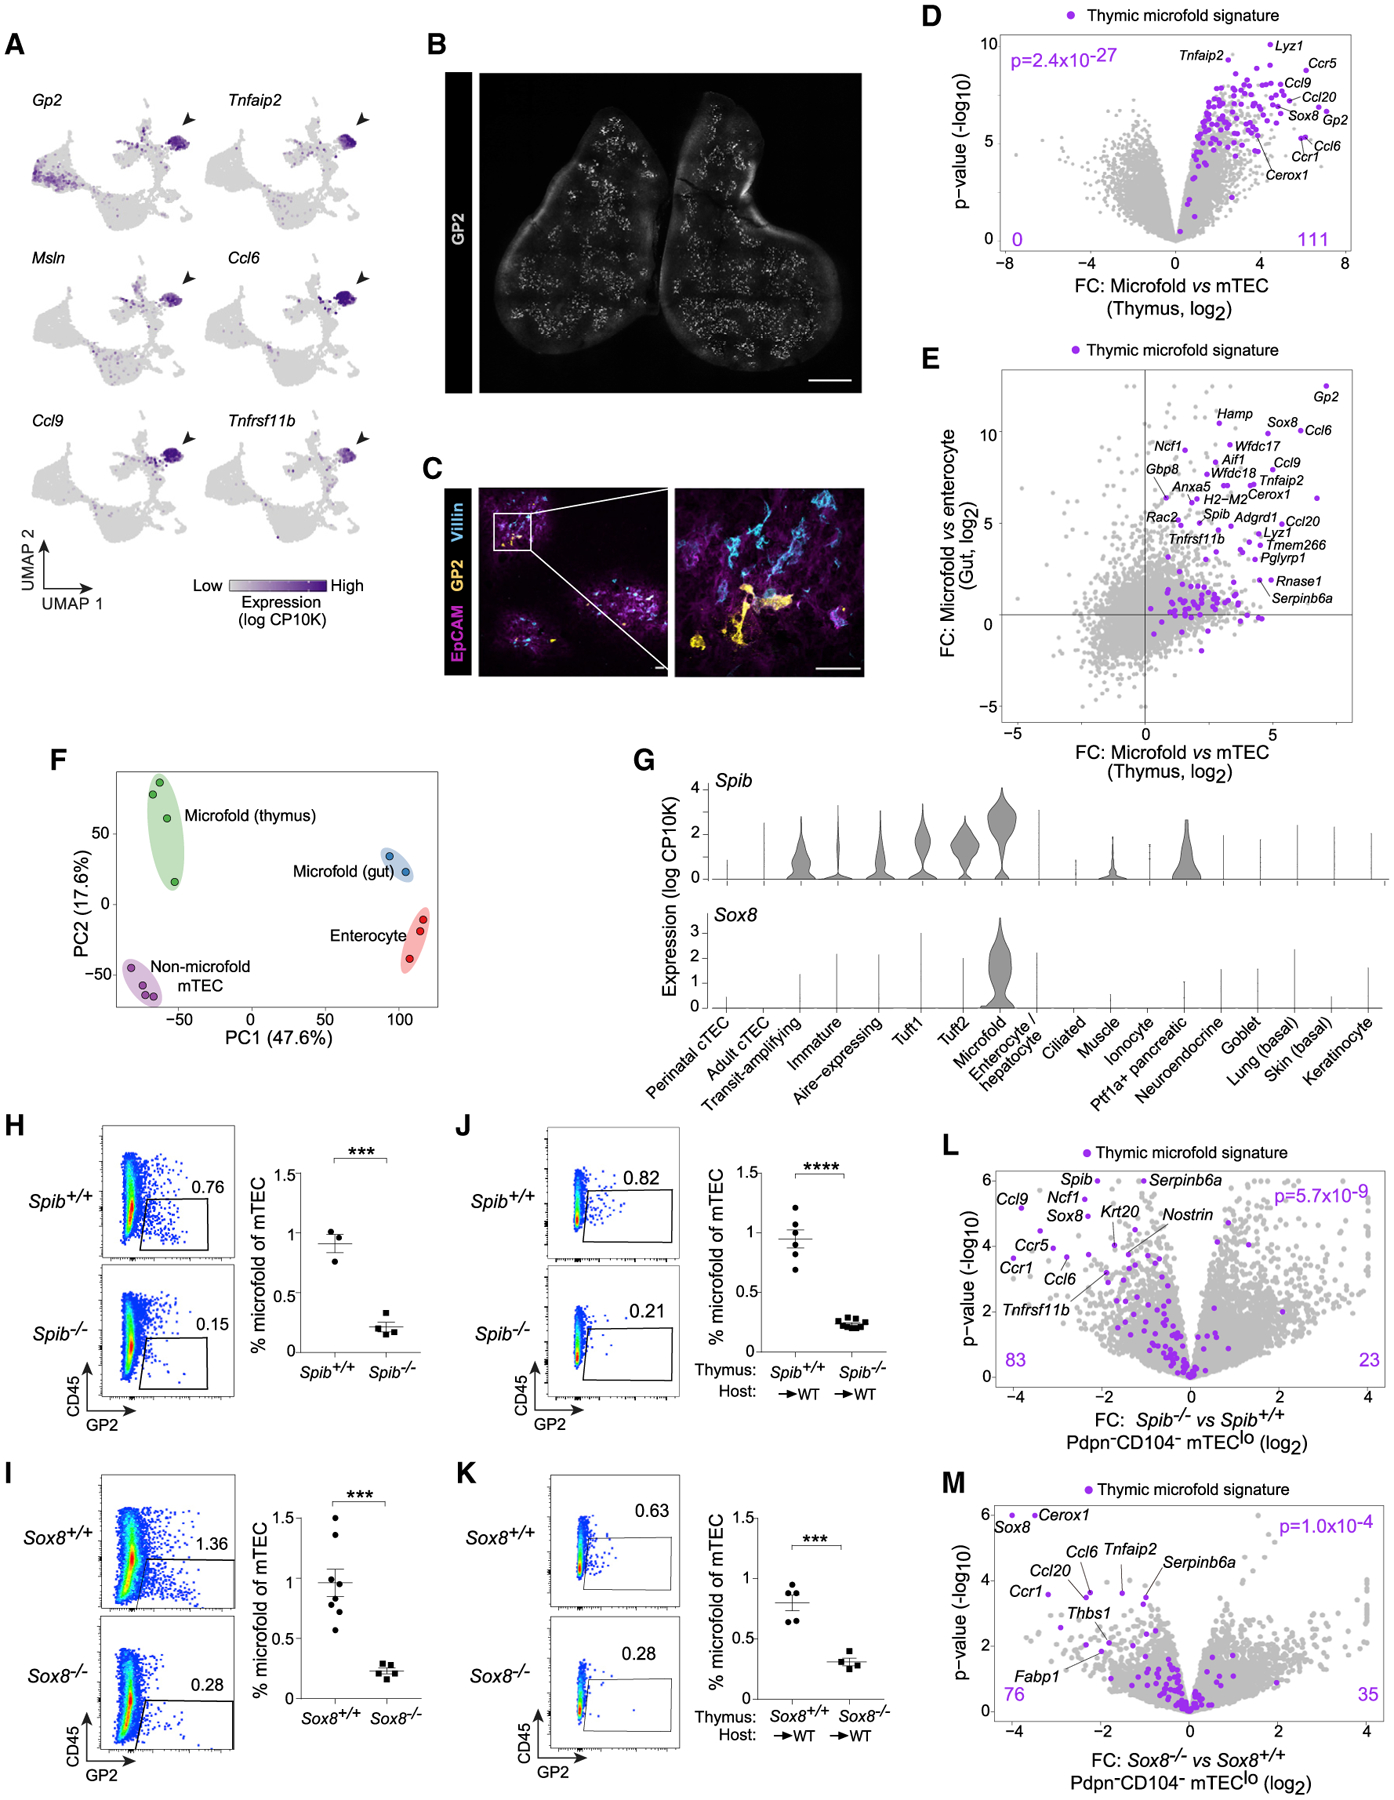
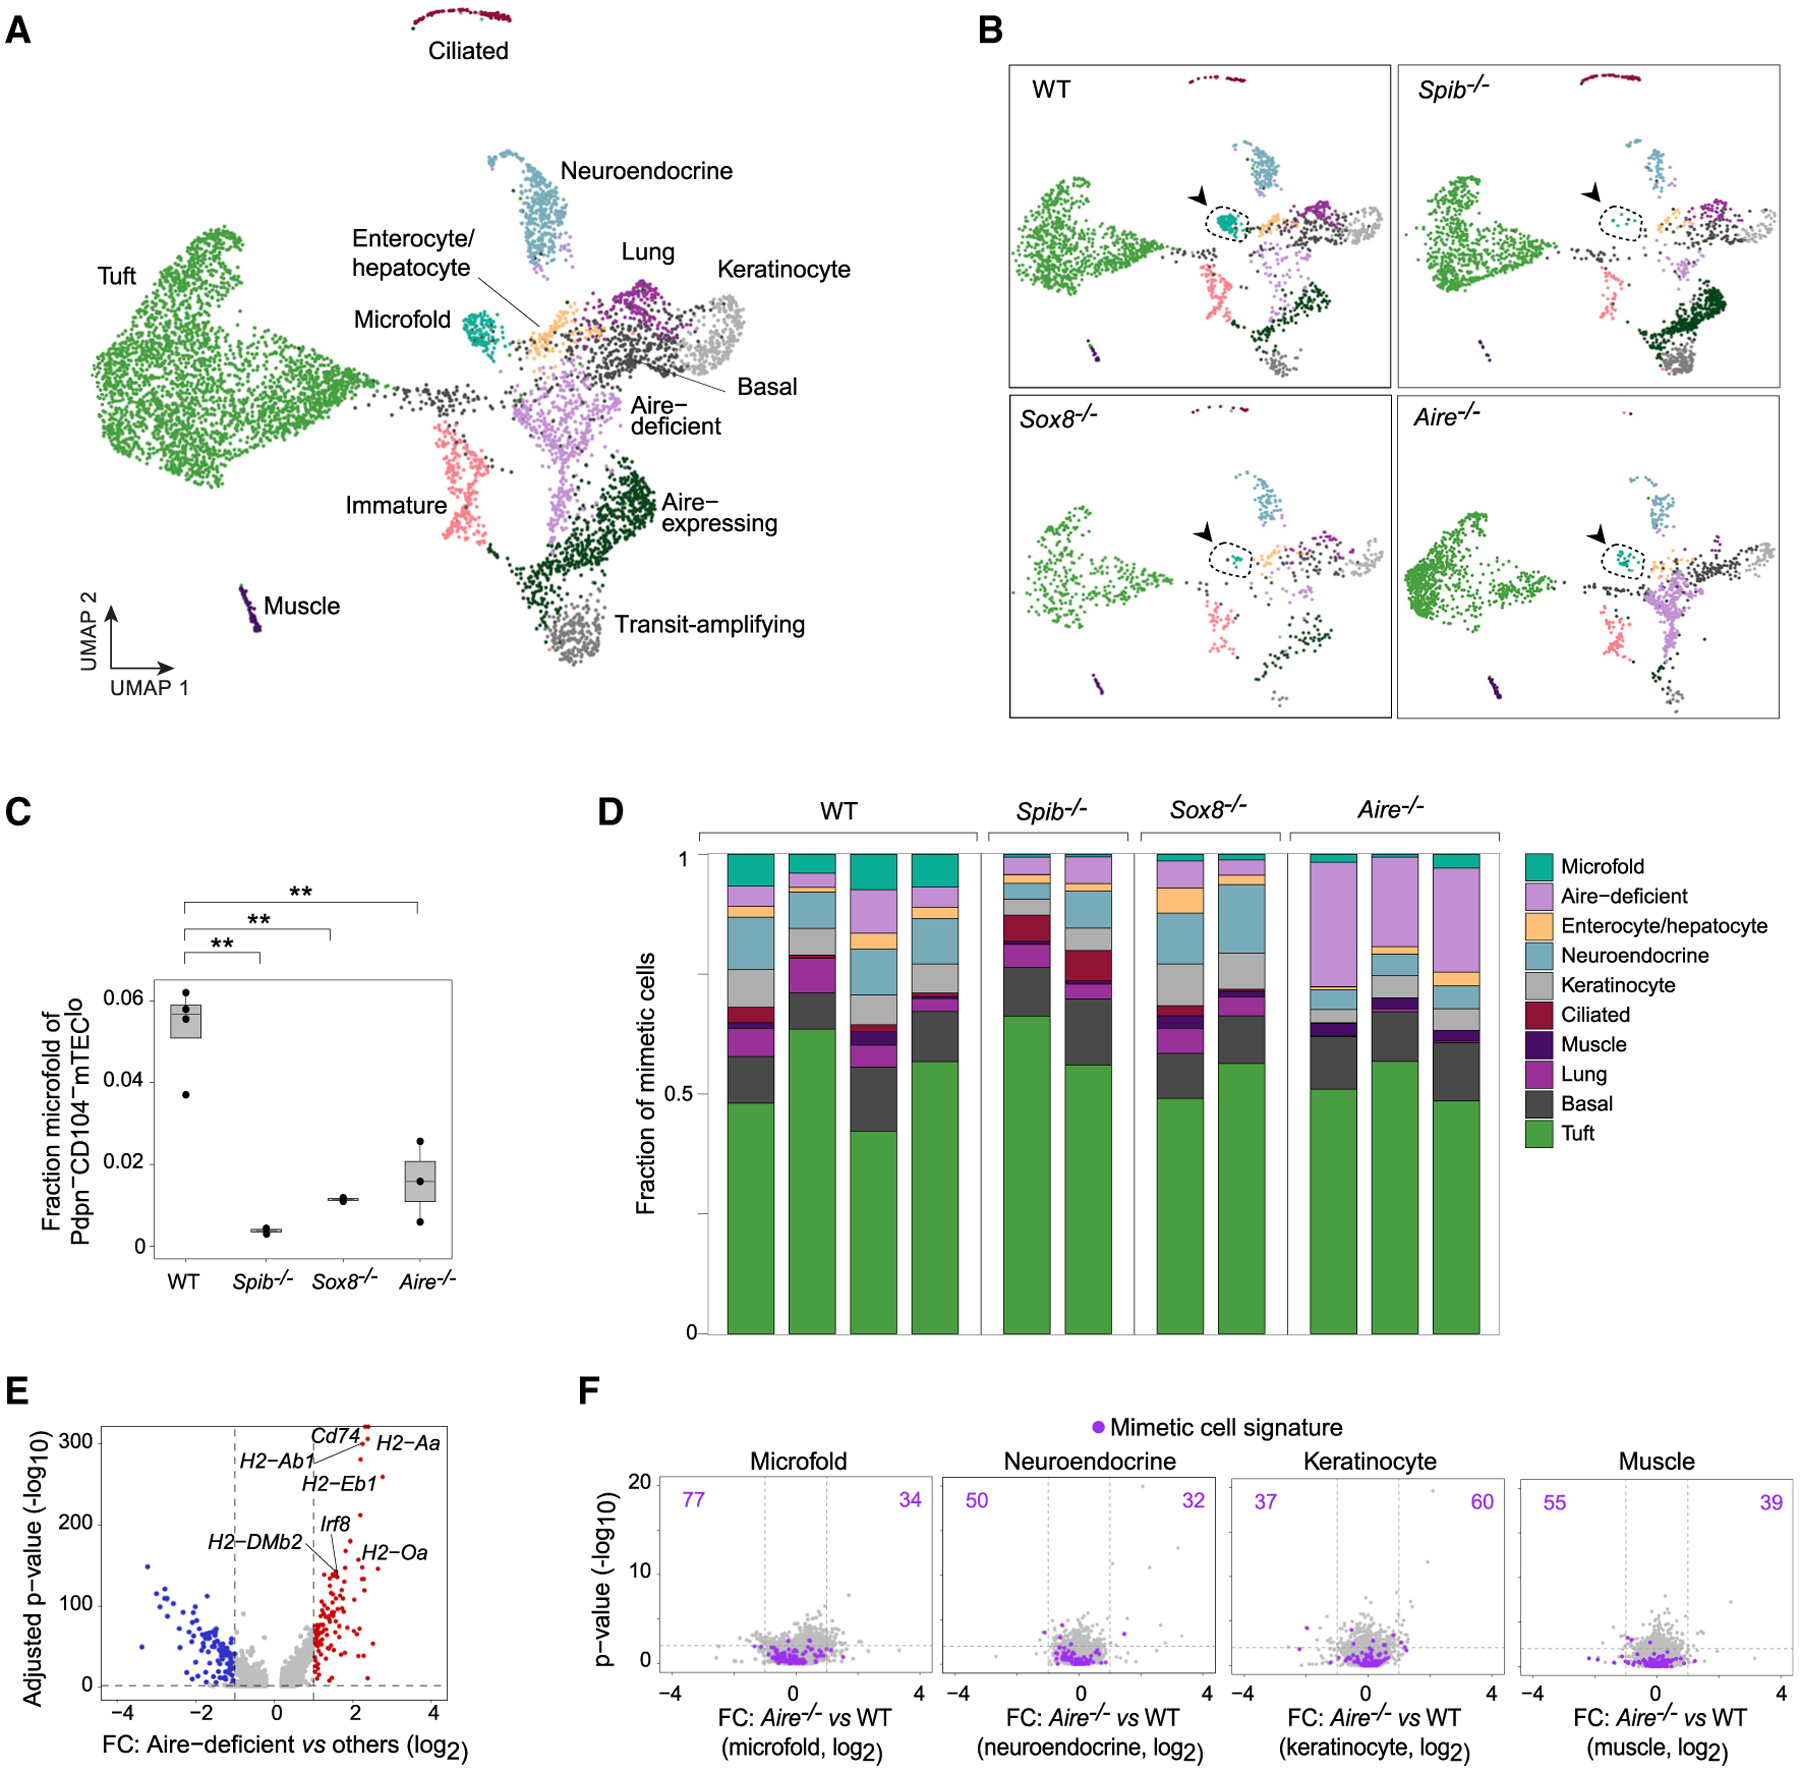
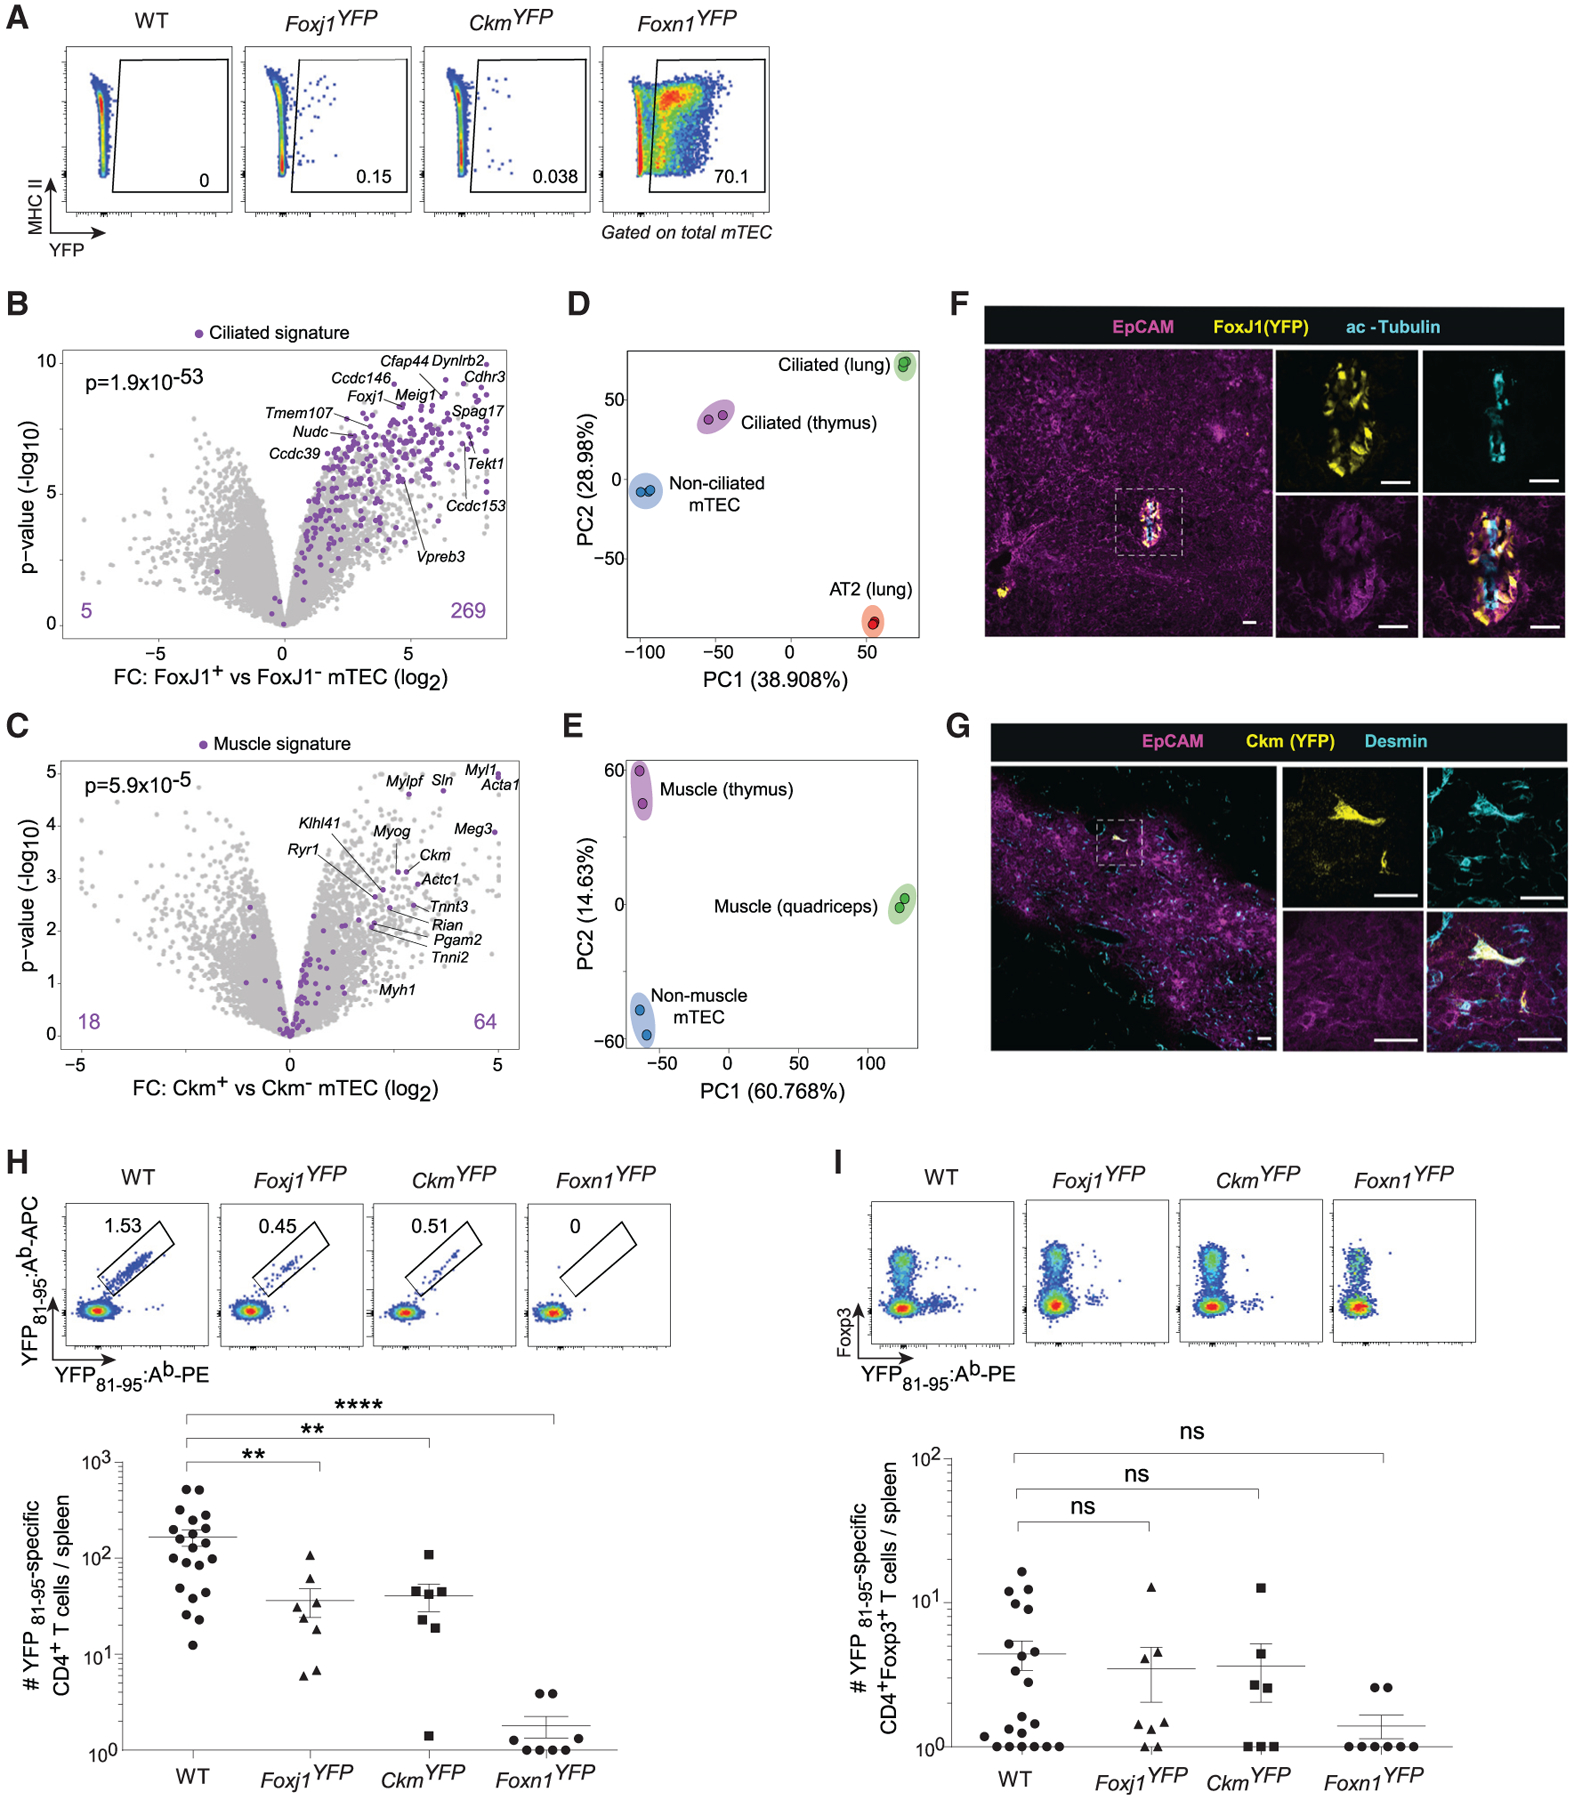
Medullary thymic epithelial cells (mTECs) ectopically express thousands of peripheral-tissue antigens (PTAs), which drive deletion or phenotypic diversion of self-reactive immature T cells during thymic differentiation. Failure of PTA expression causes multiorgan autoimmunity. By assaying chromatin accessibility in individual mTECs, we uncovered signatures of lineage-defining transcription factors (TFs) for skin, lung, liver, and intestinal cells-including Grhl, FoxA, FoxJ1, Hnf4, Sox8, and SpiB-in distinct mTEC subtypes. Transcriptomic and histologic analyses showed that these subtypes, which we collectively term mimetic cells, expressed PTAs in a biologically logical fashion, mirroring extra-thymic cell types while maintaining mTEC identity. Lineage-defining TFs bound to mimetic-cell open chromatin regions and were required for mimetic cell accumulation, whereas the tolerogenic factor Aire was partially and variably required. Expression of a model antigen in mimetic cells sufficed to induce cognate T cell tolerance. Thus, mTECs co-opt lineage-defining TFs to drive mimetic cell accumulation, PTA expression, and self-tolerance.

Keywords: Aire; T cell; Treg; autoimmunity; mTEC; microfold; mimetic cell; thymus; tolerance; transcription factor.


Conflict of interest statement

Declaration of interests The authors declare no competing interests.

Figures

Figure 1.
Figure 1.. Individual mTECs occupy diverse chromatin states, some strongly influenced by Aire
(A) Merged UMAP of scATAC-seq of mTEChi from Aire+/+ (n = 2) and Aire–/(n = 2) mice. For all UMAPs, each dot is a single cell. (B) Chromatin-accessibility tracks for mTEC clusters at the indicated loci. Signal is in counts per million (CPM). (C and D) Single-cell (C) and cluster-level (D) chromatin accessibility at unique OCRs identified for each mTEC cluster. For each cluster, the top 50 unique OCRs and (for C) up to 100 randomly sampled cells are shown. (E) Comparison of the distributions of mTECs from Aire+/+ and Aire−/− mice in UMAP space. (F) Mean fraction (top) and number (bottom) of mTECs in each cluster from Aire+/+ (green) and Aire−/− (purple) mice. nd, not detected. (G) Comparisons of chromatin accessibility at the indicated genomic features between Aire-expressing mTECs from Aire+/+ mice and Aire-deficient mTECs (cluster 5) from Aire−/− mice. Each gray dot is a single cell. p values were calculated by the Wilcoxon rank-sum test with Bonferroni correction. See also Figure S1.
Figure 2.
Figure 2.. Small subsets of mTECs harbor the lineage-defining TFs and chromatin landscapes of peripheral cell types
(A) Cluster-level TF-motif-enrichment analysis of mTEC scATAC-seq data. (B) Single-cell TF-motif-enrichment analysis of scATAC-seq data. q25, 25th quantile; q95, 95th. (C) Immunofluorescence of the indicated markers in thymic sections, showing wide (top) and zoomed (bottom) views. Scale bars, 50 μm. (D) Chromatin-accessibility tracks for mTEC clusters at the indicated loci. Signal is in CPM. See also Figure S2.
Figure 3.
Figure 3.. Mimetic cells comprise a diverse mTEC compartment with biologically logical PTA expression
(A) Representative flow plots showing Pdpn and CD104 expression in mTEClo across mouse development. (B) PCA of bulk RNA-seq of pre-Aire mTEClo, Aire-stage mTEChi, and post-Aire mTEClo (n = 3 for each). Each dot is one biological replicate. (C) Merged UMAP of scRNA-seq of PdpnCD104 mTEClo from perinatal (n = 3) and adult (n = 3) mice. (D) UMAPs of gene-signature expression from the indicated extra-thymic cell types in mTECs, assayed by scRNA-seq. Log CP10K, natural log1p of counts per 10,000 counts. (E) Volcano plots of scRNA-seq of the indicated mTEC subtypes versus all other cells. Per-gene p values were BH-corrected. FC, fold change. (F) Cluster-level expression of transcripts encoding various TFs, assayed by scRNA-seq. (G) Heatmap of expression of transcripts encoding marker genes for each mTEC subtype, assayed by scRNA-seq. For each subtype, up to 50 randomly sampled cells are shown. Rows are cells, columns are genes, and two genes per subtype are labeled. Aire-induced genes are highlighted in red. See also Figures S3 and S4 and Tables S1 and S2.
Figure 4.
Figure 4.. Lineage-defining TFs bind to mimetic-cell OCRs
(A and B) Profile plots (A) and heatmaps (B) of binding of the indicated factors to the indicated OCRs previously defined by scATAC-seq, assayed by CUT&Tag (H3K27ac, Pou2f3, Hnf4α, Grhl1, and IgG) or ChIP-seq (Aire). For profile plots, mean signal is shown. For heatmaps, each row is one OCR. (C) TF-motif enrichment in the peaksets of the indicated factors. (D) Genome tracks showing chromatin accessibility in mTEC subtypes (yellow) and binding of the indicated factors at the indicated loci. In (A), (B), and (D), signal is in CPM and was merged from n = 2 (Aire, H3K27ac, and IgG), n = 3 (Grhl1), n = 4 (Hnf4α), or n = 8 (Pou2f3) independent replicates. See also Figure S5 and Table S3.
Figure 5.
Figure 5.. Mimetic cell accumulation requires lineage-defining TFs
(A) UMAPs showing expression of microfold-associated transcripts in mTECs, assayed by scRNA-seq. (B) Representative 2D slice of thymus whole-mount immunofluorescence of GP2. Scale bar, 1 mm. (C) Immunofluorescence of EpCAM, GP2, and Villin in thymic sections. Scale bars, 30 μm. (D) Volcano plot of bulk RNA-seq of purified GP2+CD45neg mTEC (n = 4) versus GP2CD45neg mTEC (n = 4). (E) FC/FC plot comparing thymic microfold mTECs and gut M cells versus their respective epithelial counterparts. (F) PCA of bulk RNA-seq of non-microfold mTEC (n = 4), microfold mTEC (n = 4), gut M cells (n = 2), and enterocytes (n = 3). Each dot is one biological replicate. (G) Violin plots showing the distribution of Spib and Sox8 expression in mTEC subtypes, assayed by scRNA-seq. (H–K) Representative flow plots (left) and summarized data (right) of microfold mTEC abundance in (H) Spib+/+ (n = 3) versus Spib/(n = 4) thymi; (I) Sox8+/+ (n = 8) versus Sox8/(n = 5) thymi; (J) Spib+/+ (n = 6) versus Spib/(n = 9) thymi grafted into WT hosts; and (K) Sox8+/+ (n = 5) versus Sox8/ (n = 4) thymi grafted into WT hosts. For (H)–(K), data were pooled from two independent experiments, each dot is one mouse, bars show mean ± SEM, and p values were calculated by unpaired, two-sided Student’s t tests. (L and M) Volcano plots of bulk RNA-seq of PdpnCD104 mTEClo from (L) Spib/ versus Spib+/+ mice and (M) Sox8/ versus Sox8+/+ mice (n = 3 for each). For (D), (L), and (M), signature p values were calculated by chi-square tests. See also Figures S6 and S7 and Table S4.
Figure 6.
Figure 6.. Mimetic cells depend strictly on lineage-defining TFs and variably on Aire
(A) Merged UMAP of scRNA-seq of PdpnCD104 mTEClo from WT (n = 4), Spib/ (n = 2), Sox8/ (n = 2), and Aire/ (n = 3) mice. (B) Data from (A), split by genotype. Arrows and dashed lines indicate the microfold mTEC cluster. (C) Fraction of microfold mTECs among PdpnCD104 mTEClo, assayed by scRNA-seq and split by genotype. Each dot is one mouse, and p values are from two-sided, unpaired Student’s t tests. (D) Fraction of each mimetic cell subtype among all mimetic cells in each scRNA-seq replicate from the indicated genotypes. (E) Volcano plot of scRNA-seq of Aire-deficient mTECs versus all other cells. Per-gene p values were BH-corrected. (F) Volcano plots of scRNA-seq of the indicated mimetic cell subtypes from Aire/ versus WT mice. For each subtype, the corresponding gene signature is highlighted in purple.
Figure 7.
Figure 7.. Expression of a model antigen in mimetic cells suffices to induce T cell tolerance
(A) Representative flow plots showing YFP expression in mTECs from the indicated strains. (B and C) Volcano plots of bulk RNA-seq of purified YFP+ versus YFP mTECs from (B) Foxj1YFP and (C) CkmYFP mice. Signature p values were calculated by chi-square tests. (D and E) PCA of bulk RNA-seq of (D) non-ciliated mTEC (n = 3), ciliated mTEC (n = 2), ciliated airway cells (n = 3), and alveolar type 2 (AT2) lung epithelial cells (n = 3), and (E) non-muscle mTEC (n = 2), muscle mTEC (n = 2), and quadriceps skeletal muscle (n = 2). Each dot is one biological replicate. (F and G) Immunofluorescence of thymic sections from (F) Foxj1YFP and (G) CkmYFP mice, stained for the indicated markers. Scale bars, 30 μm. (H and I) Representative flow plots (top) and summarized data (bottom) of the number of YFP81–95specific CD4+ T cells (H) and CD4+Foxp3+ Tregs (I) elicited in the indicated strains. For summarized data in (H) and (I), each dot is one mouse, data are pooled from 6 independent experiments, bars show mean ± SEM, and p values were calculated by one-way ANOVA with Dunnett’s test on log-transformed cell numbers. Mice with zero antigen-specific T cells were assigned a value of 1 to allow for log-transformation. See also Table S4.

Comment in

References

    1. Aaltonen J, Bjorses P, Perheentupa J, Horelli-Kuitunen N, Palotie A, Peltonen L, Lee YS, Francis F, Henning S, Thiel C, et al. (1997). An autoimmune disease, APECED, caused by mutations in a novel gene featuring two PHD-type zinc-finger domains. Nat. Genet 17, 399–403. - PubMed
    1. Abramson J, and Anderson G (2017). Thymic epithelial cells. Annu. Rev. Immunol 35, 85–118. - PubMed
    1. Abramson J, Giraud M, Benoist C, and Mathis D (2010). Aire’s partners in the molecular control of immunological tolerance. Cell 140, 123–135. - PubMed
    1. Anderson MS, and Su MA (2016). AIRE expands: new roles in immune tolerance and beyond. Nat. Rev. Immunol 16, 247–258. - PMC - PubMed
    1. Anderson MS, Venanzi ES, Klein L, Chen Z, Berzins SP, Turley SJ, von Boehmer H, Bronson R, Dierich A, Benoist C, et al. (2002). Projection of an immunological self shadow within the thymus by the aire protein. Science 298, 1395–1401. - PubMed

Publication types