. 2022 Jun 17;5(10):e202201478.
doi: 10.26508/lsa.202201478. Print 2022 Oct.

TMBIM5 loss of function alters mitochondrial matrix ion homeostasis and causes a skeletal myopathy

Affiliations

TMBIM5 loss of function alters mitochondrial matrix ion homeostasis and causes a skeletal myopathy

Li Zhang et al. Life Sci Alliance. .

Abstract

Ion fluxes across the inner mitochondrial membrane control mitochondrial volume, energy production, and apoptosis. TMBIM5, a highly conserved protein with homology to putative pH-dependent ion channels, is involved in the maintenance of mitochondrial cristae architecture, ATP production, and apoptosis. Here, we demonstrate that overexpressed TMBIM5 can mediate mitochondrial calcium uptake. Under steady-state conditions, loss of TMBIM5 results in increased potassium and reduced proton levels in the mitochondrial matrix caused by attenuated exchange of these ions. To identify the in vivo consequences of TMBIM5 dysfunction, we generated mice carrying a mutation in the channel pore. These mutant mice display increased embryonic or perinatal lethality and a skeletal myopathy which strongly correlates with tissue-specific disruption of cristae architecture, early opening of the mitochondrial permeability transition pore, reduced calcium uptake capability, and mitochondrial swelling. Our results demonstrate that TMBIM5 is an essential and important part of the mitochondrial ion transport system machinery with particular importance for embryonic development and muscle function.


Conflict of interest statement

The authors declare that they have no conflict of interest.

Figures
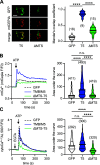
Figure 1.
Figure 1.. Overexpressed TMBIM5 mediates mitochondrial Ca2+ uptake.
(A) Overexpression of TMBIM5-GFP (T5) but not of GFP alone or of a mutant lacking the mitochondrial targeting signal (ΔMTS) co-localizes with R-CEPIA3mt. Scale bar, 10 μm. Left panel shows exemplary pictures and the right panel the quantification of colocalization. (B, C) Overexpression of TMBIM5-GFP but not GFP or ΔMTS-T5 increases (B) mitochondrial Ca2+ levels measured with R-CEPIA3mt but not (C) cytosolic Ca2+ levels upon ATP-mediated Ca2+ release from the ER. Data are shown as violin plots with the mean and the 25th to 75th percentile indicated. Statistical significance was calculated with the Kruskal–Wallis test, n is indicated in brackets or shown as individual data points, biological replicates (N) = 3, ****P < 0.0001, n.s., nonsignificant.
Figure 2.
Figure 2.. No alteration of mitochondrial Ca2+ uptake in TMBIM5-deficient cells.
(A) Immunoblot demonstrating loss of TMBIM5 expression in KO HEK293 cells after CRISPR/Cas9-mediated gene inactivation. Size is indicated, β-actin served as loading control. Wild-type, WT. (B) Disrupted cristae architecture with ballooning cristae and cristae loss shown by transmission electron microscopy. Scale bar 1 μm. (C) Reduced oxygen consumption in TMBIM5 KO cells measured in a Seahorse assay. (D) Overexpression of TMBIM5 (T5) but not empty vector (GFP) or TMBIM5 with point mutations in the channel pore (D294R/D325R, DM) rescues reduced mitochondrial Ca2+ transients measured with R-CEPIA3mt upon ATP-mediated Ca2+ release from the ER. (E) The reduced mitochondrial Ca2+ uptake in KO cells is not caused by differences in the driving force because the membrane potential measured with TMRM in a high-content microscope is similar in WT and T5-rescued KO cells. (F, G) Unchanged mitochondrial Ca2+ uptake and membrane potential in reductionist Ca2+ uptake assays. WT and KO cells were permeabilized with digitonin in the presence of the SERCA inhibitor thapsigargin and loaded with the radiometric Ca2+ sensor Fura-FF. The ratiometric mitochondrial membrane potential (∆ψ) reporter, JC-1, was added at 20 s. At 300 s, a 3 μM Ca2+ bolus was added followed by a 10 μM Ca2+ bolus at 400 s. Ru360, to inhibit the mitochondrial calcium uniporter, was added at 500 s and after 600 s, the protonophore, FCCP. Shown below from left to right: total mCa2+ uptake (area-under the curve) post 3 μM Ca2+ bolus, total mCa2+ uptake (area-under the curve) post 10 μM Ca2+ bolus, mCa2+ efflux rate post Ru360 addition and total mCa2+ efflux (area-under the curve) post Ru360 addition. (D, E, G) Data are shown as mean ± SE in C (n = 3), scatter plots of individual values with mean ± SE in (G), or violin plots with the mean, the 25th to 75th percentile and n indicated in (D) and (E). (C, D, E, G) Statistical significance was calculated with the Kruskal–Wallis (D, E) or the Mann–Whitney test (C, G). *P < 0.05; **P < 0.001; ****P < 0.0001; n.s.; nonsignificant.
Figure S1.
Figure S1.. The putative loop domain is conserved between human TMBIM5, TMBIM6/BI-1, and their bacterial orthologue BsYetJ.
(A) Phylogenetic analysis of the sequence alignment of the three proteins created using the maximum likelihood algorithm with the BLOSUM62 substitution matrix and 100 bootstrap trials. The branch support values are indicated above the branches. (B) TMBIM5 has a mitochondrial targeting signal (MTS) and an additional transmembrane domain I but otherwise shares the same overall structure, with the last domain being much less hydrophobic than the others. Hydrophobicity plots were generated by TMpred. Putative transmembrane domains are indicated by roman numerals. The TMBIM6 homology loop domain is indicated by a horizontal line. (C) Multiple protein sequence alignment of the three proteins was performed using PRALINE with the BLOSUM62 scoring matrix. The colors indicate the least conserved (blue) to the most conserved residues (red). Nonaligning N termini of each protein were removed. Arrowheads indicate key residues previously shown to be important in gating pH-dependent Ca2+ leak by BsYetJ and TMBIM6/BI-1 and the corresponding residues in TMBIM5 (D295 and D326).
Figure 3.
Figure 3.. TMBIM5 deficiency alters the K+/H+ homeostasis.
(A) Raw traces show Fura FF recordings corresponding to extramitochondrial Ca2+ levels to monitor matrix free Ca2+. Matrix free Ca2+ was calculated as total Ca2+ released from mitochondria in response to FCCP induced mitochondrial depolarization. AUC, area under the curve. (B) No alteration in mitochondrial [Ca2+] in TMBIM5 KO cells quantitated using a ratiometric matrix Ca2+ sensor mito-mCherry-GCamP6. MCU KO cells served as control and have lower Ca2+ levels. (C) Increased matrix K+ (measured with NK1) but not Na+ (measured with SBFI) concentration measured using specific probes. (D) Reduced matrix proton concentration in TMBIM5 KO cells determined using the pH sensor SypHer3S targeted to the mitochondrial matrix. (E) Reduced H+ extrusion in TMBIM5 KO cells in response to 200 mM KCl added to permeabilized cells determined using the pH sensor SypHer3S targeted to the mitochondrial matrix. EDTA/A23187 (E/A) was added to enhance KHE activity. The KHE blocker quinine abolishes the response in both cell lines. E/A or quinine were added at time point 0. (F) Reduced KHE activity in TMBIM5 KO cells. Mitochondrial preparations were treated with 5 μM antimycin A and 10 mM EDTA, 1 μM A23187, and the absorbance quantified immediately after adding the KOAc. In control experiments, the KHE inhibitor quinine (1 mM) was added together with EDTA/A23187. (A, B, C, D, E) Data were plotted as box and whisker plots with the box representing the 25–75th percentile and the whiskers indicating min to max, each dot represents an individual experimental measure (A) or the mean of one individual experiment conducted in triplicates (B, C, D, E). (E, F) Curves with shadow in (E) and (F) show the mean ± SE of n = 5 individual experiments. (A, B, C, D, E) Statistical analysis was done using the Mann–Whitney test in (A, D, E) and nested one-sample t tests in (B, C). *P < 0.05; **P < 0.001; ****P < 0.0001; n.s.; nonsignificant.
Figure 4.
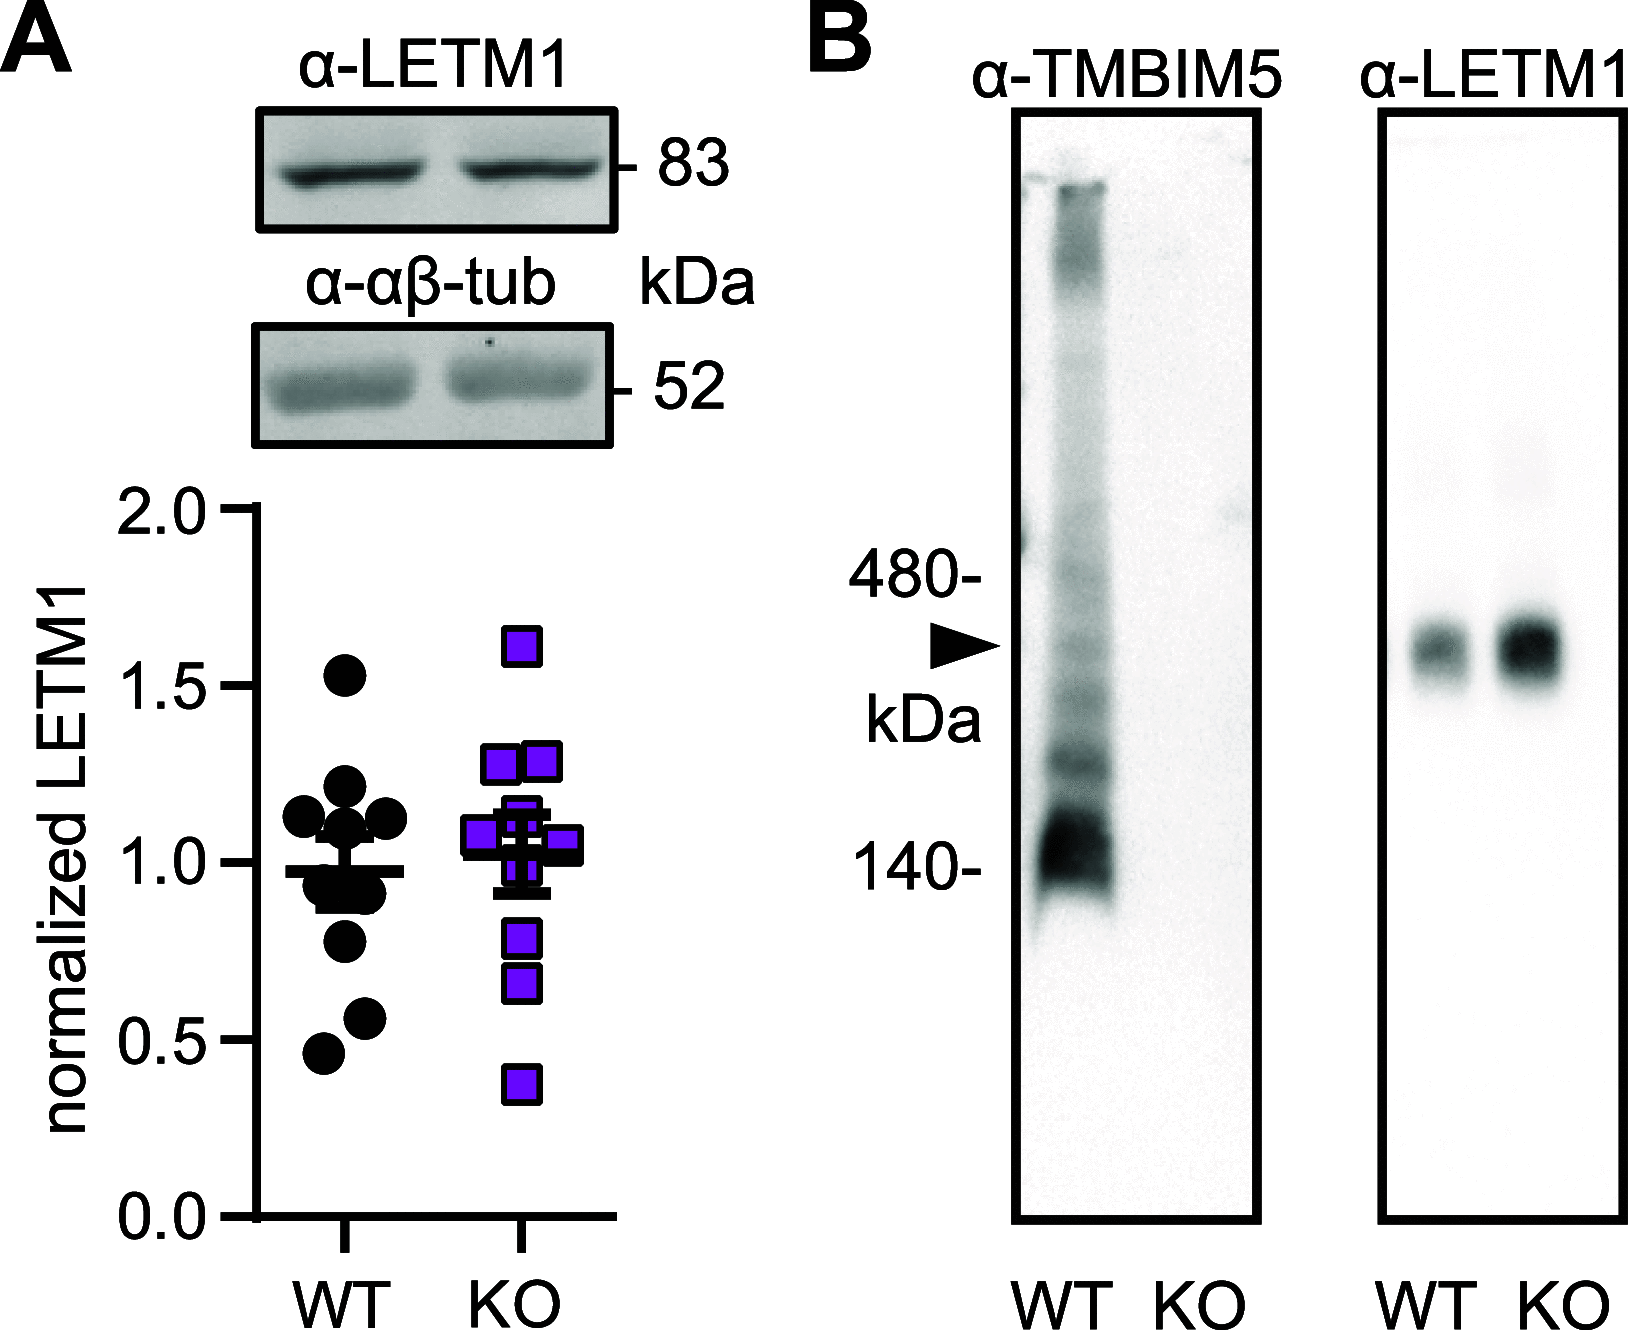
Figure 4.. TMBIM5 does not associate with LETM1 in a macromolecular complex.
(A) LETM1 abundance is unchanged in KO cells shown by immunoblotting. Molecular weight is indicated, actin and αβ-tubulin served as controls. (B) Blue native gel electrophoresis of TMBIM5 and LETM1. Molecular weight is indicated. Arrowhead indicates molecular weight of the LETM1 complex. Each dot in (A) represents one immunoblot, mean ± SEM, non significant, t test.
Figure 5.
Figure 5.. Mutation of a conserved critical residue in the presumed channel pore associates with late embryonic lethality and a skeletal myopathy in mice.
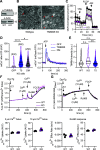
(A) Immunoblotting of TMBIM5 demonstrates a drastic reduction of TMBIM5 protein expression in all tested tissues. CoxIV served as loading control. Size is indicated. (B) Reduced number of genotyped homozygous TMBIM5 D326R mice than expected from heterozygous breeding. This is not the case for E14 embryos, indicating increased lethality at a late embryonic or perinatal time-point. (C) Reduced muscle strength in TMBIM5 D326R mice. Mice were placed on a horizontal grid and allowed to accommodate for 2 s, then the grid was turned 180° and the latency to fall was measured (WT/D326R: n = 23/25). (D) Exemplary transmission electron microscopy images showing damaged internal mitochondria architecture with ballooning of cristae in D326R skeletal muscle tissue. (E, F) Slower Ca2+ uptake and reduced uptake capacity in isolated TMBIM5 D326R skeletal muscle mitochondria. Bath Ca2+ was measured by Calcium Green-5N. When challenged with a series of Ca2+ pulses (10 μM each), mPTP in D326R mitochondria opens earlier. Ca2+ uptake is slower in the absence or presence of 2 μM CsA. On the right, rate constant (K) of the uptake slope after the indicated Ca2+ injections ± CsA. Fluorescence was normalized to the initial value (F0). (WT ± CsA: 4/5; D326R ± CsA: n = 6). Data are shown as violin blots indicating the median ± quartiles, all other data are shown as mean ± SE. (A, C) unpaired t test, (B) Chi-square test, (E, F) mixed-effects analysis, n.s. P ≥ 0.05, *P < 0.05, **P < 0.01, ***P < 0.001, ****P < 0.0001.
Figure 6.
Figure 6.. Normal heart function and increased number of normal appearing mitochondria in heart tissue of D326R mice.
(A) Transthoracic echocardiography measured in parasternal long axis (PLAX) with analysis of the cardiac output. (B) Exemplary transmission electron microscopy images showing normally structured heart mitochondria with a decrease in size but an increase in abundance. (C) Normal Ca2+ uptake and uptake capacity in isolated TMBIM5 D326R in heart mitochondria. Bath Ca2+ was measured by Calcium Green-5N. When challenged with a series of Ca2+ pulses (10 μM each), mPTP in D326R heart mitochondria opens as in wild type. On the right, rate constant (K) of the uptake slope after the indicated Ca2+ injections ± CsA. Fluorescence was normalized to the initial value (F0). (WT ± CsA: 4/5; D326R ± CsA: n = 6). Data are shown as scatter blots with mean ± SE or violin blots indicating the median ± quartiles. (A, B) unpaired t test, (C) mixed-effects analysis, n.s. P ≥ 0.05, *P < 0.05.
Figure 7.
Figure 7.. Increased swelling in TMBIM5 D326R liver mitochondria.
(A) TMBIM5 D326R liver mitochondria showed a larger delta in absorbance after osmotic shrinking with polyethylene glycol (PEG, added where indicated). Values were normalized to the last values after PEG-addition. Baseline absorbance and the ratio of absorbance before and after shrinking are quantified on the right. (B) Spontaneous K+-dependent swelling of TMBIM5 D326R mitochondria. Mitochondria were firstly de-energized with 5 μM antimycin A. Then 10 mM EDTA and 1 μM A23187 (A23) were added to deplete mitochondria from divalent cations. A540 was followed immediately after the mitochondria were resuspended in the potassium acetate-based buffer (KOAc). Resuspension in the buffer served as control (ctrl). (C) TMBIM5 D326R mitochondria exhibit slightly reduced Ca2+-induced swelling. 200 μM CaCl2 was injected at the indicated time point to induce Ca2+ overload and mPTP opening. Inhibition of mPTP with 2 μM CsA served as control. (C, D) Na+-induced swelling did not differ between WT and TMBIM5 D326R. The mitochondria were de-energized as in (C) and resuspended in sodium acetate-based buffer and the swelling was immediately recorded. Acidification of the matrix led to Na+ influx and swelling. Resuspension in the buffer served as control (ctrl). Absorbance was measured at 540 nm and normalized to the initial value. All data are shown as mean ± SE, each data point corresponds to the mean of one individual experiment. (A) n = 7, unpaired t test, P is indicated, *P < 0.05. (B) n = 4, (C, D) n = 4–6. (B, C, D) Values were normalized to initial absorbance.

Similar articles

Cited by

References

    1. Austin S, Tavakoli M, Pfeiffer C, Seifert J, Mattarei A, De Stefani D, Zoratti M, Nowikovsky K (2017) LETM1-mediated K+ and Na+ homeostasis regulates mitochondrial Ca2+ efflux. Front Physiol 8: 839. 10.3389/fphys.2017.00839 - DOI - PMC - PubMed
    1. Balaban RS (2009) The role of Ca2+ signaling in the coordination of mitochondrial ATP production with cardiac work. Biochim Biophys Acta 1787: 1334–1341. 10.1016/j.bbabio.2009.05.011 - DOI - PMC - PubMed
    1. Baughman JM, Perocchi F, Girgis HS, Plovanich M, Belcher-Timme CA, Sancak Y, Bao XR, Strittmatter L, Goldberger O, Bogorad RL, et al. (2011) Integrative genomics identifies MCU as an essential component of the mitochondrial calcium uniporter. Nature 476: 341–345. 10.1038/nature10234 - DOI - PMC - PubMed
    1. Bernardi P (1999) Mitochondrial transport of cations: Channels, exchangers, and permeability transition. Physiol Rev 79: 1127–1155. 10.1152/physrev.1999.79.4.1127 - DOI - PubMed
    1. Broekemeier KM, Dempsey ME, Pfeiffer DR (1989) Cyclosporin A is a potent inhibitor of the inner membrane permeability transition in liver mitochondria. J Biol Chem 264: 7826–7830. 10.1016/s0021-9258(18)83116-7 - DOI - PubMed

Publication types

Substances