. 2022 Jun 28;9(3):ENEURO.0216-22.2022.
doi: 10.1523/ENEURO.0216-22.2022. Print 2022 May-Jun.

Optoception: Perception of Optogenetic Brain Perturbations

Affiliations

Optoception: Perception of Optogenetic Brain Perturbations

Jorge Luis-Islas et al. eNeuro. .

Abstract

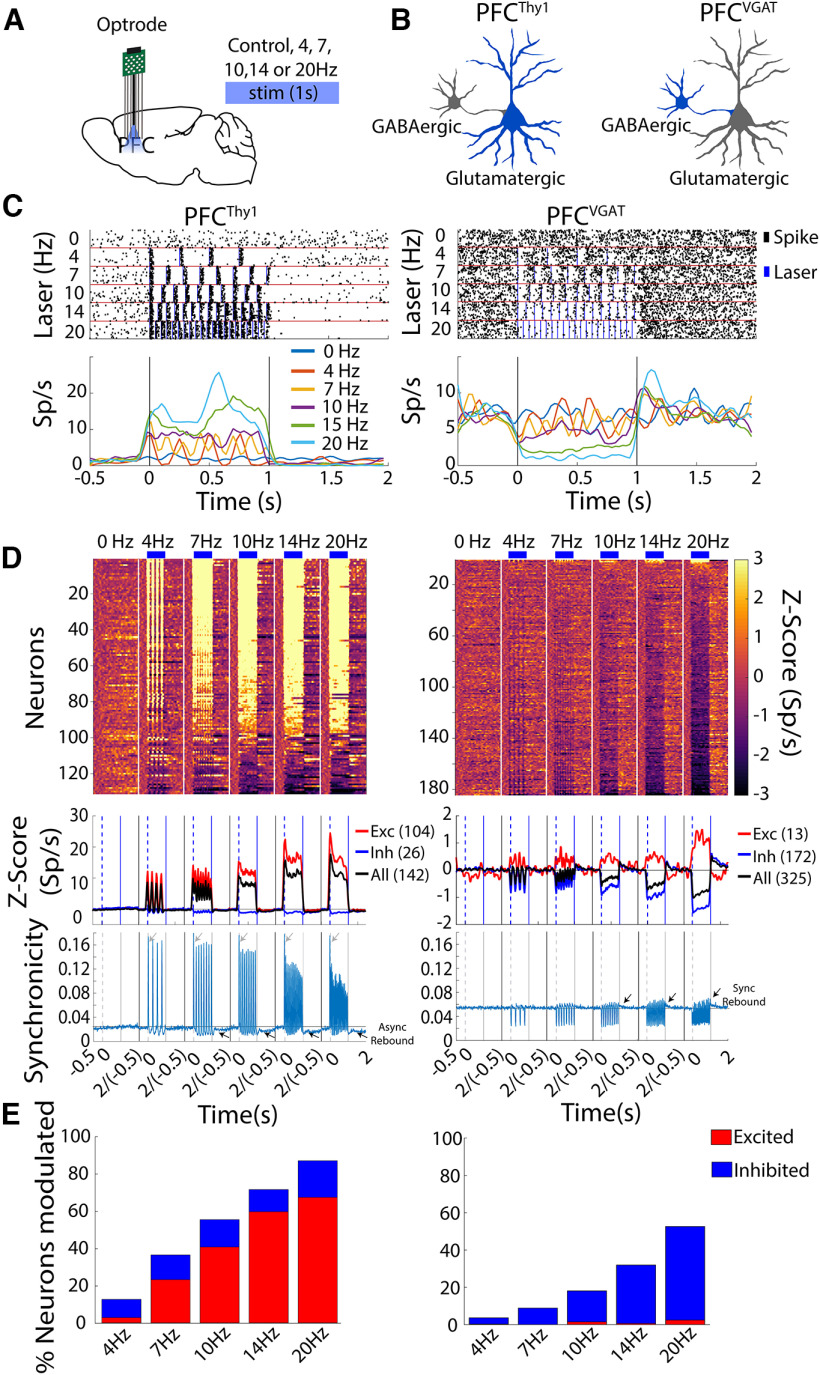
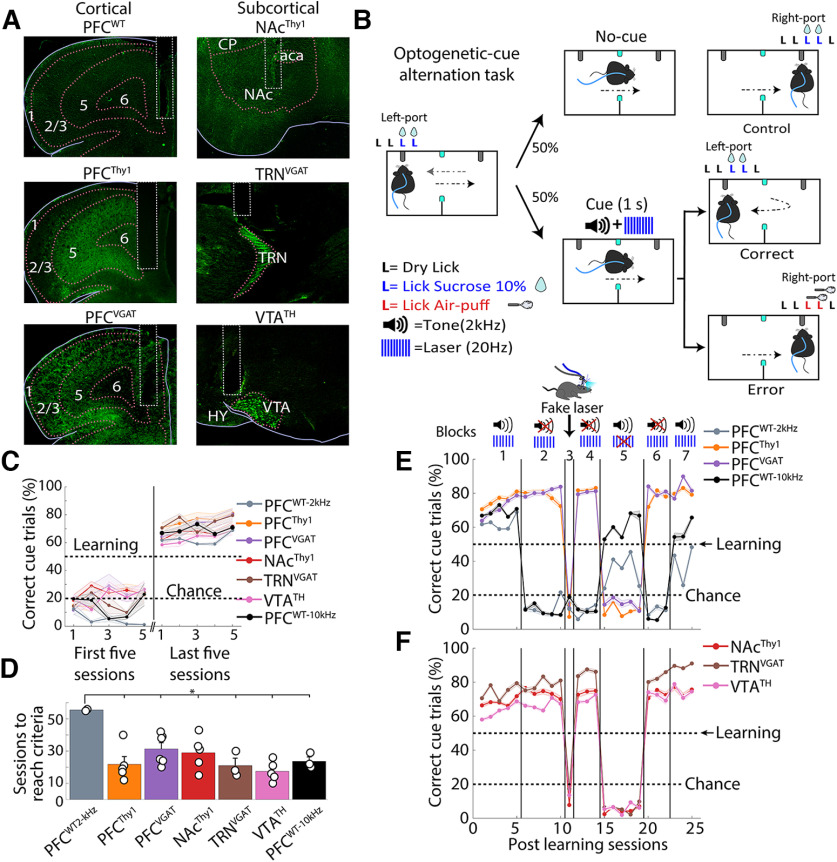
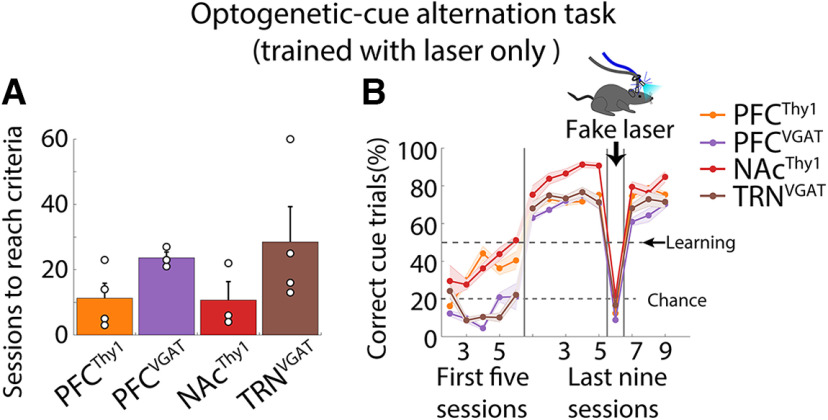
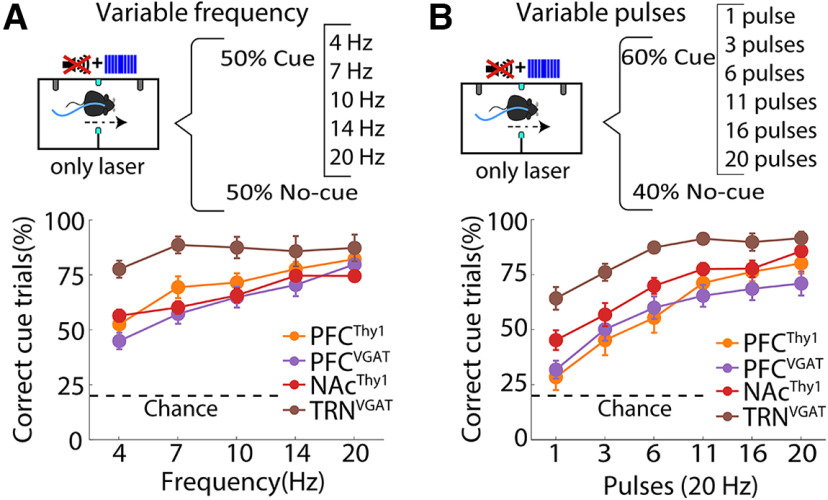
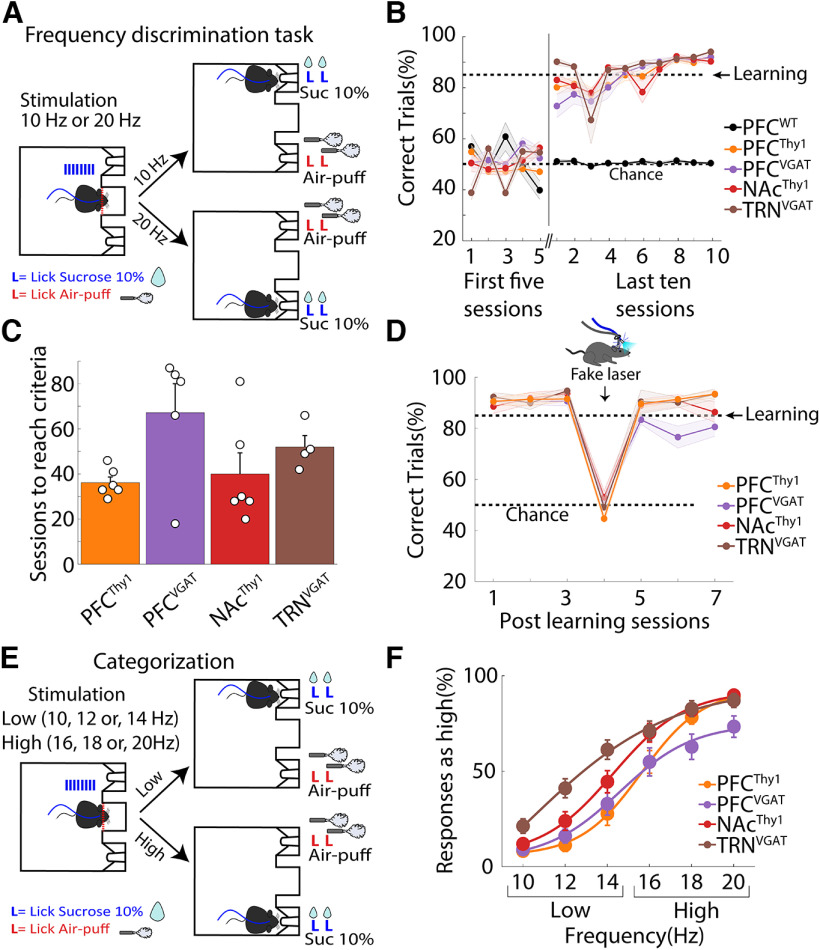
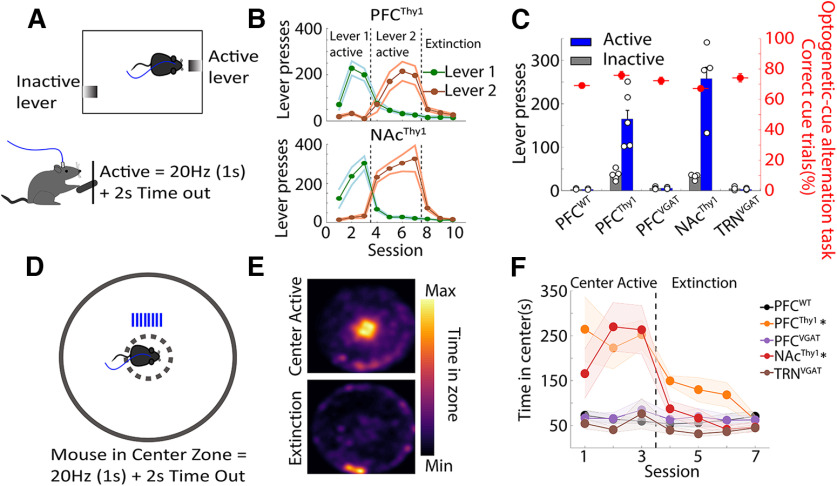
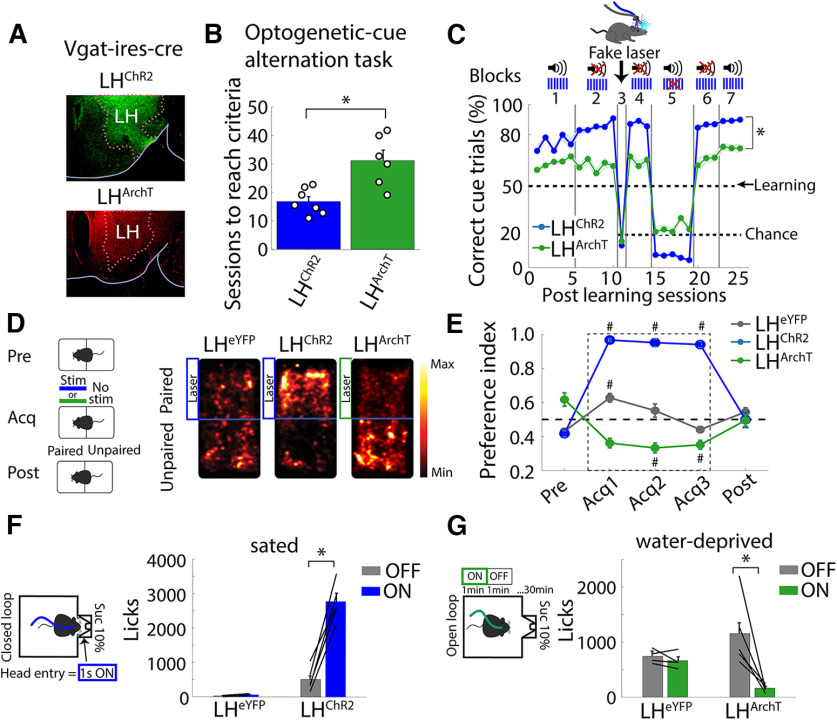
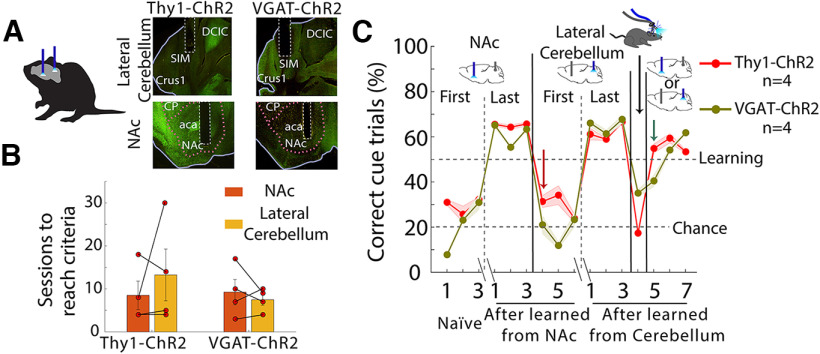
How do animals experience brain manipulations? Optogenetics has allowed us to manipulate selectively and interrogate neural circuits underlying brain function in health and disease. However, little is known about whether mice can detect and learn from arbitrary optogenetic perturbations from a wide range of brain regions to guide behavior. To address this issue, mice were trained to report optogenetic brain perturbations to obtain rewards and avoid punishments. Here, we found that mice can perceive optogenetic manipulations regardless of the perturbed brain area, rewarding effects, or the stimulation of glutamatergic, GABAergic, and dopaminergic cell types. We named this phenomenon optoception, a perceptible signal internally generated from perturbing the brain, as occurs with interoception. Using optoception, mice can learn to execute two different sets of instructions based on the laser frequency. Importantly, optoception can occur either activating or silencing a single cell type. Moreover, stimulation of two brain regions in a single mouse uncovered that the optoception induced by one brain region does not necessarily transfer to a second not previously stimulated area, suggesting a different sensation is experienced from each site. After learning, they can indistinctly use randomly interleaved perturbations from both brain regions to guide behavior. Collectively taken, our findings revealed that mice's brains could "monitor" perturbations of their self-activity, albeit indirectly, perhaps via interoception or as a discriminative stimulus, opening a new way to introduce information to the brain and control brain-computer interfaces.

Keywords: brain manipulations; interoception; optogenetics; self-perception.


Figures

Figure 1.
Figure 1.
Optogenetic stimulation of PFCThy1 or PFCVGAT transiently impacts E/I activity balance, evoking opposite neuronal responses in a laser frequency-dependent manner. A, Schematic representation of PFC recording sites in mice with optrodes record and stimulation at different frequencies. B, Diagram of neurons expressing ChR2 that were optogenetically stimulated (in blue). In PFCThy1 mice, the stimulation drives the activation of glutamatergic neurons, whereas, in PFCVGAT mice, it activates cortical GABAergic neurons inducing an indirect inhibition of glutamatergic neurons. C, Representative examples of two neurons modulated. Upper panel, raster plot of one neuron recorded from PFCThy1 (left) and the other in PFCVGAT (right) aligned to laser onset (time = 0 s). Below are shown the PSTHs, respectively. Vertical lines indicate laser onset. D, Population activity. Upper panel, Heat map of neuronal population activity from PFCThy1 (left) or PFCVGAT (right), normalized to Z-scores, vertical white lines by laser frequency. Nonmodulated neurons are not plotted. Bottom panel, Population PSTH activity. Dashed lines indicate laser onset, blue line laser offset, and the baseline (−0.5 to 0 s) black line. Below is the synchronicity index, which reflects the fraction of simultaneously recorded neurons that co-fire on a trial-by-trial basis within a 10-ms bin resolution around laser onset. Qualitatively similar results are found at 1-ms resolution (data not shown). Dashed lines indicate laser onset, solid gray line laser offset, and the baseline is shown in the black line. E, Percentage of neurons modulated by different laser frequencies for PFCThy1 (total recorded neurons, n = 142, left) or PFCVGAT (total neurons, n = 325, right).
Figure 2.
Figure 2.
Mice learn to use optogenetic manipulations as a cue regardless of the perturbed cell type or brain region. A, Representative images for fiber optics implantation and stimulation sites. Left pictures show unilateral optical fiber implanted in prefrontal cortices in WT (PFCWT), transgenic Thy1-ChR2 (PFCThy1), and VGAT-ChR2 (PFCVGAT) mice. Right pictures show fiber optics in subcortical regions, including the NAc in Thy1-ChR2 (NAcThy1), the TRN in VGAT-ChR2 (TRNVGAT), and the ventral tegmental area in TH-Cre (VTATH) mice. B, Schematic of the optogenetic-cue alternation task, where mice had to alternate between two sippers to receive two drops of 10% sucrose from each one. When the mice broke the photobeam, located halfway between the two sippers (cyan squares), a cue [tone (2 kHz) + laser (20 Hz), 1 s] was randomly delivered. The cue instructed them to return to the previously rewarded port to be rewarded again and avoid punishment. A dry lick is a lick given to the empty sipper. C, Task performance in the initial and last five training sessions. Learning criteria (horizontal dashed line at 50%) were reached when mice avoided punishment in >50% of cue trials in five consecutive sessions. Correct trials separated as Hit and Correct Rejections are shown in Extended Data Figure 2-1, where only Hits increased their proportion when mice learned the task. Note that PFCWT-10kHz mice were trained with a more easily perceived auditory tone 10 kHz, than a 2-kHz tone that was barely perceptible to mice, as shown in Extended Data Figure 2-2. Error bars indicate SEM. D, Sessions to reach the learning criteria. E, Task performance postlearning in mice with PFC optogenetic stimulation (block 1). In block 2, the tone was removed. In block 3, mice were tested with a “fake laser.” After reacquisition (block 4 laser only), block 5 began, where the tone was the cue only. Then in block 6, we re-tested laser only condition. Finally, we repeated the laser+tone condition in block 7. F, Similar to panel E, except that stimulation was delivered in subcortical structures (NAcThy1, TRNVGAT, and VTATH); *p <0.01 ANOVA Dunnett post hoc relative to PFCWT control.
Figure 3.
Figure 3.
Optoception was induced by optogenetic stimulation only. A, The number of sessions needed to reach the learning criteria. Mice were trained in optogenetic-cue sipper alternation tasks, as shown in Figure 1B, but with the laser only as a cue). Each dot represents an individual subject. B, Percent of correct cue trials. Note the drop in task performance during the “fake laser” session, demonstrating that mice used the interoceptive (or any sensory-motor) effects induced by the optogenetic stimulation only as a conditioned cue. Error bars indicate SEM.
Figure 4.
Figure 4.
Mice can use optogenetic stimulation only as a cue and generalize to other laser parameters. A, Upper panel, Schematics of the modified optogenetic-cue alternation task protocol where one out of five frequencies were randomly delivered in 50% of the trials. Bottom panel, Correct cue trials (correct frequency trials/total frequency trials). WT mice were not tested in these task variants because they did not perceive the laser only (Fig. 1E). B, Upper panel, Structure of the modified pulse task variant. In this variant, one out of six laser pulses (from 1 to 20) were randomly delivered in 60% of the trials. Below are the correct cue trials (correct pulse trials/total pulse trials). Note that TRNVGAT mice were more proficient in both task variants.
Figure 5.
Figure 5.
Mice use different laser frequencies to distinguish two actions. A, Scheme of the frequency discrimination task. In this task, on head entry in the central port (red dashed line), the laser was turned “on” 1 s at 10 or 20 Hz, whereupon mice were required to lick in the lateral ports to receive either two drops of sucrose as a reward or two air-puffs as punishment (lateral ports were counterbalanced). B, Correct trials were plotted for the initial five sessions and the last ten sessions after subjects reached the learning criteria (85% correct trials in 3 consecutive sessions). The control PFCWT mice could not learn even after 90 training sessions. Error bars indicate SEM. C, The time needed to reach the learning criteria. D, Task performance in subjects that learned the task before and after testing with a “fake laser” in which mice could see the blue light outside the skull but did not receive any optogenetic stimulation. E, Structure of the generalization task, mice had to categorize 10-, 12-, and 14-Hz frequencies as “low” and 16-, 18-, and 20-Hz frequencies as “high” by licking the lateral ports. F, Psychometric function for choosing the “high” port. As the laser frequency increases, mice prefer the “high” port more, confirming that they categorized the different laser frequencies. This procedure was counterbalanced across mice.
Figure 6.
Figure 6.
Optoception can guide behavior regardless of whether brain perturbations elicited rewarding effects or not. A, Scheme of a lever self-stimulation task. Animals can trigger the delivery of laser stimulation by pressing the active lever (20 Hz, 1 s + 2 s of time out). The inactive lever was recorded but had no programmed consequence. B, The number of lever presses across sessions. This shows that stimulation of PFCThy1 and NAcThy1 was rewarding, as indicated by the number of lever presses. After three sessions, the active lever was switched to inactive and tested for four additional sessions. Levers were counterbalanced across subjects. In the Extinction phase, both levers were Inactive, and thus no laser stimulation was evoked. Error bars indicate SEM. C, Mean lever presses (excluding Extinction sessions). Small white dots indicate the number of mice tested. Overlapped also shows their average performance (right axis) achieved in the optogenetic-cue alternation task see solid red circles. D, Open field center self-stimulation task. In this task, mice had to cross the center zone to receive laser stimulation (20 Hz, 1 s + 2 s of time out). Note that no other reward or stimuli were delivered. E, A representative heat map of a PFCThy1 mouse crosses the center (Active) to self-stimulate. The bottom panel shows an extinction session of the same mouse. F, The time spent in the center zone across sessions for all groups; *p <0.05, two-way ANOVA, Dunnett post hoc, significantly differ from PFCWT during active sessions. Extended Data Figure 6-1 shows that stimulation in PFCVGAT or TRNVGAT mice is not aversive.
Figure 7.
Figure 7.
Mice could use both activation or silencing of a single cell type as a perceptible cue, although they evoked opposing behavioral effects on reward and feeding. A, Histology of mice transfected with ChR2 or ArchT in Vgat-ires-cre mice (GABAergic neurons) of the LH (LHChR2 or LHArchT, respectively). B, Sessions to reach learning criteria. Each dot represents a mouse; *p <0.001 unpaired t tests. C, Correct trials in the presence of tone (2 kHz) and/or laser. Same conventions as in Figure 2E; *p <0.001 two-way ANOVA (transgenic mice × block). D, Real-time Conditioned Place Preference (rtCPP). Left, rtCPP task consisted of three phases: pre-test (Pre, 1 session), acquisition (Acq, 3 sessions), and post-test (Post, 1 session). Right, Representative heat maps on the acquisition phase. Transfected Vgat-ires-cre mice with the enhanced yellow fluorescent protein (LHeYFP) were used as control. E, Fraction of time spent on the paired side. Stimulation in LHChR2 mice was rewarding (value > 0.5) while silencing in LHArchT was aversive (<0.5); #p <0.0001, ANOVA Dunnett post hoc, relative to pre-test. F, Left, Schematic of the closed-loop task. Sated LHChR2 or LHeYFP mice were placed in a behavioral box with a sucrose sipper. Head entry into the port triggered optogenetic stimulation (1 s “on,” 20 Hz + 2 s time out, 473 nm). Right, total licks during the task. G, Left panel, Open-loop task. In water-deprived LHArchT or control LHeYFP mice, a continuous green laser was turned “on” in blocks of 1 min (532 nm) and 1 min with no-laser (“off”). Right, Total licks during the task; *p <0.001 paired t test. Extended Data Figure 7-1 depicts a raster plot of sucrose licking during stimulation of LHChR2, LHArchT, and LHeYFP mice.
Figure 8.
Figure 8.
Optoception is not a generic sensation that can be generalized across regions, instead is a specific experience. A, Left panel, Two optic fibers, one implanted in the NAc and the second in the lateral cerebellum from the same hemisphere. Right panel, Histology of implantation sites in the same two regions but now in the VGAT-ChR2 mice. B, Sessions to reach learning criteria from the optogenetic cue-alternation task. Each dot represents a mouse. C, Percent correct of cue trials; we plotted the first three and the last three sessions, in which mice first used optogenetic perturbations in the NAc to solve the task, and then it was switched to stimulation in the lateral cerebellum. In the first session, task performance dropped to chance with lateral cerebellum perturbation (see red arrow), suggesting that animals did not feel similar sensory qualia. Nevertheless, they can also learn to use lateral cerebellum perturbations to guide behavior after the training. In one session, some mice were tested in a Fake laser condition. Finally, we randomly interleaved stimulations from both brain regions within the same session. Surprisingly, after learning, they can indistinctly use randomly interleaved stimulations from both brain regions to guide behavior. Error bars indicate SEM.

Similar articles

Cited by

References

    1. Arenkiel BR, Peca J, Davison IG, Feliciano C, Deisseroth K, Augustine GJ, Ehlers MD, Feng G (2007) In vivo light-induced activation of neural circuitry in transgenic mice expressing channelrhodopsin-2. Neuron 54:205–218. 10.1016/j.neuron.2007.03.005 - DOI - PMC - PubMed
    1. Babl SS, Rummell BP, Sigurdsson T (2019) The spatial extent of optogenetic silencing in transgenic mice expressing channelrhodopsin in inhibitory interneurons. Cell Rep 29:1381–1395.e4. 10.1016/j.celrep.2019.09.049 - DOI - PubMed
    1. Berntson GG, Khalsa SS (2021) Neural circuits of interoception. Trends Neurosci 44:17–28. 10.1016/j.tins.2020.09.011 - DOI - PMC - PubMed
    1. Bevins RA, Besheer J (2014) Interoception and learning: import to understanding and treating diseases and psychopathologies. ACS Chem Neurosci 5:624–631. 10.1021/cn5001028 - DOI - PMC - PubMed
    1. Campolattaro MM, Halverson HE, Freeman JH (2007) Medial auditory thalamic stimulation as a conditioned stimulus for eyeblink conditioning in rats. Learn Mem 14:152–159. 10.1101/lm.465507 - DOI - PMC - PubMed

LinkOut - more resources