. 2022 Jun 17;13(1):3487.
doi: 10.1038/s41467-022-31097-7.

A global lipid map reveals host dependency factors conserved across SARS-CoV-2 variants

Affiliations

A global lipid map reveals host dependency factors conserved across SARS-CoV-2 variants

Scotland E Farley et al. Nat Commun. .

Abstract

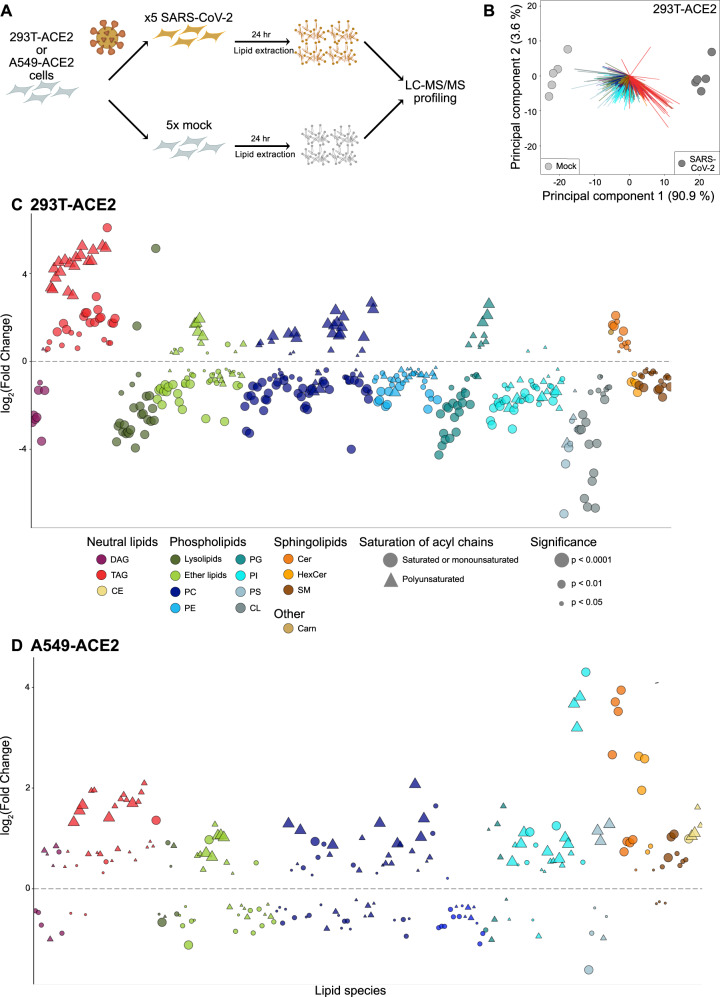
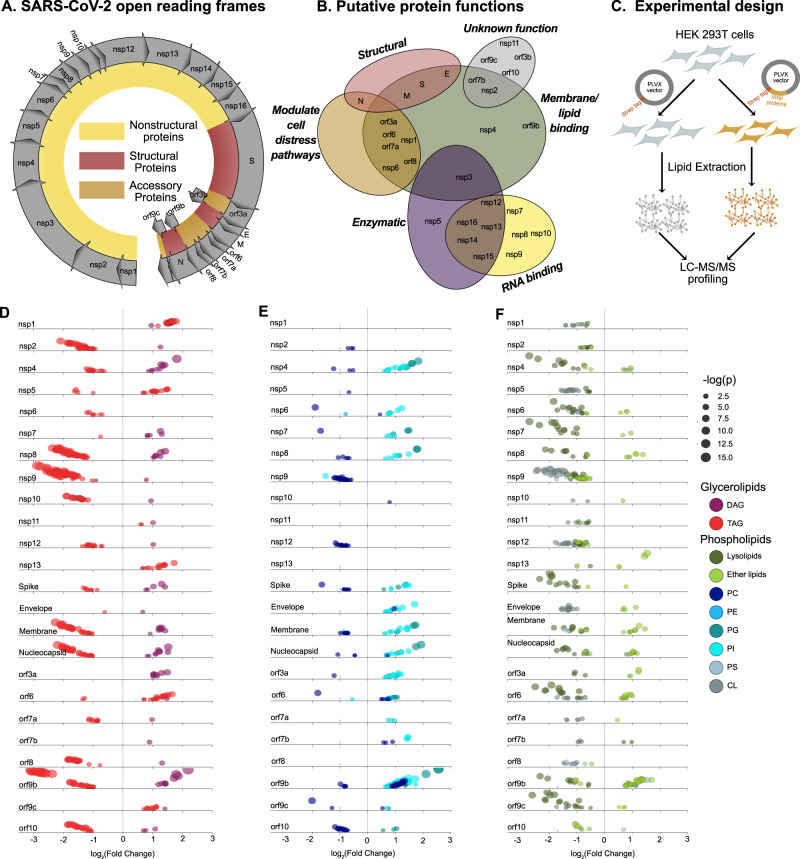
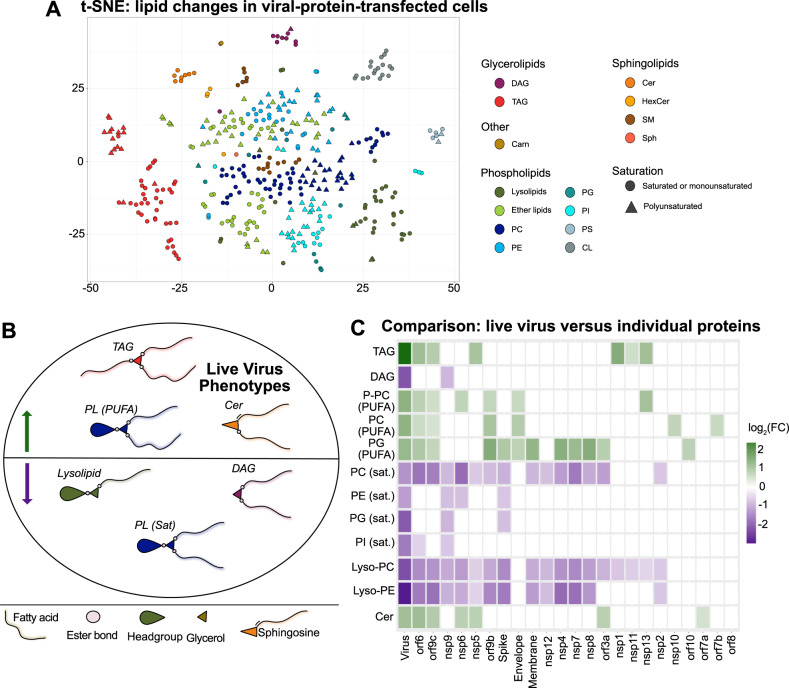
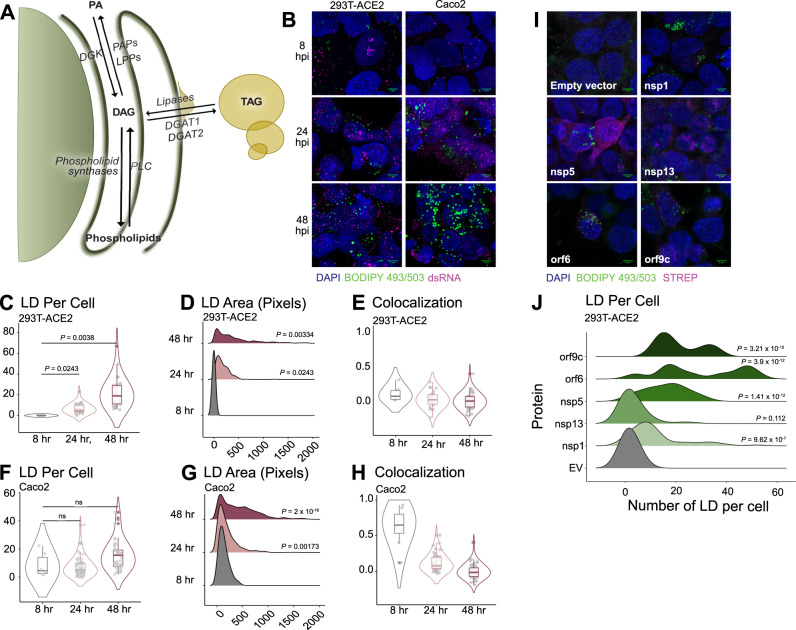
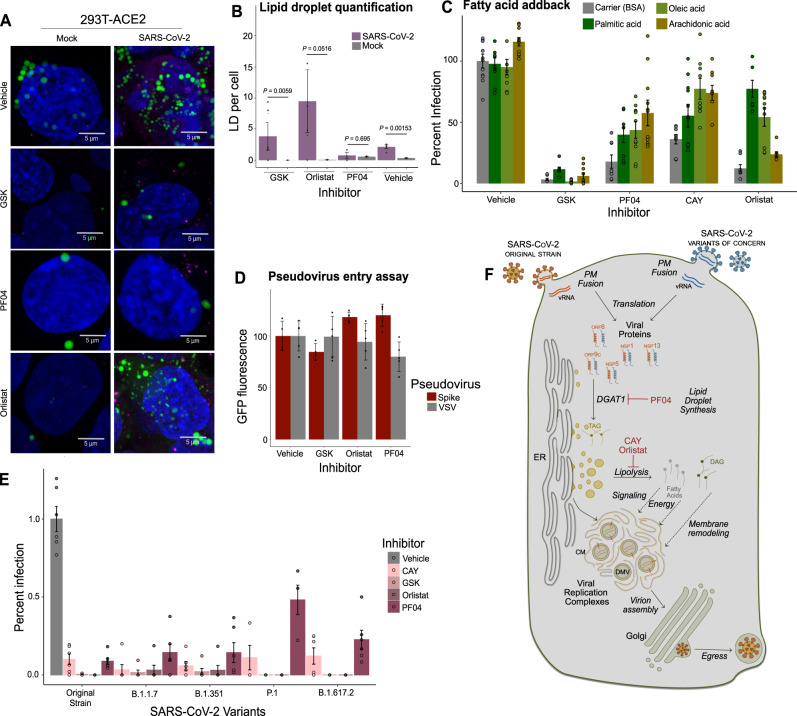
A comprehensive understanding of host dependency factors for SARS-CoV-2 remains elusive. Here, we map alterations in host lipids following SARS-CoV-2 infection using nontargeted lipidomics. We find that SARS-CoV-2 rewires host lipid metabolism, significantly altering hundreds of lipid species to effectively establish infection. We correlate these changes with viral protein activity by transfecting human cells with each viral protein and performing lipidomics. We find that lipid droplet plasticity is a key feature of infection and that viral propagation can be blocked by small-molecule glycerolipid biosynthesis inhibitors. We find that this inhibition was effective against the main variants of concern (alpha, beta, gamma, and delta), indicating that glycerolipid biosynthesis is a conserved host dependency factor that supports this evolving virus.


Conflict of interest statement

The authors declare no competing interests.

Figures

Fig. 1
Fig. 1. SARS-CoV-2 alters the lipid composition of its host cells.
A Lipidomics study design. B Principal component analysis of 293T-ACE2 cells infected with SARS-CoV-2 or mock-infected (n = 5 biological replicates; each point represents one biological replicate). C Individual lipid species characterized by abundance in SARS-CoV-2 infection relative to mock in HEK293T-ACE2 cells (data points are means from five biological replicates; each data point represents a lipid species). Only significantly changed (P < 0.05, one-way ANOVA, with Benjamini–Hochmini adjustment for multiple comparisons) lipids are shown. Log2(Fold Change) relative to mock infection is shown on the x-axis. Individual lipid species are colored by the class of lipid that they belong to. DAG diacylglycerol; TAG triacylglycerol; PC phosphatidylcholine; PE phosphatidylethanolamine; PG phosphatidylglycerol; PI phosphatidylinositol; PS phosphatidylserine; CL cardiolipin; Cer ceramide; HexCer hexosylceramide; SM sphingomyelin; Carn acylcarnitine; CE cholesterol ester. D Individual lipid species characterized by abundance in SARS-CoV-2 infection relative to mock in A549-ACE2 cells (data points are means from 5 biological replicates; each data point represents a lipid species). Only significantly changed (P < 0.05, one-way ANOVA, with Benjamini–Hochmini adjustment for multiple comparisons). Same colors and abbreviations as in (C) apply. Source data are provided in Supplementary Data 1 (HEK293T-ACE2 cells) and Supplementary Data 2 (A549-ACE2 cells).
Fig. 2
Fig. 2. Ectopic expression of SARS-CoV-2 proteins modulates host lipid metabolism.
A Open reading frames of the SARS-CoV-2 genome. B Putative functions of SARS-CoV-2 proteins, based on early studies and sequence similarity to proteins from SARS-CoV. C Lipidomics study design. DF Individual lipid species characterized by class and family (data points are means from five biological replicates; each data point represents a lipid species). Only significantly changed (P < 0.05, one-way ANOVA, Benjamini–Hochmini adjusted for multiple comparison) lipids are shown. Log2(Fold Change) relative to empty vector is shown on the x-axis. Individual lipid species are colored by the class of lipid that they belong to. Abbreviations same as Fig. 1. Source data are provided in Supplementary Data 3.
Fig. 3
Fig. 3. Individual SARS-CoV-2 proteins recapitulate overlapping lipid features of live infection.
A Unsupervised clustering of the normalized lipid species observed in the protein-transfected dataset by t-SNE. Abbreviations same as Fig. 1. B Summary of lipids altered upon infection with SARS-CoV-2 in both HEK293T-ACE2 cells and A549-ACE2 cells. Cer = ceramide; PL (PUFA) = phospholipids bearing polyunsaturated acyl chains; TAG = triacylglycerol; PL (Sat) = phospholipids bearing saturated or monounsaturated acyl chains. C Average fold change within each class described above in each condition, both live virus infection (HEK293T-ACE2 cells) and ectopic protein expression. Only significantly changed (P < 0.05, see Figs. 1 and 2 for descriptions of statistical tests in the live virus and transfection conditions, respectively) lipid species were used in this calculation. Source data are provided as a Source Data file.
Fig. 4
Fig. 4. Lipid droplets are induced following SARS-CoV-2 infection and after the transfection of key viral proteins.
A Overview of central glycerolipid metabolism. PA = phosphatidic acid; PAP = phosphatidic acid phosphatase; LPP = lysophosphatidic acid phosphatase; DGK: diacylglycerol kinase; DAG = diacylglycerol; TAG = triacylglycerol; DGAT 1/2 = diacylglycerolacetyltransferase 1/2; PLC = phospholipase C. B 293T-ACE2 and Caco-2 cells infected with SARS-CoV-2 strain USA-WA1/2020 (MOI = 1) and fixed at the indicated timepoints. LDs and infected cells were visualized with BODIPY 493/503 and anti-dsRNA immunofluorescence, respectively. Images are representative of three independent experiments. C, F Number of lipid droplets per cell; each data point is a cell. P-values are derived from one-way ANOVA relative to the 8hpi condition. D, G Distribution plot of the area of each individual lipid droplet from (C, F), in pixels. P-values are derived from one-way ANOVA relative to the 8hpi condition. E, H Colocalization of dsRNA and BODIPY by Pearson’s coefficient. Each data point is a cell. P-values are derived from one-way ANOVA relative to the 8hpi condition. I 293T cells transfected with the indicated viral proteins, 48 h after transfection. Images are representative of two independent experiments. J Distribution plot of the number of lipid droplets per cell in each transfection. P-values are derived from one-way ANOVA relative to the Empty Vector condition. The box plots are presented with the elements: center line, median; box limits, Q1 and Q3; whiskers, 1.5 x interquartile range. Outliers are also shown. Source data for all panels are provided as a Source Data file; n numbers (representing cells) for each condition can be found in the Source Data file.
Fig. 5
Fig. 5. Central glycerolipid metabolism is essential for SARS-CoV-2 infection.
AF Screen of neutral lipid biosynthesis inhibitors. HEK-293T-ACE2 cells were treated with 10 µM of each compound overnight prior to infection. Cells were infected for 48 h prior to supernatant collection. Bars represent viral titers from cells treated with the indicated inhibitors, measured by focus-forming assay. The box plots are presented with the elements: center line, median; box limits, Q1 and Q3; whiskers, 1.5 x interquartile range, from three independent experiments; individual data points are also shown, representing biological replicates (n = 9). P-values are derived one-way ANOVA. FASN = fatty acid synthase; PAP = phosphatidic acid phosphatase; LPP = lipid phosphate phosphatase; DGK = diacylglycerol kinase; ATGL = adipose triacylglycerol lipase; DGAT = diacylglycerolacetyltransferase; PLC = phospholipase C G EC50 curves for selected inhibitors in 293T-ACE2 cells. HEK-293T-ACE2 cells were treated with 2-fold dilutions of each compound overnight prior to infection. Cells were infected for 48 h prior to supernatant collection and focus-forming assay. Percent infection is calculated as [Titer(inhibitor) /Titer(vehicle)]*100. Data are from three independent experiments. Error band is SE; the measure of center for the error band is the mean. Curve fits are calculated using a nonlinear curve fit to the Hill equation: Response = (Max Response)/(1 + [EC50/Concentration]^n), where the max response is defined as 100% inhibition. H EC50 curves for selected inhibitors in Caco2 cells. Experiment and analysis same as described in (G). I EC50 values from the curves in G and H. EC50 values are calculated from the curve fit described above. Source data are provided as a Source Data file.
Fig. 6
Fig. 6. Mechanisms and breadth of glycerolipid inhibition against SARS-CoV-2.
A Representative images of HEK293T-ACE2 cells treated with each indicated inhibitor (10 µM) or vehicle (DMSO), infected with SARS-CoV-2 for 48 h (MOI = 1), and stained to visualize lipid droplets (BODIPY 493/503), and dsRNA. Images are representative of three independent experiments. B Quantification of lipid droplet numbers in (A). Data are mean ± SE for n = 6 biological replicates; P-values are derived from one-way ANOVA. C Partial rescue of inhibition of viral replication by supplementation with exogenous fatty acids. Inhibitors and fatty acids are both used at 10 µM, administered simultaneously overnight before a 48 h infection (MOI = 0.1). Data are mean ± SE for n = 10 biological replicates, from three independent experiments. D GFP fluorescence resulting from an infection with lentivirus pseudotyped with either SARS-CoV-2 Spike protein or VSV G protein. Data are mean ± SD for n = 5 biological replicates. E Inhibition of the original strain and four variants of concern of SARS-CoV-2 in 293T-ACE2 cells by four inhibitors of glycerolipid biosynthesis, each at 10 µM overnight prior to an 48-h infection (MOI = 0.1). Data are from three independent experiments; data are mean ± SE for n = 6 biological replicates. F A model for neutral lipid flux during SARS-CoV-2 infection. vRNA viral RNA; PM plasma membrane; DGAT1 diacylglycerolacetyltransferase 1; TAG triacylglycerol; DAG diacylglycerol; ER endoplasmic reticulum; CM convoluted membrane; DMV double-membraned vesicle Source data are provided as a Source Data file.

Update of

References

    1. Wolff G, et al. A molecular pore spans the double membrane of the coronavirus replication organelle. Science. 2020;369:1395–1398. doi: 10.1126/science.abd3629. - DOI - PMC - PubMed
    1. Klein S, et al. SARS-CoV-2 structure and replication characterized by in situ cryo-electron tomography. Nat. Commun. 2020;11:5885. doi: 10.1038/s41467-020-19619-7. - DOI - PMC - PubMed
    1. Welsch S, et al. Composition and three-dimensional architecture of the dengue virus replication and assembly sites. Cell Host Microbe. 2009;5:365–375. doi: 10.1016/j.chom.2009.03.007. - DOI - PMC - PubMed
    1. Shulla A, Randall G. (+) RNA virus replication compartments: a safe home for (most) viral replication. Curr. Opin. Microbiol. 2016;32:82–88. doi: 10.1016/j.mib.2016.05.003. - DOI - PMC - PubMed
    1. Cortese M, et al. Ultrastructural characterization of Zika virus replication factories. Cell Rep. 2017;18:2113–2123. doi: 10.1016/j.celrep.2017.02.014. - DOI - PMC - PubMed

Publication types

Supplementary concepts