. 2022 Jun 17;13(1):3475.
doi: 10.1038/s41467-022-31131-8.

Comparative parallel multi-omics analysis during the induction of pluripotent and trophectoderm states

Affiliations

Comparative parallel multi-omics analysis during the induction of pluripotent and trophectoderm states

Mohammad Jaber et al. Nat Commun. .

Abstract

Following fertilization, it is only at the 32-64-cell stage when a clear segregation between cells of the inner cell mass and trophectoderm is observed, suggesting a 'T'-shaped model of specification. Here, we examine whether the acquisition of these two states in vitro, by nuclear reprogramming, share similar dynamics/trajectories. Using a comparative parallel multi-omics analysis (i.e., bulk RNA-seq, scRNA-seq, ATAC-seq, ChIP-seq, RRBS and CNVs) on cells undergoing reprogramming to pluripotency and TSC state we show that each reprogramming system exhibits specific trajectories from the onset of the process, suggesting 'V'-shaped model. We describe in detail the various trajectories toward the two states and illuminate reprogramming stage-specific markers, blockers, facilitators and TSC subpopulations. Finally, we show that while the acquisition of the TSC state involves the silencing of embryonic programs by DNA methylation, during the acquisition of pluripotency these regions are initially defined but retain inactive by the elimination of H3K27ac.


Conflict of interest statement

The author declares no competing interests.

Figures
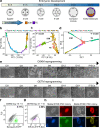
Fig. 1
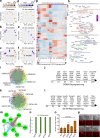
Fig. 1. Establishment of the pluripotent and trophectoderm states in the embryo and during somatic nuclear reprogramming.
a An illustration of early embryogenesis. Inner cell mass (ICM, orange) and trophectoderm (TE, purple) are the first compartments to show a clear transcriptional specification. b, c Single-cell RNA sequencing data obtained from different stages of developing embryo demonstrating the trajectory from zygote to blastocyst. PCA graphs showing gene expression profiles among 252 single cells. b The exclusion of totipotent cells (zygote and 2-cell stage (2 C)) allows the visualization of a T-like shape progression segregating the TE from the ICM. BE indicates blastocyst-early, BM indicates blastocyst-middle, and BL indicates blastocyst-late. d Single-cell Fluidigm BioMark analysis data obtained from different stages of developing embryo demonstrating the trajectory from the zygote to the blastocyst stage. Diffusion map was constructed by MERLoT package using 48 genes in 433 individual cells obtained from 2 C through blastocyst. e Representative bright field images showing cell morphology and cell density during OSKM reprogramming toward iPSCs (top) and during GETM reprogramming toward iTSCs (bottom). Eleven repetitions of independent reprogramming experiments were performed to collect the various samples for the multi-omics analysis (n = 11). f, g Representative flow cytometry analysis for Nanog-2A-EGFP (f) or Elf5-2A-EYFP (g) reporter on BYKE MEFs undergoing reprogramming for 15 days followed by 5 days of dox removal with OSKM factors (f) or for 21 days followed by 10 days of dox removal with GETM factors. Five independent reprogramming experiments were analyzed, all showing a comparable level of reporter activation (n = 5). For gating strategy, see Supplementary Fig. 9. h Representative bright field and fluorescence images of a stable BYKE iPSC colony demonstrating the activation of the three pluripotent reporters (Utf1-2A-tdTomato/Esrrb-2A-TagBFP/Nanog-2A-EGFP). Five colonies from five independent repetitions were analyzed, all showing the same signals (n = 5). i Representative bright field and fluorescence images of a stable BYKE iTSC colony demonstrating the activation of the three TSC reporters (Utf1-2A-tdTomato/Esrrb-2A-TagBFP/Elf5-2A-EYFP-NLS). Five colonies from five independent repetitions were analyzed, all showing the same signals (n = 5).
Fig. 2
Fig. 2. Bulk RNA-seq analysis on cells undergoing reprogramming to iPSCs and iTSCs.
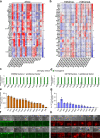
ac PCA plots describing the trajectory during the reprogramming to either iPSCs (a), iTSCs (b) or both (c) as assessed by gene expression profiles (two biological replicates for each time point/sample, n = 2). df same as in (ac) but here only induced cells (cells on dox) are plotted. g Heatmap of the most variable 10,000 genes among ESCs, bdTSCs, MEFs and cells during reprogramming. Unsupervised hierarchical clustering was performed and adaptive branch pruning was used to identify 27 prominent clusters. h Gene-concept network of GO terms associated with placenta development induced by OSKM (upper panel) or by GETM (lower panel) reprogramming. Key regulators of the TSC state are marked by green. i, k Venn diagrams plots for transcription factor dynamics during reprogramming with OSKM or with GETM, respectively (lfc > 1, p.adj ≤ 0.01). j, l Schematic illustrations showing representative transcription factors that are activated during the reprogramming to pluripotency or to TSC state, respectively. m A network generated with iRegulon Cytoscape plugin showing key transcription factors (green nodes) predicted to regulate 1288 genes (magenta nodes) that are completely silent or only mildly expressed in GETM day 21 but strongly expressed in iTSCs. np Oct4-GFP MEFs were transduced with GETM together with the indicated factor and reprogrammed for 20 days followed by 10 days of dox removal. n qPCR analysis of the indicated transgenes. The highest sample for each transgene was set to 1. Results were normalized to the Gapdh gene and are shown as fold change of two replicate runs in a typical experiment (n = 3). o Quantification of the number of stable iTSC colonies in the various reprogramming combinations. Numbers inside bars indicate the average number of CDX2-positive iTSC colonies of two independent biological replicate runs (n = 2). Asterisk indicates p value of 0.02 using two-tailed unpaired t-test calculated by GraphPad Prism (8.3.0). p Representative images for CDX2–positive (red) iTSC colonies in the indicated reprogramming combinations and bdTSCs from two independent experiments (n = 2). See also Supplementary Data file 1. Source data are provided as a Source Data file.
Fig. 3
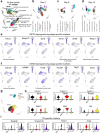
Fig. 3. Single-cell RNA-seq analysis separates OSKM from GETM reprogramming.
a Uniform Manifold Approximation and Projection (UMAP) visualization analysis of 23,446 cells at days 3, 6, and 12 during OSKM and GETM reprogramming. Each point represents a single cell and each color represents a unique community among the population. The most significant cell type was assigned to each cluster of cells using EnrichR- PanglaoDB Augmented 2021. bd UMAP visualization of 9708 single cells profiled at day 3 (b), 7806 single cells at day 6 (c), or 5932 single cells at day 12 (d) of both OSKM and GETM reprogramming. Each point represents a single cell and each color represents a unique community among the population. The most significant cell type was assigned to each cluster of cells using EnrichR- PanglaoDB Augmented 2021. e, f Expression level of selected cluster-specific markers for GETM (e) and OSKM (f) reprogramming, respectively. The expression level of the specified markers is visualized in cells within the UMAP by a range of intensities of a purple color. g UMAP visualization of 3393 single iTSCs and parental MEFs. Three clusters were identified showing a significant heterogeneity within the iTSCs cells. h Violin plots summarizing single-cell expression level of specific marker genes for each cluster of iTSCs (p.adj ≤ 0.05). i Violin plots showing prevalent expression-specific markers at the single-cell level for genes shared between cells within cluster 2 and the TE compartment of the embryo. See also Supplementary Data file 2.
Fig. 4
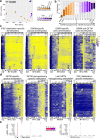
Fig. 4. RRBS analysis demonstrates methylation specific dynamics between OSKM and GETM reprogramming.
a Average bulk DNA methylation data of cells undergoing reprogramming toward pluripotency and TSC state projected onto the first two principal components. A clear V-like shape progression is observed separating GETM from OSKM reprogramming. b Boxplot of overall DNA methylation level across the indicated bulk samples (for each ample and time point two biologically independent replicates were analyzed, n = 130,142) during reprogramming toward both pluripotent and TSC states. Boxes indicate 50% (25–75%) and whiskers (5–95%) of all measurements, with black lines depicting the medians. cd Heatmaps demonstrating the dynamics of DNA methylation alterations and patterns across bulk samples during reprogramming toward both pluripotent and TSC states, respectively. Each row represents one differentially methylated block for which there are at least one CpG with ≥10× coverage. Boxplots at the top of each heatmap depict the DNA methylation level across the indicated bulk samples (for each sample and time point two biologically independent replicates were analyzed, (c) n = from left to right: 15,246, 8293, 5054, 2796; (d) n = from left to right: 5793, 1089, 904, 14,113) during reprogramming toward both pluripotent and TSC states. Boxes indicate 50% (25–75%) and whiskers (5–95%) of all measurements, with black lines depicting the medians. e Genome browser snapshot showing RRBS-captured CpG sites (short blue, purple or red lines) of the indicated samples in TSC-ESC-shared loci (i.e., Sall4 and Stmn2). Scale bar indicates methylation levels ranging from no methylation (blue), intermediate methylation (purple) to maximum methylation (red). See also Supplementary Data file 3.
Fig. 5
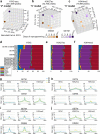
Fig. 5. Chromatic accessibility and activity during GETM and OSKM reprogramming demonstrating a ‘V’-shaped behavior.
ac Top 3 PCA components of the Z-scores of ATAC-seq (a), H3K27ac (b) and H3K4me2 peaks (c). Peaks were clipped to range [0, 500] and filtered by length (≥500 bp). Replicates were merged by taking the mean peak height. df Genomic annotations of ATAC-seq peaks (d), H3K27ac peaks (e) and H3K4me2 peaks (f). Shown are the fraction of various genomic annotations (Promoter, Exons, Introns, etc) among peaks. Genomic regions accessible in both GETM and OSKM conditions (d, top three rows) are enriched for promoter regions, compared to GETM or OSKM regions (below). GETM and OSKM mark regions accessible in those conditions, excluding MEF peaks. Below are cell-type specific accessible regions such as “GETM\OSKM D3”, which includes GETM Day 3 peaks not accessible in OSKM Day 3. In addition to Promoter regions (blue), most accessible regions fall within Intronic regions (purple) and Intergenic regions (red). gj Mean ATAC-seq, H3K27ac and H3K4me2 at ±5Kb surrounding OSKM or GETM H3K27ac peak locations, for Day 3 (blue), Day 6 (green), and Day 9 (yellow). g OSKM-specific H3K27ac signal is strongest at Day 6, and is accompanied by matching H3K4me2 signal, but with no dynamic change in DNA accessibility. h Same for GETM ATAC-seq peaks. These regions are already marked by H3K4me2 in Day 3, and gain accessibility over time. These genome regions also show H3K27ac and H3K4me2 enrichments for later OSKM stages. i Same for OSKM ATAC-seq peaks. j Same of GETM H3K27ac peaks. These peaks show gradual increase in ChIP-seq signal even following OSKM induction (below).
Fig. 6
Fig. 6. Motif enrichment and the effect of their corresponding transcription factor on OSKM and GETM reprogramming.
a Heatmap showing motif enrichment among ATAC-seq peaks. For each row (motif) and each column (condition-specific ATAC-seq peaks) we calculated the percent of peaks containing it (shown numbers). Subsets of peaks include GETM-only peaks (GETM\OSKM), joined peaks (GETM&OSKM), and OSKM-only peaks (OSKM\GETM) for each time point (Days 3, 6, 9). Also shown are joined sets of GETM and OSKM peaks for each day, as well as MEF, ESC and TSC peaks. Each motif/condition is color-coded based on relative motif enrichment (Z-scores) compared to all conditions. Only motifs with enrichment greater than 2.5 standard deviations (Z > 2.5) are shown. b Heatmap showing motif enrichment among H3K27ac and H3K4me2 peaks. For each row and each column, we calculated the percent of peaks containing it (shown numbers). Subsets of peaks include GETM-only peaks (GETM\OSKM), joined peaks (GETM&OSKM), and OSKM-only peaks (OSKM\GETM) for each time point (Days 3, 6, 9). c, d BYKE MEFs were infected with dox-inducible OKSM STEMCCA cassette (c) or GETM factors (d) plus additional factor as depicted. qPCR analysis for the indicated transgenes is shown. The highest sample for each transgene was set to 1. Results were normalized to the Gapdh gene and are shown as fold change of two replicate runs in a typical experiment (n = 3). e, f BYKE MEFs were reprogrammed with OSKM together with the indicated factor for 8 days and then weaned of dox for additional 5 days. Nanog-2A-EGFP-positive colonies were counted (e) and imaged (f) in four independent reprogramming experiments (n = 4). EV refers to empty vector control. Error bars presented as a mean ± standard deviation of four replicates. g, h BYKE MEFs were reprogrammed with GETM together with the indicated factor for 21 days and then weaned of dox for additional 10 days. Utf1-2A-tdTomato-positive colonies were counted (g) and imaged (h) in four independent reprogramming experiments. Error bars presented as a mean ± standard deviation of 2–4 replicates. EV refers to empty vector control. Source data are provided as a Source Data file.
Fig. 7
Fig. 7. Data integration of DNA methylation, gene expression and chromatin accessibility and activity during reprogramming toward pluripotent and TSC states.
ab Clustering of 18,420 GETM and OSKM ATAC-seq peaks from days 3, 6, 9 into 14 clusters is shown as a heatmap (a) or barplot of mean ATAC-seq signal per cluster (b). c Cluster #1 is mostly composed of distal (Intergenic and Intronic) GETM-specific peaks, enriched for AP1, Tfap2c, GATA and Eomes motifs, and near GETM-expressed genes. Shown are mean ATAC-seq signals (top left), analysis of their genomic annotations (pie chart, center), enriched transcription factor motifs (right panel), average ChIP-seq signals of H3K27ac and H3K4me2 following GETM and OSKM induction (middle panel), and a pie chart for RNA expression levels and GO term for genes that are associated with each cluster ATAC-seq peaks and exhibit the highest expression levels in MEFs (blue), or GETM (green) or OSKM (yellow, Bottom panel). d Same for cluster 10, enriched for highly accessible promoter peaks. e Same for cluster 14, with regions that are highly accessible following OSKM, enriched for distal regions with KLF, SOX and OCT4 motifs, and are associated with OSKM expressed genes. f A heatmap of differentially methylated blocks with DNA demethylation during the final states of reprogramming to both pluripotent and TSC states. Each row represents one block of DMBs. Boxplots at the top of the heatmap depict the DNA methylation level across bulk samples (two biologically independent replicates per time point/samples, n = 3992) during reprogramming toward both pluripotent and TSC states. Boxes indicate 50% (25–75%) and whiskers (5–95%) of all measurements, with black lines depicting the medians. g Boxplots (two biologically independent replicates per sample, n = 524 (left, top), 770 (left, middle), 300 (left, bottom), 453 (right, top), 772 (right, middle), 317 (right, bottom) of relative expression of differentially expressed genes that are associated with each individual block of DNA methylation. Boxes indicate 50% (25–75%) and whiskers (5–95%) of all measurements, with middle lines depicting the medians. hi EnrichR Mouse gene atlas and KEGG pathways analysis of significantly over-represented genes that are either upregulated (h) or downregulated (i) for each depicted group in (g).

References

    1. Messerschmidt DM, Knowles BB, Solter D. DNA methylation dynamics during epigenetic reprogramming in the germline and preimplantation embryos. Genes Dev. 2014;28:812–828. doi: 10.1101/gad.234294.113. - DOI - PMC - PubMed
    1. Chen L, Wang D, Wu Z, Ma L, Daley GQ. Molecular basis of the first cell fate determination in mouse embryogenesis. Cell Res. 2010;20:982–993. doi: 10.1038/cr.2010.106. - DOI - PubMed
    1. Jaber M, Sebban S, Buganim Y. Acquisition of the pluripotent and trophectoderm states in the embryo and during somatic nuclear reprogramming. Curr. Opin. Genet. Dev. 2017;46:37–43. doi: 10.1016/j.gde.2017.06.012. - DOI - PubMed
    1. Wu G, Scholer HR. Lineage Segregation in the Totipotent Embryo. Curr. Top. Dev. Biol. 2016;117:301–317. doi: 10.1016/bs.ctdb.2015.10.014. - DOI - PubMed
    1. Deng Q, Ramskold D, Reinius B, Sandberg R. Single-cell RNA-seq reveals dynamic, random monoallelic gene expression in mammalian cells. Science. 2014;343:193–196. doi: 10.1126/science.1245316. - DOI - PubMed

Publication types