. 2022 Jun 17;13(1):3489.
doi: 10.1038/s41467-022-31126-5.

Adipocyte-derived kynurenine promotes obesity and insulin resistance by activating the AhR/STAT3/IL-6 signaling

Affiliations

Adipocyte-derived kynurenine promotes obesity and insulin resistance by activating the AhR/STAT3/IL-6 signaling

Teng Huang et al. Nat Commun. .

Abstract

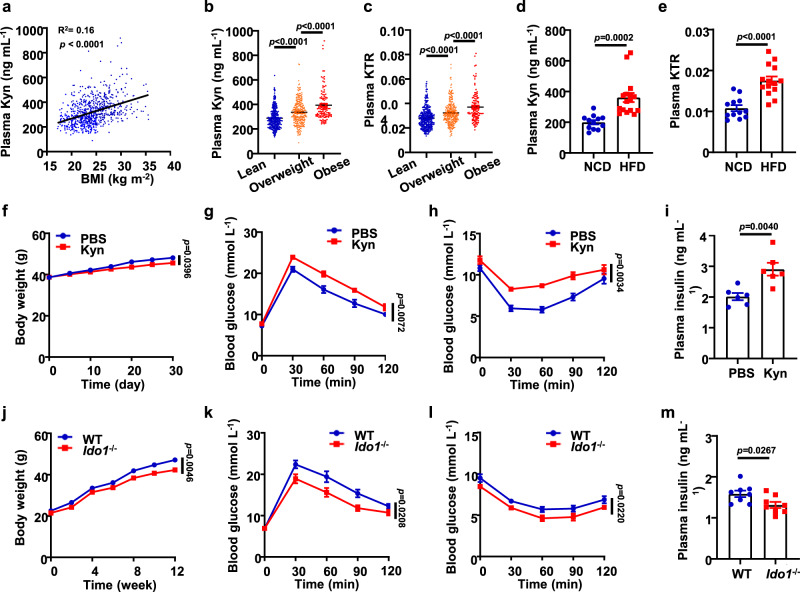
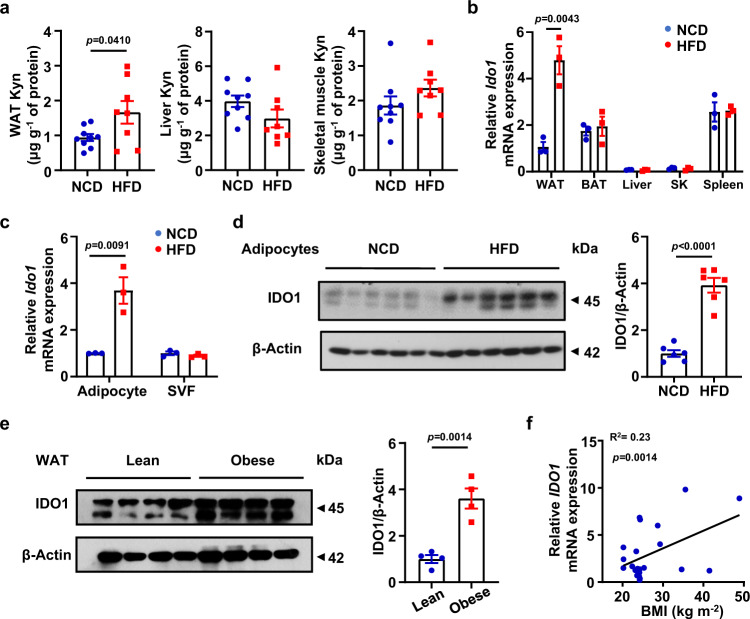
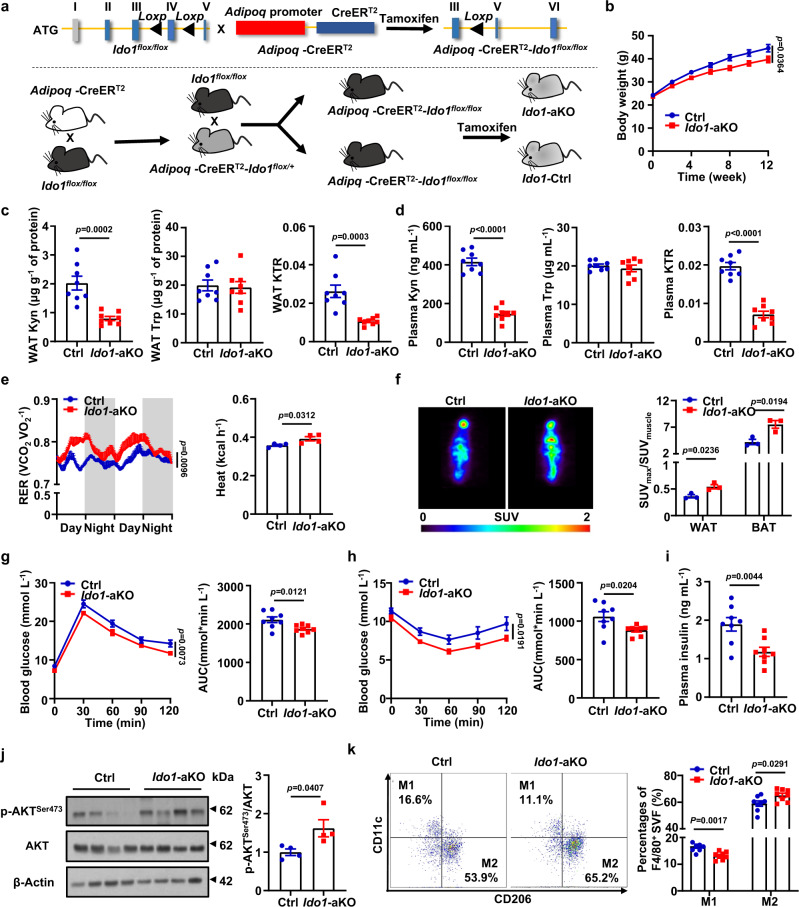
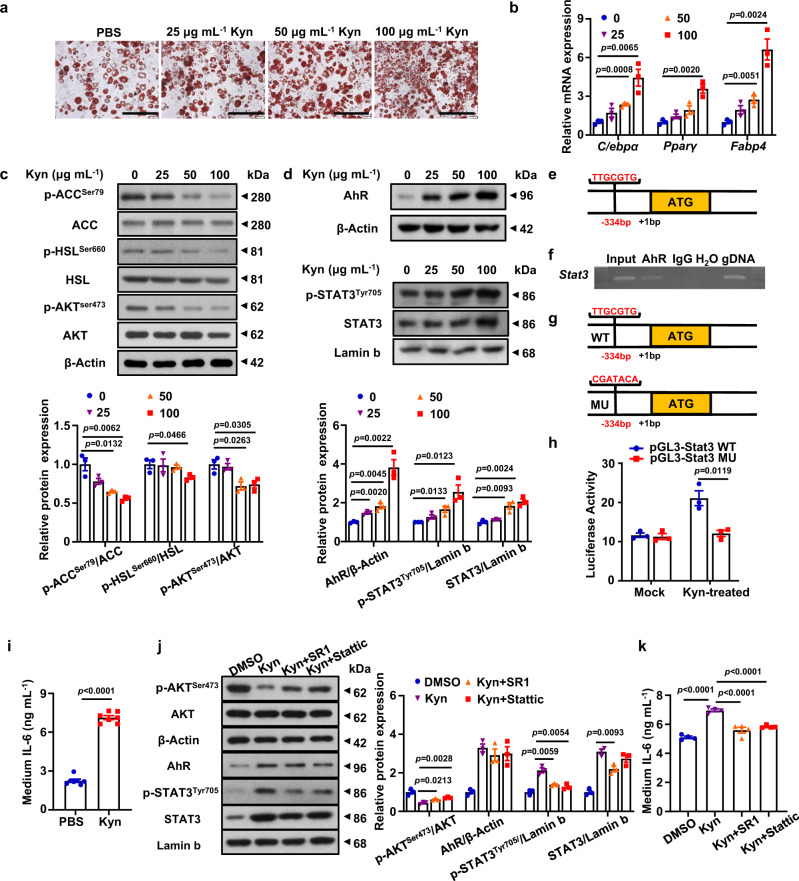
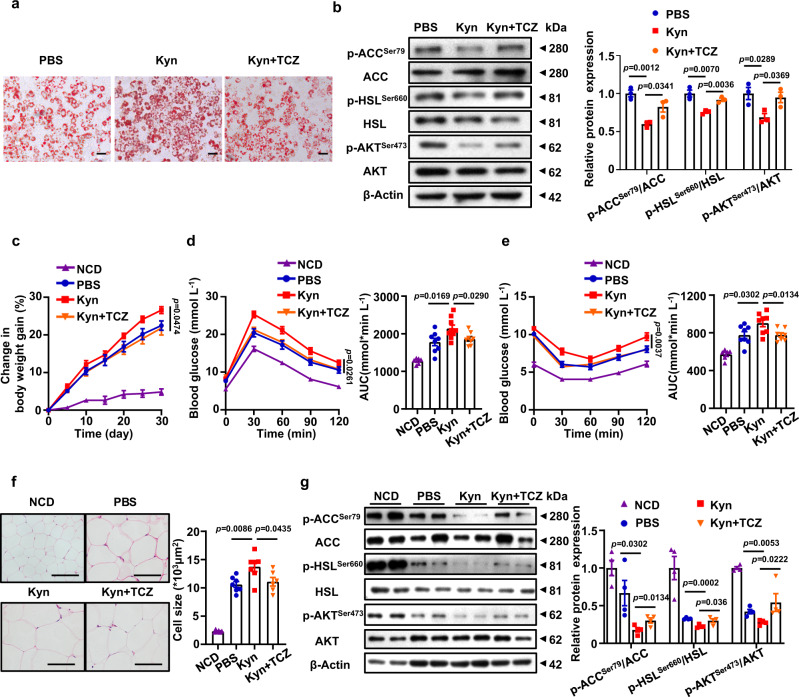
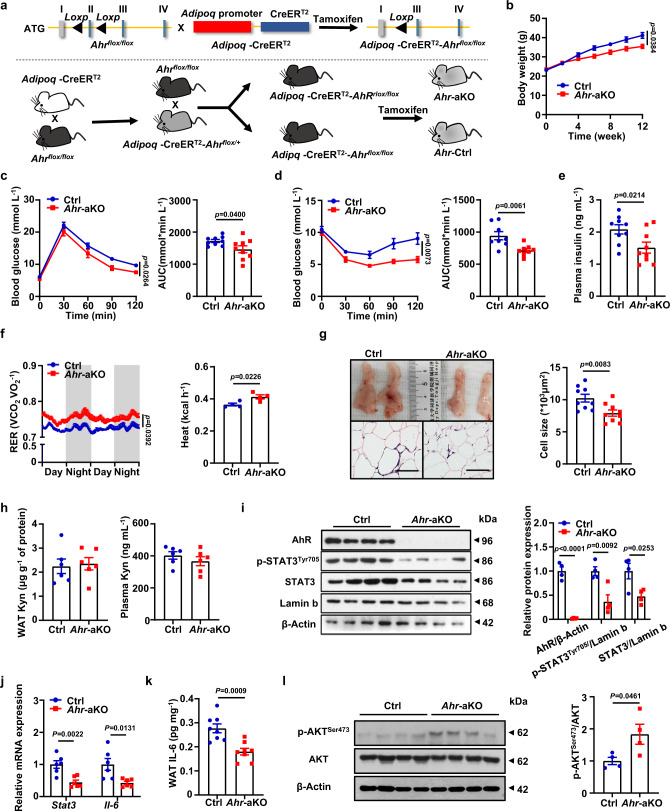
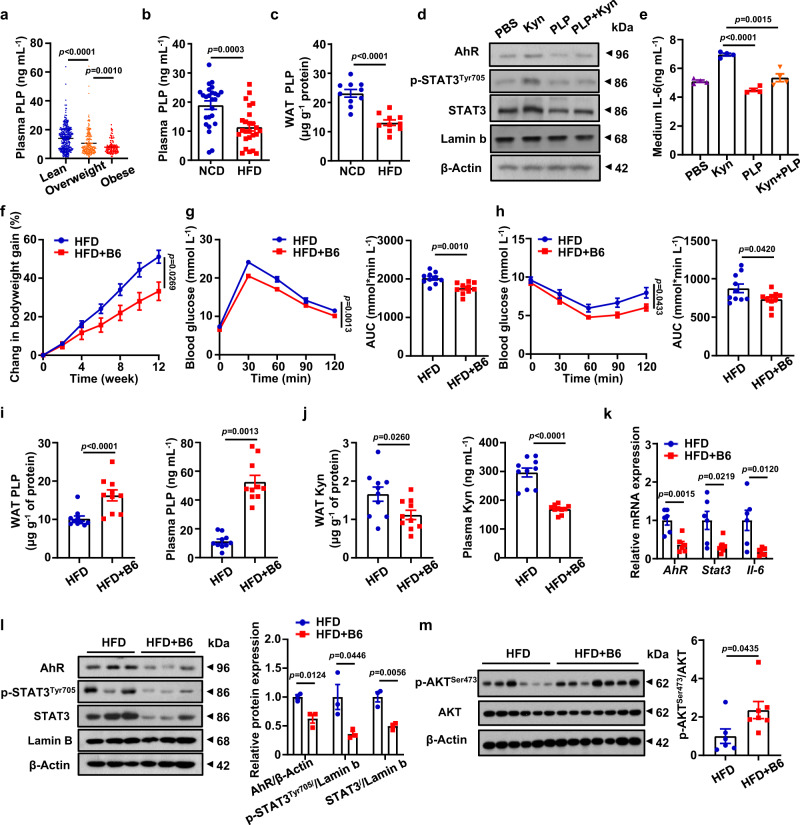
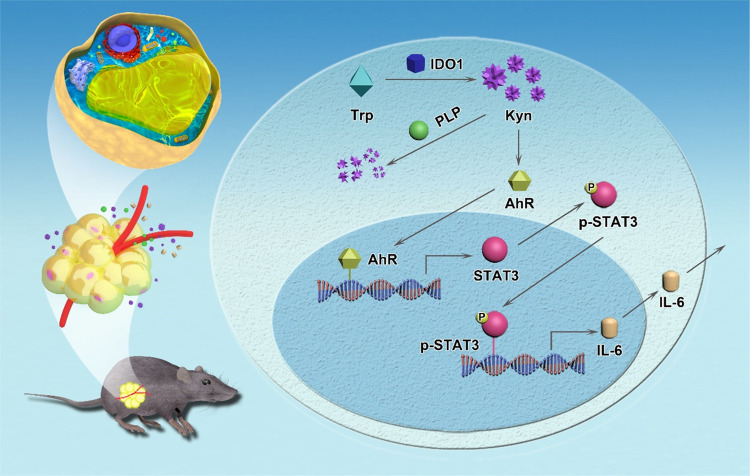
Aberrant amino acid metabolism is a common event in obesity. Particularly, subjects with obesity are characterized by the excessive plasma kynurenine (Kyn). However, the primary source of Kyn and its impact on metabolic syndrome are yet to be fully addressed. Herein, we show that the overexpressed indoleamine 2,3-dioxygenase 1 (IDO1) in adipocytes predominantly contributes to the excessive Kyn, indicating a central role of adipocytes in Kyn metabolism. Depletion of Ido1 in adipocytes abrogates Kyn accumulation, protecting mice against obesity. Mechanistically, Kyn impairs lipid homeostasis in adipocytes via activating the aryl hydrocarbon receptor (AhR)/Signal transducer and activator of transcription 3 /interleukin-6 signaling. Genetic ablation of AhR in adipocytes abolishes the effect of Kyn. Moreover, supplementation of vitamin B6 ameliorated Kyn accumulation, protecting mice from obesity. Collectively, our data support that adipocytes are the primary source of increased circulating Kyn, while elimination of accumulated Kyn could be a viable strategy against obesity.


Conflict of interest statement

The authors declare no competing interests.

Figures

Fig. 1
Fig. 1. IDO1-catalyzed Kyn exacerbates insulin resistance in subjects with obesity.
a Correlation analysis between body mass index (BMI) and plasma Kyn levels in human samples (n = 735). Plasma Kyn levels (b) and KTR (c) in lean subjects (18 ≤ BMI < 24, n = 354), subjects with overweight (24 ≤ BMI < 28, n = 268) and subjects with obesity (BMI ≥ 28, n = 113). d Plasma Kyn levels and e KTR in WT mice fed with NCD (n = 12) or HFD (n = 16). f Body weights of Kyn-treated and PBS-treated WT mice. Glucose tolerance test (GTT) (g) and insulin tolerance test (ITT) (h) in Kyn-treated and PBS-treated WT mice (n = 6). i Plasma insulin levels of Kyn-treated and PBS-treated WT mice (n = 6). j Body weights of WT and Ido−/− mice fed with HFD for 12 weeks (n = 8). GTT (k) and ITT (l) in WT and Ido−/− mice fed with HFD for 12 weeks (n = 8). m Plasma insulin levels of WT and Ido−/− mice fed with HFD for 12 weeks (n = 8). Data were represented as mean ± SEM. Statistical significance was assessed by two-sided Spearman’s correlation (a), One-way ANOVA (b, c), two-sided Student’s t test (d, e, i and m) or two-way ANOVA followed with Bonferroni’s multiple comparisons test (fh, jl) and significant differences were indicated with p values. Source data are provided in the Source Data file.
Fig. 2
Fig. 2. Mature adipocytes from WAT serve as the major source of plasma Kyn.
a Concentration of Kyn in the WAT, liver and skeletal muscle from NCD and HFD mice (n = 8–9). b The transcriptional level of Ido1 in various tissues of NCD and HFD mice were assessed by RT-qPCR analysis (n = 3). c RT-qPCR analysis for Ido1 mRNA expression in mature adipocytes and SVF originated from NCD or HFD fed mice (n = 3). d Expression level of IDO1 in mature adipocytes of NCD and HFD mice (n = 6). e IDO1 expression in visceral white adipose tissue from lean (18 ≤ BMI < 24) and subjects with obesity (BMI ≥ 28, n = 4). f Correlation analysis between BMI and IDO1 levels in human mature adipocytes (n = 22). Data were expressed as mean ± SEM. Statistical significance was assessed by two-sided Student’s t test (a, d and e), two-way ANOVA (b and c) or two-sided Spearman’s correlation (f) and significant differences were indicated with p values. Source data are provided in the Source Data file.
Fig. 3
Fig. 3. Ido1 deficiency in adipocytes renders the mice with decreased Kyn level and resistance to obesity.
a Based on the CRISPR-Cas9 system, the Ido1flox/flox mice were generated by inserting two loxP sequences in the same direction into the intron flanking exon 4 of IDO1, which would generate a stop codon in exon 3 to produce a nonfunctional IDO1 protein after Cre-mediated gene deletion. The Ido1flox/flox mice were crossed with the Adipoq-CreERT2 mice to get the Adipq-CreERT2-Ido1flox/flox mice. After intraperitoneally injected with tamoxifen (75 mg/kg/d) for 5 days, the Ido1-aKO mice and their littermates were employed for following studies. b Body weights of Ctrl and Ido1-aKO mice fed with HFD for 12 weeks (n = 8). Kyn, Trp concentration and KTR in eWAT (c) and plasma (d) from Ctrl and Ido1-aKO mice fed with HFD for 12 weeks (n = 8). e Respiratory exchange ratio (left) and heat production (right) of HFD-fed Ctrl and Ido1-aKO mice (n = 4). f Representative images of 18F-FDG micro-PET/CT (left) and quantification (right) of tissue FDG uptake in Ctrl and Ido1-aKO mice fed with HFD for 12 weeks (SUVmuscle was used as a standardized value) (n = 3). GTT (g) and ITT (h) of Ctrl and Ido1-aKO mice fed with HFD for 12 weeks (left) and areas under curves (AUC) (right) (n = 8). i Plasma insulin levels of the Ctrl and Ido1-aKO mice (n = 8). j Western blot analysis of p-AKTSer473 and AKT, in eWAT from Ctrl and Ido1-aKO mice fed with 12-week HFD (n = 4). k Flow cytometry analysis of macrophage subsets in the eWAT of Ctrl mice and Ido1-aKO mice (n = 8). Data were represented as mean ± SEM. RER in e was analyzed by the moving average. Student’s t test was used for statistical analysis. Statistical significance was assessed by two-way ANOVA followed with Bonferroni’s multiple comparisons test (b, e, g and h), two-sided Student’s t test (c, d, f, ik) and significant differences were indicated with p values. Source data are provided in the Source Data file.
Fig. 4
Fig. 4. Kyn mediates metabolic disorder and insulin resistance in adipocytes via the AhR/STAT3/IL-6 axis.
a 3T3-L1-derived mature adipocytes were stimulated with gradient concentrations of Kyn (0, 25, 50, 100 μg mL−1), representatively. Oil Red staining of lipid droplets within the adipocytes was recorded. The experiments were repeated independently three times. Scale bar, 100 µm. b Transcriptional levels of lipogenesis associated genes (C/ebpα, PPARγ, Fabp4) in the above adipocytes (n = 3). c After the treatment of Kyn (0, 25, 50, 100 μg mL−1) and palmitate (0.25 mmol L−1, PA, Sigma), 100 nM insulin was added into the medium for 15 min before collecting the adipocytes. Western blot was conducted to detect p-ACCSer79/ACC, p-HSLSer660/HSL, p-AKTSer473/AKT in the adipocytes. The experiments were performed independently three times, and the quantitative analysis was shown as a bar graph in the bottom panel (n = 3). d AhR, p-STAT3Tyr705 and STAT3 expression levels in above adipocytes were determined by Western blot. β-Actin or Lamin b was used as internal controls. The quantitative analysis was shown as a bar graph in the bottom panel (n = 3 independent experiments). e The predicted AhR binding site within the Stat3 promoter. f ChIP results for the analysis of AhR binding activity to the Stat3 promoter. gDNA: guide DNA. g, h Relative luciferase activity in 3T3-L1. MU: mutant. The experiments were repeated independently three times (n = 3). i ELISA analysis of IL-6 in the culture supernatants of adipocytes following Kyn (100 μg mL−1) exposure for 48 h (n = 7). j Western blot analysis of p-AKTSer473/AKT, p-STAT3Tyr705/STAT3 and AhR in mature adipocytes treated with SR1 or Stattic (n = 3 independent experiments). k ELISA analysis of IL-6 in the culture supernatants of adipocytes treated with SR1 or Stattic. The experiments were repeated independently four times (n = 4). Data were represented as mean ± SEM. Statistical significance was assessed by one-way ANCOVA (bd, j and k), two-sided Student’s t test (i), two-way ANCOVA (h) and significant differences were indicated with p values. Source data are provided in the Source Data file.
Fig. 5
Fig. 5. The effect of Kyn is mediated by IL-6.
a Kyn (100 μg mL−1) and TCZ (100 μg mL−1) were added to stimulate 3T3-L1 derived adipocytes. Representative Oil Red staining images of the mature adipocytes. The experiments were performed independently three times. Scale bar, 100 µm. b After the treatment of Kyn (100 μg mL−1) with or without TCZ (100 μg mL−1), 100 nM insulin was added into the medium for 15 min before collecting the adipocytes. Western blot was conducted to detect p-ACCSer79/ACC, p-HSLSer660/HSL, p-AKTSer473/AKT in adipocytes (n = 3 independent experiments). c Body weight change of WT mice fed with 8-week NCD (n = 6) or HFD treated with PBS (n = 8) or Kyn (20 mg kg−1) (n = 10) or TCZ (5 mg kg−1) (n = 8) for another month, respectively. GTT (d) and ITT (e) of WT mice fed with 8-week NCD (n = 6) or HFD treated with PBS (n = 8) or Kyn (20 mg kg−1, n = 9 for IGTT and n = 8 for ITT, respectively) or TCZ (5 mg kg−1, n = 8) for another month. f Representative H&E staining images of eWAT originated from 8 weeks NCD and HFD fed mice following PBS, Kyn or TCZ treatment for one month (n = 6). Scale bar, 100 µm. g Western blot analysis of p-ACCSer79/ACC, p-HSLSer660/HSL, p-AKTSer473/AKT in eWAT from NCD, HFD, HFD+Kyn-treated mice and HFD+Kyn+TCZ-treated mice (n = 4). Statistical significance was assessed by one-way ANOVA (b, f and g) or two-way ANOVA followed with Bonferroni’s multiple comparisons test (c, d and e) and significant differences were indicated with p values. Source data are provided in the Source Data file.
Fig. 6
Fig. 6. Kyn promotes obesity and insulin resistance depending on AhR.
a The Ahrflox/flox mice were crossed with the Adipoq-CreERT2 mice to generate the Adipoq-CreERT2-Ahrflox/flox mice. After intraperitoneally injected tamoxifen (75 mg kg−1 d−1) for 5 days, the Ahr-aKO mice and their littermates were obtained. b Body weight for the Ctrl and Ahr-aKO mice following 12 weeks of HFD induction (n = 9). GTT (c) and ITT (d) of the Ctrl and Ahr-aKO mice after 12-week HFD (n = 9). e Plasma insulin levels of the Ctrl and Ahr-aKO mice fed with HFD for 12 weeks (n = 9). f RER and heat production of the mice (n = 4). g Images of eWAT and representative H&E staining images of eWAT originated from the Ctrl and Ahr-aKO mice (left), and the statistical analysis of adipocyte sizes (right) (n = 9). Scale bar, 100 µm. h Kyn concentration in eWAT (left) and plasma (right) originated from the Ctrl and Ahr-aKO mice (n = 8). i Western blot of p-STAT3Tyr705/STAT3 and AhR in adipocytes from the Ctrl and Ahr-aKO mice (n = 3). j Stat3 and Il-6 in eWAT from the Ctrl and Ahr-aKO mice were measured by RT-qPCR (n = 6). k ELISA analysis of IL-6 concentration in eWAT (n = 7). l Western blot results of p-AKTSer473 and AKT in eWAT (n = 4). Data were represented as mean ± SEM. RER in f, was analyzed by moving average. Statistical significance was assessed by two-way ANOVA followed with Bonferroni’s multiple comparisons test (b, c, d and f), two-sided Student’s t test (e, gl) and significant differences were indicated with p values. Source data are provided in the Source Data file.
Fig. 7
Fig. 7. Vit-B6 confers protection by facilitating Kyn catabolism.
a Plasma PLP levels in the lean subjects (18 ≤ BMI < 24, n = 354), subjects with overweight (24 ≤ BMI < 28, n = 268) and subjects with obesity (BMI ≥ 28, n = 113). b Plasma PLP levels in WT mice fed with a 12-week of NCD or HFD (n = 25). c eWAT PLP levels in WT mice fed with a 12-week of NCD or HFD (n = 10). d Western blot results for p-STAT3Tyr705/STAT3 and AhR in mature adipocytes with indicated treatments (n = 3 independent experiments). e ELISA analysis of IL-6 in the culture supernatants of adipocytes with indicated treatments. f Bodyweight of HFD fed mice and HFD + B6 fed mice (n = 8). GTT (g) and ITT (h) measured in HFD fed mice and HFD + B6 fed mice (n = 8). PLP (i) and Kyn (j) levels in eWAT (left) and plasma (right) of mice in the HFD group and HFD + B6 group (n = 8). k RT-qPCR results for Ahr, Stat3 and Il-6 in eWAT of mice from HFD group and HFD + B6 group (n = 6). l Western blot results for p-STAT3Tyr705/STAT3 and AhR in eWAT of mice from HFD group and HFD + B6 group. m Western blot for p-AKTSer473 and AKT in eWAT of mice from HFD group and HFD + B6 group (n = 6). Data were represented as mean ± SEM. Statistical significance was assessed by one-way ANOVA (a, e), two-sided Student’s t test (b, c, i, j, k, l and m) and two-way ANOVA followed with Bonferroni’s multiple comparisons test (f, g and h) and significant differences were indicated with p values. Source data are provided in the Source Data file.
Fig. 8
Fig. 8. Scheme of adipocyte-derived kynurenine promoting obesity and insulin resistance.
Over nutrition induces overexpress IDO1 in adipocytes, which then produce copious amount of Kyn, thereby exacerbating insulin resistance and obesity via the AhR/STAT3/IL-6 axis, while PLP catalyze Kyn catabolism to efficiently prevent insulin resistance and obesity.

References

    1. Blüher M. Metabolically healthy obesity. Endocr. Rev. 2020;41:405–420. doi: 10.1210/endrev/bnaa004. - DOI - PMC - PubMed
    1. Stefan N. Causes, consequences, and treatment of metabolically unhealthy fat distribution. Lancet Diabetes Endocrinol. 2020;8:616–627. doi: 10.1016/S2213-8587(20)30110-8. - DOI - PubMed
    1. Jang C, et al. The small intestine shields the liver from fructose-induced steatosis. Nat. Metab. 2020;2:586–593. doi: 10.1038/s42255-020-0222-9. - DOI - PMC - PubMed
    1. Piché ME, Tchernof A, Després JP. Obesity phenotypes, diabetes, and cardiovascular diseases. Circulation Res. 2020;126:1477–1500. doi: 10.1161/CIRCRESAHA.120.316101. - DOI - PubMed
    1. Wang Y, Zhao L, Gao L, Pan A, Xue H. Health policy and public health implications of obesity in China. Lancet Diabetes Endocrinol. 2021;9:446–461. doi: 10.1016/S2213-8587(21)00118-2. - DOI - PubMed

Publication types