. 2022 Jun 17;12(1):10237.
doi: 10.1038/s41598-022-14284-w.

Diethyl phthalate (DEP) perturbs nitrogen metabolism in Saccharomyces cerevisiae

Affiliations

Diethyl phthalate (DEP) perturbs nitrogen metabolism in Saccharomyces cerevisiae

Corinna Jie Hui Goh et al. Sci Rep. .

Abstract

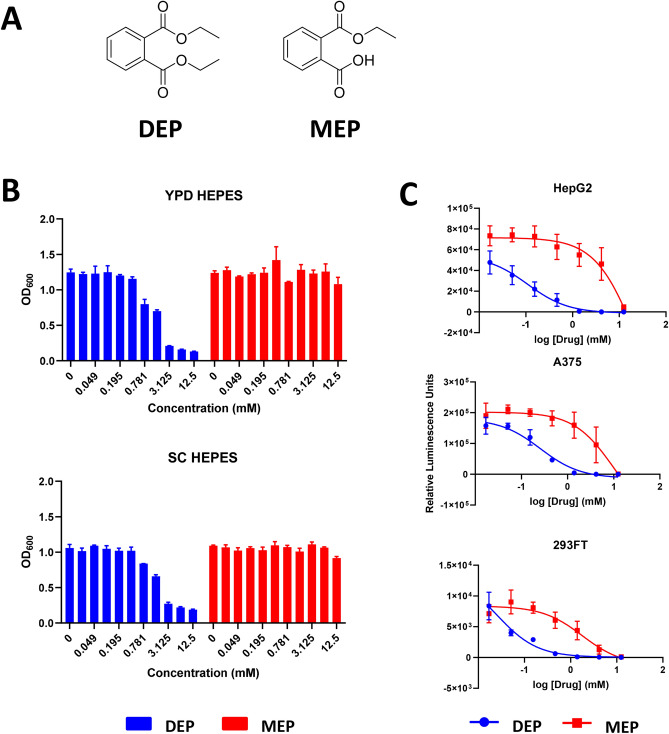
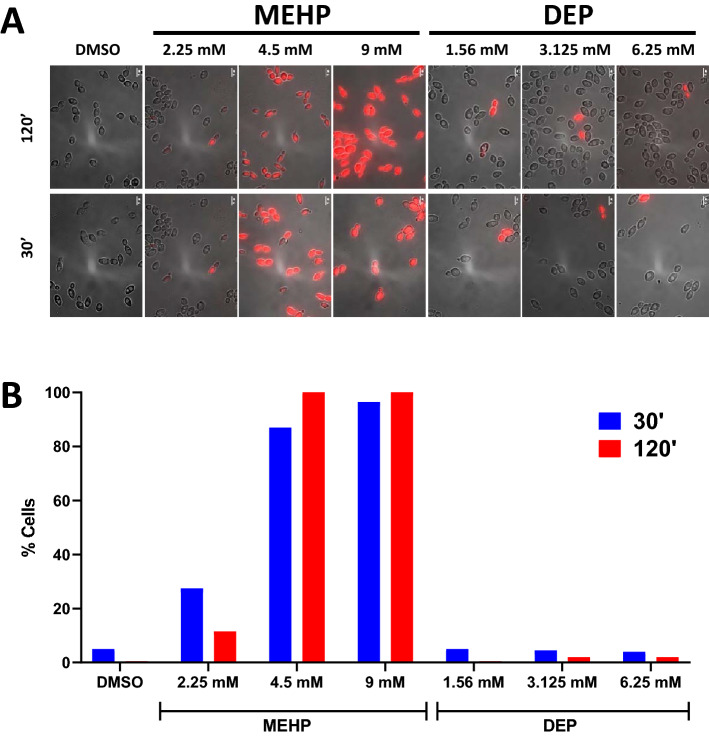
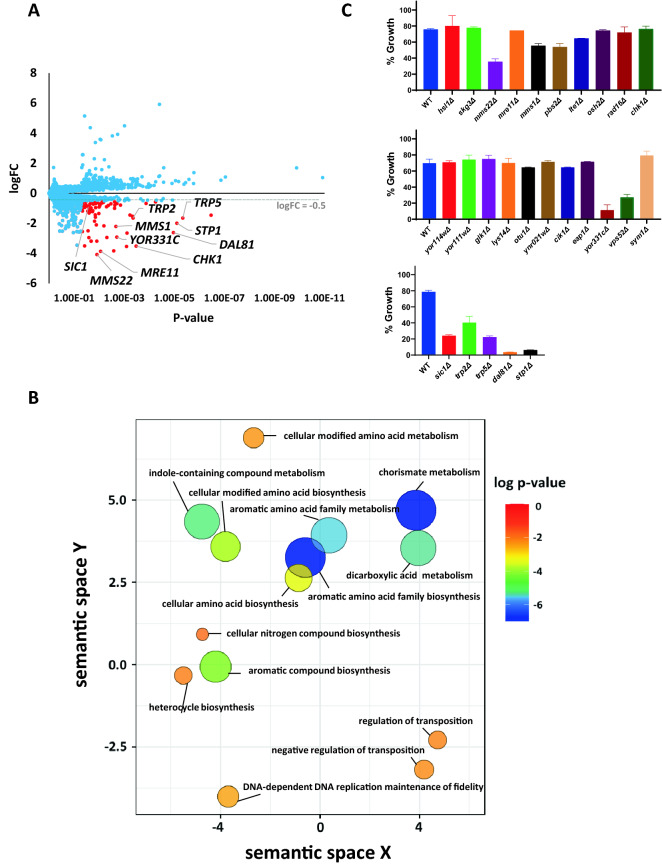
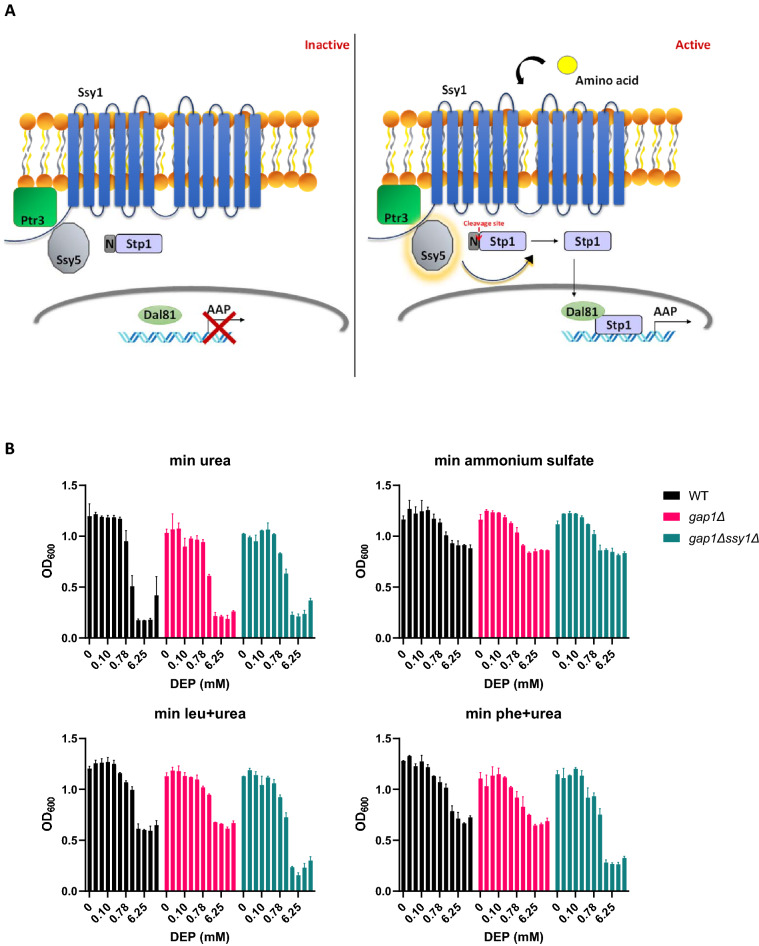
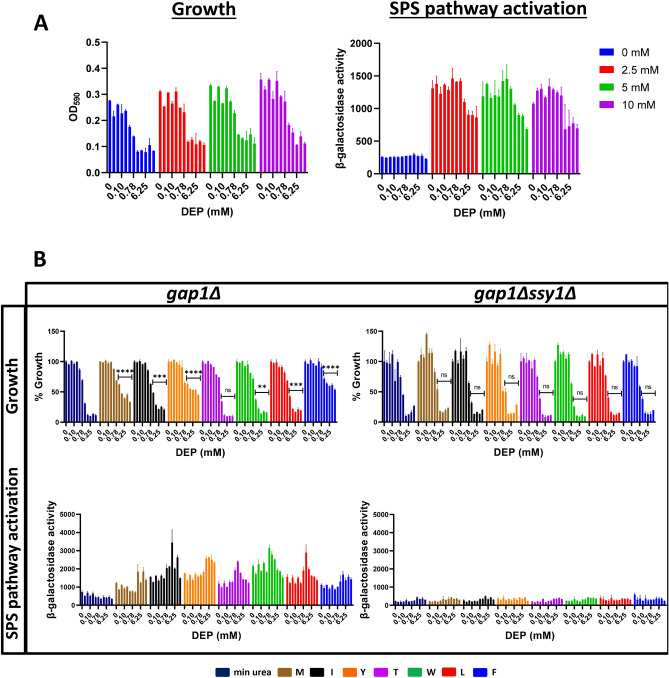
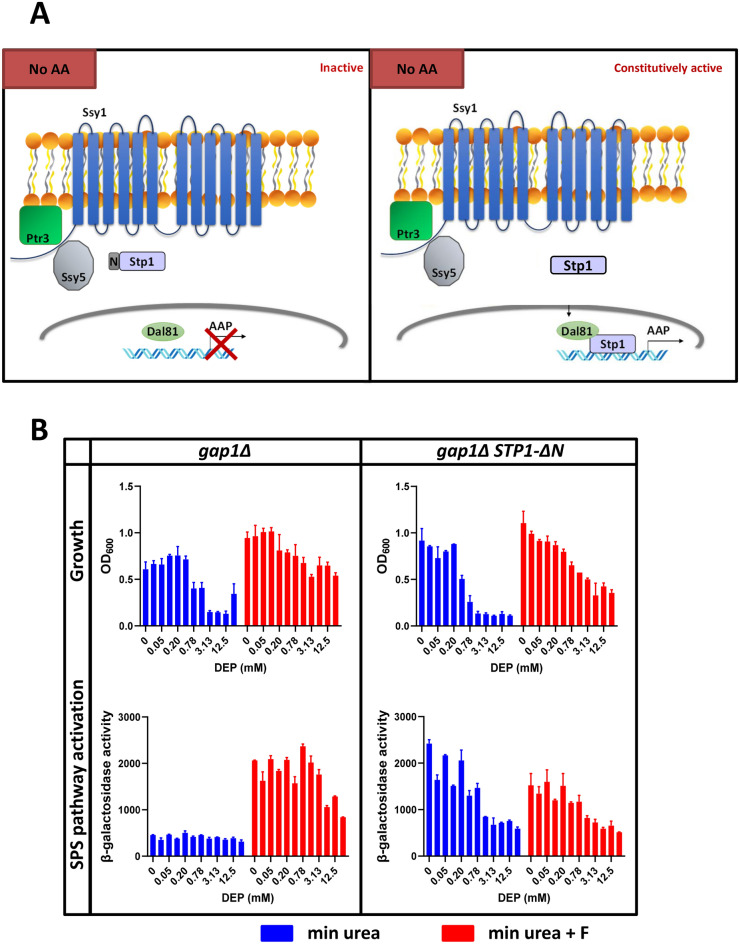
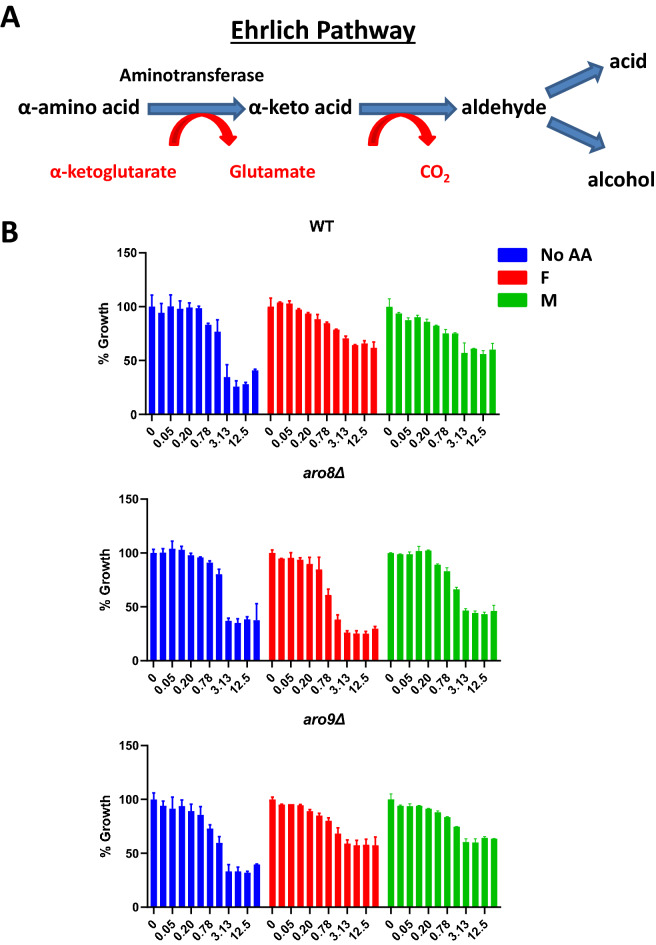
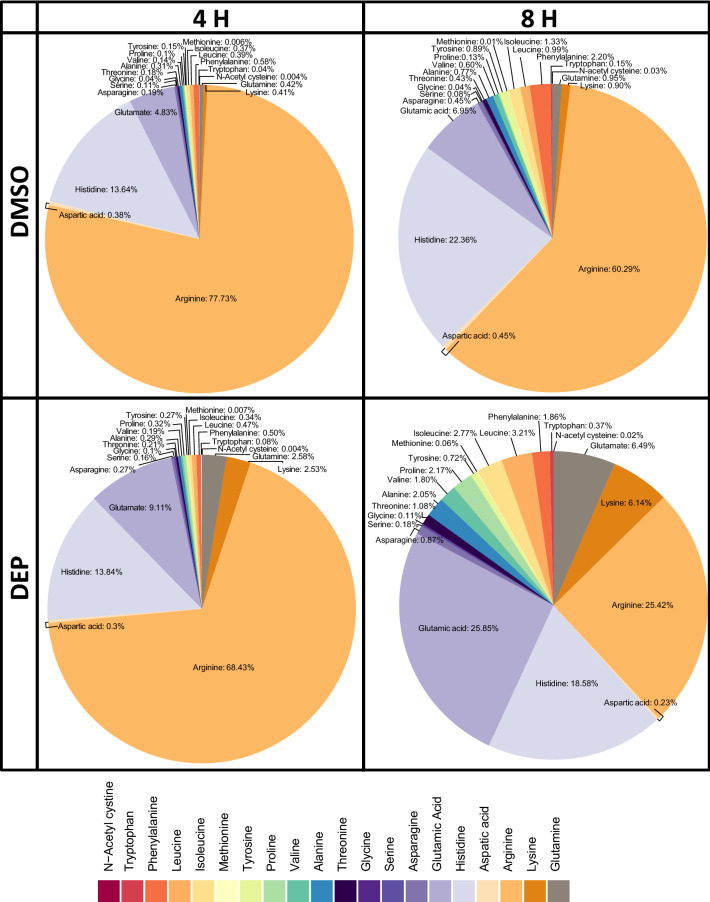
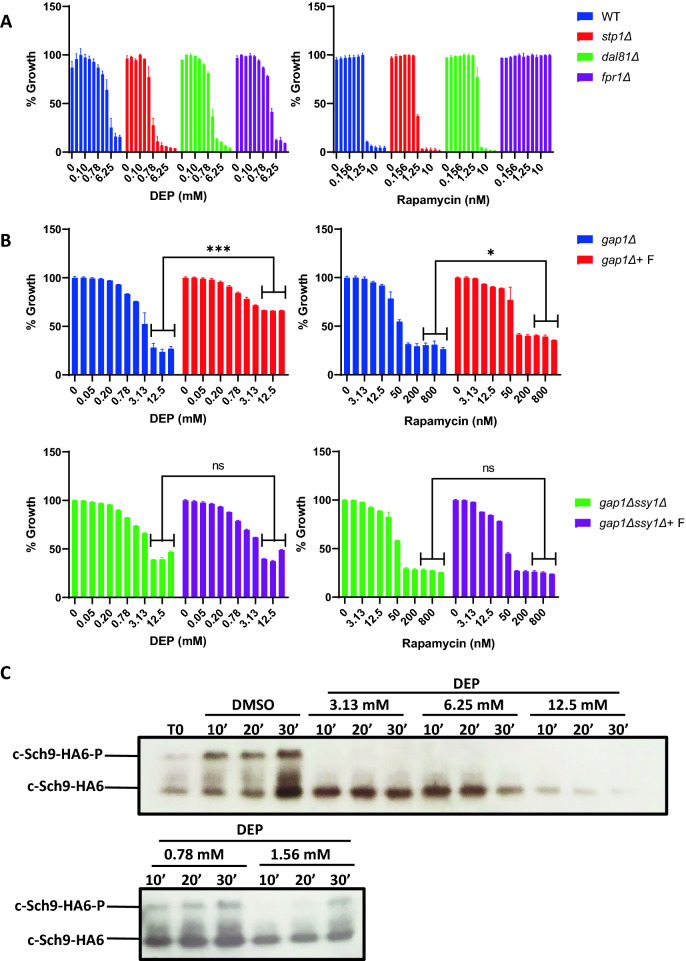
Phthalates are ubiquitously used as plasticizers in various consumer care products. Diethyl phthalate (DEP), one of the main phthalates, elicits developmental and reproductive toxicities but the underlying mechanisms are not fully understood. Chemogenomic profiling of DEP in S. cerevisiae revealed that two transcription factors Stp1 and Dal81 involved in the Ssy1-Ptr5-Ssy5 (SPS) amino acid-sensing pathway provide resistance to DEP. Growth inhibition of yeast cells by DEP was stronger in poor nitrogen medium in comparison to nitrogen-rich medium. Addition of amino acids to nitrogen-poor medium suppressed DEP toxicity. Catabolism of amino acids via the Ehrlich pathway is required for suppressing DEP toxicity. Targeted metabolite analyses showed that DEP treatment alters the amino acid profile of yeast cells. We propose that DEP inhibits the growth of yeast cells by affecting nitrogen metabolism and discuss the implications of our findings on DEP-mediated toxic effects in humans.


Conflict of interest statement

The authors declare no competing interests.

Figures

Figure 1
Figure 1
DEP is more toxic than MEP to yeast and human cells. (A) Structures of DEP and MEP. (B) Growth of wild type yeast cultures (S288C background) in the presence of varying concentrations of MEP and DEP in rich medium (YPD) and Synthetic Complete medium (SC). Each consecutive bar represents a doubled concentration of the preceding bar, with 12.5 mM as the maximal concentration used for both MEP and DEP. (C) Plot of relative luminescence units against log(DEP) and log(MEP) from RealTime-Glo MT Cell Viability Assay in HepG2, A375 and 293FT cell lines. Error bars indicate standard deviation (N = 2).
Figure 2
Figure 2
DEP does not affect plasma membrane integrity of yeast cells. (A) Representative composite bright field and fluorescence microscopy images of propidium iodide uptake in yeast after 30 min and 2 h exposure to DMSO, MEHP (2.25, 4.5, 9 mM) and DEP (1.56, 3.125, 6.25 mM). Scale bar = 5 µm. (B) Percentage of DMSO, MEHP (2.25, 4.5, 9 mM) and DEP (1.56, 3.125, 6.25 mM) treated cells containing propidium iodide (N ≥ 100 cells).
Figure 3
Figure 3
Chemogenomic profiling of DEP. (A) Plot of logarithm of fitness coefficient (logFC) versus P-value derived from homozygous profiling (HOP) assay of DEP. Mutants with logFC < − 0.5 and P-value < 0.05 are displayed as red dots while the rest are displayed as blue dots. Only gene names of the tested mutants deemed significant are annotated in the plot for visualization. The grey dotted line represents logFC of − 0.5. (B) Gene ontology (biological process) enrichment analysis of DEP with REVIGO. GO terms obtained from web-based tool DAVID are filtered out by the REVIGO server for redundancy. GO terms which share semantic similarities are clustered together in the 2-dimensional scatterplot. P-value (for the enrichment strength in the annotation category) is depicted by the bubble colour while GO term frequency is depicted by bubble size. (C) Validation of HOP data of DEP. Wild type and various deletion mutants were exposed to a series of DEP concentrations in duplicate overnight. Growth measurements (OD600) were normalized and plotted for each deletion strain at 1.56 mM DEP. Representative data from one of three biological replicates is shown. Error bars indicate standard deviation (N = 2).
Figure 4
Figure 4
Amino acid addition to a medium containing poor nitrogen source rescues DEP toxicity. (A) SPS pathway. When amino acids are absent, SPS pathway remains inactive. Ssy5 remains inactive and does not cleave the pro-domain of Stp1, preventing the transcription of amino acid permease (AAP) genes. When amino acids are present, SPS pathway is active. Upon binding to the amino acid sensor Ssy1, Ssy5 is activated and cleaves the pro-domain of Stp1, permitting it to enter the nucleus and associate with Dal81 to induce transcription of amino acid permease (AAP) genes. (B) Growth inhibition of WT, gap1Δ and gap1Δ ssy1Δ (Σ1278b background) in minimal urea media with no amino acids or with 5 mM ammonium sulfate or phenylalanine, or leucine. Error bars indicate standard deviation (N = 2). Each consecutive bar represents a doubled concentration of the preceding bar, with 25 mM as the maximal concentration used for DEP.
Figure 5
Figure 5
DEP does not affect the activation of the SPS signalling pathway. (A) OD600 and β-galactosidase activity in gap1Δ (Σ1278b background) with DEP at different phenylalanine concentrations (0, 2.5, 5 and 10 mM). Error bars indicate standard deviation (N = 2). Two-fold serial dilution of DEP (maximum concentration at 25 mM) was used. (B) Comparison of normalized growth and β-galactosidase activity in gap1Δ and gap1Δ ssy1Δ (Σ1278b background) with and without individual amino acids (5 mM) methionine (M), isoleucine (I), tyrosine (Y), threonine (T), tryptophan (W), leucine (L) and phenylalanine (F) at a series of DEP concentrations. Error bars indicate standard deviation (N = 2). Two-fold serial dilution of DEP (maximum concentration at 25 mM) was used. (One-tailed paired t-test: ****P ≤ 0.0001, ***P ≤ 0.001, **P ≤ 0.01, *P ≤ 0.05 and ns: P > 0.05).
Figure 6
Figure 6
Constitutive activation of SPS pathway does not rescue DEP toxicity. (A) Schematic diagram comparing the inactive SPS pathway and constitutively activated SPS pathway in the absence of amino acids. (B) Constitutive activation of SPS pathway from Stp1ΔN in presence and absence of phenylalanine (5 mM). The reported values for OD600 and β-galactosidase activities in gap1Δ and gap1Δ STP1ΔN (Σ1278b background) are obtained from two independent experiments (mean ± SD). Two-fold serial dilution of DEP (maximum concentration at 25 mM) was used.
Figure 7
Figure 7
Catabolism of phenylalanine via the Ehrlich pathway is required for suppression of DEP-toxicity. (A) Catabolism of an α-amino acid via the Ehrlich pathway. (B) Wild type, aro8Δ and aro9Δ cells (Σ1278b background) growing in minimal urea medium in the absence (No AA) and presence of 5 mM phenylalanine (F)/methionine (M) were exposed to two-fold serial dilutions of DEP (maximum concentration at 25 mM). Normalized growth of various cultures is depicted as mean ± SD (N = 2).
Figure 8
Figure 8
DEP alters the amino acid profile of yeast cells. Pie charts depicting the mean relative molar fractions of individual amino acids detected with mass spectrometry in ∑1278b wild type yeast cells treated with DMSO and 3.13 mM DEP in minimal urea medium for 4 and 8 h (N = 3).
Figure 9
Figure 9
Treatment of yeast cells with DEP reduces TORC1 activity. (A) Comparison of normalized growth in wild type, stp1Δ, dal81Δ and fpr1Δ (S288C background) exposed to two-fold serial dilutions of DEP (maximal concentration at 25 mM) and Rapamycin (maximal concentration at 40 nM). (B) Normalized growth of gap1Δ and gap1Δ ssy1Δ cells (Σ1278b background) in minimal urea medium with and without phenylalanine (F) (5 mM) and exposed to two-fold serial dilutions of DEP (maximal concentration at 25 mM) and Rapamycin (maximal concentration at 1600 nM). Error bars represent mean ± SD from technical duplicates (One-tailed paired t-test, *P ≤ 0.05, **P < 0.01, ***P < 0.001). (C) Western blot of wild type yeast cells (Σ1278b background) treated with DMSO or DEP (0.78, 1.56, 3.13, 6.25 or 12.5 mM) for 10, 20 and 30 min. T0: Cycling cells. Unprocessed images of the two westerns are presented in Fig. S10).

References

    1. Schettler T, Skakkebæk NE, De Kretser D, Leffers H. Human exposure to phthalates via consumer products. Int. J. Androl. 2006;29(1):134–139. doi: 10.1111/j.1365-2605.2005.00567.x. - DOI - PubMed
    1. Mayer FL, Sanders HO. Toxicology of phthalic acid esters in aquatic organisms. Environ. Health Perspect. 1973;3:153–157. doi: 10.1289/ehp.7303153. - DOI - PMC - PubMed
    1. Staples CA, Peterson DR, Parkerton TF, Adams WJ. The environmental fate of phthalate esters: A literature review. Chemosphere. 1997;35(4):667–749. doi: 10.1016/S0045-6535(97)00195-1. - DOI
    1. Rudel RA, Perovich LJ. Endocrine disrupting chemicals in indoor and outdoor air. Atmos. Environ. 2009;43(1):170–181. doi: 10.1016/j.atmosenv.2008.09.025. - DOI - PMC - PubMed
    1. Duty SM, Silva MJ, Barr DB, Brock JW, Ryan L, Chen Z, Herrick RF, Christiani DC, Hauser R. Phthalate exposure and human parameters. Epidemiology. 2003;14(3):269–277. doi: 10.1097/00001648-200305000-00005. - DOI - PubMed

Publication types

MeSH terms

LinkOut - more resources