. 2022 Sep;3(9):1039-1051.
doi: 10.1038/s43018-022-00398-7. Epub 2022 Jun 17.

Cytokine release syndrome-like serum responses after COVID-19 vaccination are frequent and clinically inapparent under cancer immunotherapy

Collaborators, Affiliations

Cytokine release syndrome-like serum responses after COVID-19 vaccination are frequent and clinically inapparent under cancer immunotherapy

Thomas Walle et al. Nat Cancer. 2022 Sep.

Erratum in

Abstract

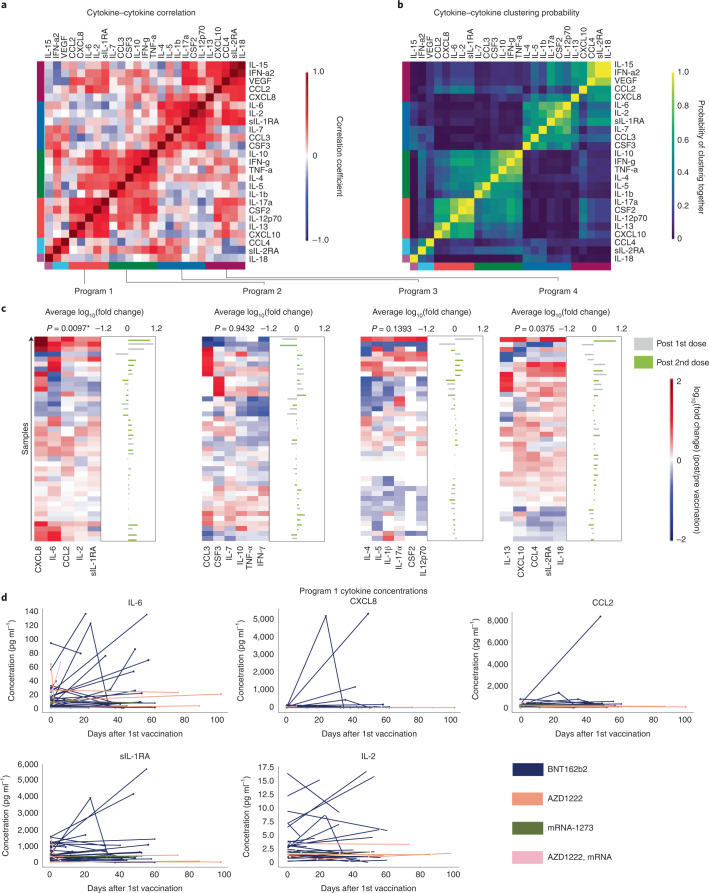
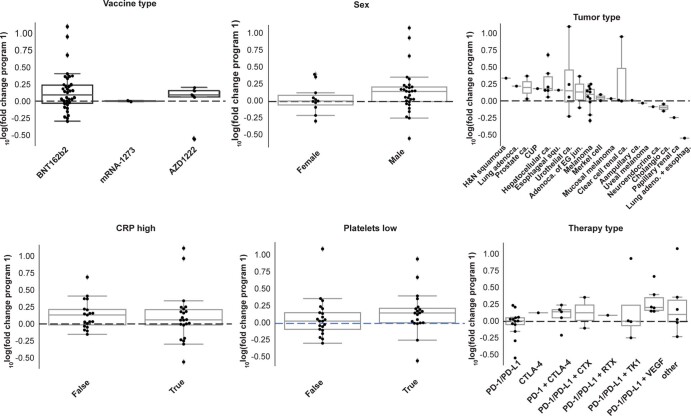
Patients with cancer frequently receive immune-checkpoint inhibitors (ICIs), which may modulate immune responses to COVID-19 vaccines. Recently, cytokine release syndrome (CRS) was observed in a patient with cancer who received BTN162b2 vaccination under ICI treatment. Here, we analyzed adverse events and serum cytokines in patients with 23 different tumors undergoing (n = 64) or not undergoing (n = 26) COVID-19 vaccination under ICI therapy in a prospectively planned German single-center cohort study (n = 220). We did not observe clinically relevant CRS (≥grade 2) after vaccination (95% CI 0-5.6%; Common Terminology of Adverse Events v.5.0) in this small cohort. Within 4 weeks after vaccination, serious adverse events occurred in eight patients (12.5% 95% CI 5.6-23%): six patients were hospitalized due to events common under cancer therapy including immune related adverse events and two patients died due to conditions present before vaccination. Despite absence of CRS symptoms, a set of pairwise-correlated CRS-associated cytokines, including CXCL8 and interleukin-6 was >1.5-fold upregulated in 40% (95% CI 23.9-57.9%) of patients after vaccination. Hence, elevated cytokine levels are common and not sufficient to establish CRS diagnosis.


Conflict of interest statement

T.W. reports previous and current stock ownership of various pharmaceutical companies manufacturing SARS-CoV-2 vaccines and diagnostics including BionTech, Astra Zeneca and Roche. T.W. also reports research support from CanVirex, a spin-off company of the Heidelberg University Hospital developing viral vector-based immunotherapies and vaccines (financial support for blood sampling materials). G.U. is founder and current CMO/CSO of CanVirex, Basel, Switzerland. G.M.H. reports consulting or advisory roles (unrelated) at Bristol-Myers Squibb, MSD Sharp & Dohme, Lilly, Novartis and Daiichi Sankyo; honoraria (unrelated) from Servier, MSD Sharp & Dohme, Lilly, Targos, Bristol-Myers Squibb, IOMEDICO and MCI Conventions; research funding (unrelated) from Nordic Pharma, Taiho Pharmaceutical, MSD Sharp & Dohme, Janssen, Astra Zeneca and IKF Klinische Krebsforschung Frankfurt; and travel/accommodations (unrelated) from Bristol-Myers Squibb, Lilly, Servier and MSD Sharp & Dohme. All other authors declare no competing interests.

Figures

Fig. 1
Fig. 1. A pan-tumor cohort study across diverse immune combination therapies.
a, CONSORT flow chart indicating patient screening data and cohorts for subsequent data analysis. b, Stacked bar-graph depicting the type of COVID-19 vaccination for vaccinated patients (n = 64). c, Stacked bar graph indicating tumor types of vaccinated (n = 64) and unvaccinated (n = 26) patients. AEG, adenocarcinoma of the esophagogastric junction; BRCA, breast cancer; HNSC, head and neck squamous cell carcinoma; KIRC, renal cell carcinoma; LIHC, liver hepatocellular carcinoma; MER, Merkel cell carcinoma; NEC, neuroendocrine carcinoma; PAAD, pancreatic adenocarcinoma; SKCM, skin melanoma; UCA, urothelial carcinoma; UVM, uveal melanoma. d, Stacked bar-graph indicating immunotherapies of vaccinated (n = 64) and unvaccinated (n = 26) patients. CTX, chemotherapy; RTX, radiotherapy; TKI, tyrosine kinase inhibitor. Source data
Fig. 2
Fig. 2. Early adverse events after COVID-19 vaccination under immune-checkpoint therapy.
a, Schematic timeline depicting the start and duration of follow-up and vaccination time points of vaccinated and unvaccinated patients. b, Tree maps visualizing the proportion and the numbers of all and grade ≥3 AEs up to 4 weeks after vaccination in vaccinated patients (n = 64). In tree map for all AE: others (n = 5) include vomiting (n = 1), ileus (n = 1), upper GI bleed (n = 1), hepatic failure (n = 1) and heart failure (n = 1); pain (n = 3) includes headache (n = 2) and arthralgia (n = 1); infections (n = 3) include C.difficile infection (n = 1), E.coli sepsis (n = 1) and herpes simplex reactivation (n = 1). In tree map for grade ≥3 AEs: infections (n = 2) include C.difficile infection (n = 1) and E.coli sepsis (n = 1). c, Line-plots indicating platelet counts (n = 61, left) and CRP (n = 55, right) either after the first vaccine dose (top) or second vaccine dose (bottom). Reference ranges are indicated in pink shading. Lines are colored according to the vaccination schema used with the color code indicated below. NA, not available. Source data
Fig. 3
Fig. 3. A correlated program of CRS-related cytokines is frequently upregulated after COVID-19 vaccination under immune-checkpoint therapy.
a, Heat map indicating Pearson correlation indices of log10(fold change) cytokine concentrations after COVID-19 vaccination from n = 35 patients. Colored bars on the sides indicate clusters obtained from hierarchical clustering. b, Heat map indicating probability of each pair of cytokines clustering together as calculated by bootstrapping (n = 10,000 samplings) from n = 35 patients. Colored bars on the sides indicate clusters obtained from hierarchical clustering. c, Heat maps indicating log10(fold change) of cytokine concentrations after vaccination. Bar graph on the side indicates average log10(fold change) of cytokines in each row with concentrations after the first or second vaccination dose labeled according to the color code on the right from n = 35 patients. P values (two-sided) were calculated using a Wilcoxon signed-rank test (test statistics from left to right are 231, 425, 301 and 270; Cohen’s D calculated as mean fold change/s.d. fold change from left to right is 0.93, 3.22, 1.32 and 1.21). P values significant (α = 0.05) after correcting for multiple comparisons with the Benjamini–Hochberg method are indicated with an asterisk. d, Line-plots indicating cytokine concentrations of cytokine program 1 cytokines after vaccination from n = 35 patients and vaccine type indicated in the color code at the bottom right. Source data
Fig. 4
Fig. 4. Comparable adverse events and prolonged overall survival in COVID-19-vaccinated immune-checkpoint therapy-treated patients with cancer.
a,b, Grouped bar plots indicating the frequency and error bars the 95% CI of overall AE (a) or grade ≥3 AEs (b) under ICI therapy in vaccinated (n = 64) and unvaccinated (n = 26) patients. This is proportional data and the CI is asymmetric and the center is the bar. c, Total number of hospitalizations due to irAEs and other AEs in vaccinated and unvaccinated patients (as listed in Supplementary Table 4) in vaccinated (n = 19) and unvaccinated (n = 10) patients. d, Kaplan–Meier curve indicating overall survival probability of vaccinated (n = 64) and unvaccinated (n = 26) patients under ICI therapy. P values (two-sided, test statistic 9.345) and hazard ratios (95% CI = 0.07–0.69) were calculated using a log-rank test. Grey gradient bars indicate the proportion of patients who received the first or second vaccination dose over time with the timeline indicated above and color legend indicated below. e, Forest plot indicating the results of the Cox proportional hazards model of n = 90 patients with squares indicating the log10(HR) and whiskers indicating the 95% CI. P values (two-sided) were not corrected for multiple comparisons and number of events are indicated on the left. HR, hazard ratio; CNS, central nervous system; MS, musculoskeletal. Source data
Extended Data Fig. 1
Extended Data Fig. 1. Gating strategy for flow-cytometry based multiplex cytokine array, related to Fig. 3.
Schema outlining the gating strategy used in the multiplex cytokine arrays and neutralizing antibody assay to define bead populations based on sideward-scatter (SSC), forward-scatter (FSC) and fluorescence signal in the red laser 670/14 channel. First row indicating gating schemas for cytokine panel 1 (741091, Biolegend, CA, USA), second row indicating gating for cytokine panel 2 (741142, Biolegend, CA, USA) and third row indicating gating for SARS-CoV-2 Neutralizing Antibody Assay (741127, Biolegend, CA, USA).
Extended Data Fig. 2
Extended Data Fig. 2. Cytokine concentrations in COVID-19 vaccinated patients, related to Fig. 3.
Line-plots indicating log1p transformed individual cytokine concentrations of cytokine program 1 cytokines after vaccination in n = 35 patients. log1p(x) = 10log(x + 1) with x: cytokine concentration in pg/ml. Source data
Extended Data Fig. 3
Extended Data Fig. 3. Cytokine program 1 upregulation stratified by patient characteristics, related to Fig. 3.
Box-plots indicating median 10log(fold change) of cytokine program 1 after COVID-19 vaccination (horizontal lines) with inter-quartile range (boxes) and range (whiskers, range calculation not including outliers as implemented in seaborn.boxplot function) stratified according to vaccine type (left upper panel), sex (middle upper panel), tumor type (right upper panel), above or below median of maximum CRP after vaccination(after 1st vaccination dose for cytokine samples after 1st vaccination or after 2nd vaccination dose for cytokine samples after 2nd vaccination), above or below median of minimum platelet counts after vaccination (after 1st vaccination dose for cytokine samples after 1st vaccination or after 2nd vaccination dose for cytokine samples after 2nd vaccination) or by therapy type (n = 41 patient samples). Source data
Extended Data Fig. 4
Extended Data Fig. 4. Univariate linear regression for cytokine program 1, related to Fig. 3.
Scatter plots indicating average 10log(fold change) of cytokine program 1 after COVID-19 vaccination (dependent variable) in relation to different clinical variables (independent variables). Boolean variables True and False on the x axis refer to the variable indicated in the header. Lines indicate the regressed function with p values (two-sided) not corrected for multiple comparisons and R values indicated in each panel (n = 41 patient samples). Source data
Extended Data Fig. 5
Extended Data Fig. 5. Adverse events in sex, age, insurance type matched COVID-19-vaccinated and unvaccinated immune checkpoint therapy treated patients with cancer, related to Fig. 4.
(a) Box and whiskers plot depicting the total follow-up duration (days) for vaccinated (n = 64) and unvaccinated (n = 26) patients. The whiskers indicate range, the box the upper and lower quartile and the horizontal bar the median. (b) Schema indicating the propensity score based matching procedure. (c) Bar graphs indicating the proportional difference of sex and insurance status before and after propensity score matching (upper panel, n = 26 unvaccinated and n = 26 matched vaccinated patients). Xy plot indicating the empirical cumulative distribution function (eCDF) of vaccinated (n = 26) and unvaccinated (n = 26) patients before and after matching. (d) Bar graphs indicating frequencies and error bars the 95% confidence interval of all (upper panel) or grade ≥3 (lower panel) adverse events in matched vaccinated (n = 26) and unvaccinated (n = 26) patients. This is proportional data therefore the confidence interval is asymmetric and the center is the bar. Source data
Extended Data Fig. 6
Extended Data Fig. 6. Adverse events in sex, age, ECOG matched COVID-19-vaccinated and unvaccinated immune checkpoint therapy treated cancer patients, related to Fig. 4.
(a) Schema indicating the propensity score based matching procedure. (b) Bar graphs indicating the proportional difference of sex and ECOG before and after propensity score matching (upper panel, n = 26 unvaccinated and n = 26 matched vaccinated patients). Xy plot indicating the empirical cumulative distribution function (eCDF) of vaccinated (n = 26) and unvaccinated (n = 26) patients before and after matching. (c) Bar graphs indicating frequencies and error bars the 95% confidence interval of all (upper panel) or grade ≥3 (lower panel) adverse events in matched vaccinated (n = 26) and unvaccinated (n = 26) patients. This is proportional data therefore the confidence interval is asymmetric and the center is the bar. Source data
Extended Data Fig. 7
Extended Data Fig. 7. Time to adverse event analysis, related to Fig. 4.
(a) Kaplan-Meier curves indicating the time without any (left panel) or ≥ CTCAE °3 adverse event (right panel) for vaccinated (n = 64) and unvaccinated patients (n = 26) over the entire course of immune checkpoint therapy with the legend indicated below. P values (two-sided) were calculated using logrank tests (any AE: test statistic= 19.4, grade ≥3 AE: test statistic =18.7). Exact p values: 1.0475761018388364e-05 (left panel), 1.5047888131226484e-05 (right panel). (b) Kaplan-Meier curves indicating the time without any (left panel) or ≥ CTCAE °3 adverse event (right panel) for unvaccinated patients (n = 26) over the entire course of immune checkpoint therapy and for vaccinated patients before (n = 48) vaccination, up to 28 days (n = 21) after vaccination and longer than 28 days (n = 37) after vaccination. The color code, average events per day and their 95% confidence intervals (in parenthesis) are indicated in the legend below. Source data
Extended Data Fig. 8
Extended Data Fig. 8. S1 neutralizing antibody concentrations after COVID-19 vaccination in ICI-treated patients, related to Fig. 4.
Line-plots indicating neutralizing antibody concentrations of n = 40 individual patients after vaccination as assessed by an ACE2 S1 competitive immunoassay (research grade). Color code indicating vaccine type in the respective patients. Source data
Extended Data Fig. 9
Extended Data Fig. 9. Vaccination is associated with prolonged overall survival probability across patient subgroups, related to Fig. 4.
Forest-plot indicating hazard ratios (HR, squares) and 95% confidence intervals (CI, whiskers) of vaccinated (n = 26) and unvaccinated (n = 64) patients stratified into the subgroups indicated with the exact number (no.) of events and patients at risk for each subgroup as well as the 95% CIs indicated on the left. Hazard ratios and confidence intervals were calculated using a Log-rank test or if no events were observed in one group with the Mantel-Hanszel method. sex - female: test statistic = 3.2, sex - male: test statistic = 11.3, age ≤60: test statistic = 9.4, age >60: test statistic = 4.4, ECOG 0: test statistic = 2.0, ECOG > 0: test statistic = 10.6, tumor type = melanoma: test statistic = 5.1, tumor type = other: test statistic = 11.1, stage <4: test statistic = 14.9, stage 4: test statistic = 0.7, therapy = PD-1/PD-L1 mono: test statistic = 7.1, therapy = other: test statistic = 7.0, therapy line = 1st: test statistic = 3.1, therapy line = other: test statistic = 13.5, BMI > 25: test statistic = 8.8, BMI ≤ 25: test statistic = 8.2. Diagn.: diagnosis. Source data
Extended Data Fig. 10
Extended Data Fig. 10. Landmark survival analysis in COVID-19 vaccinated and unvaccinated patients, related to Fig. 4.
Kaplan-Meier curves indicating overall survival of COVID-19 vaccinated and unvaccinated immune checkpoint inhibitor treated cancer patients. Survival was analyzed before (left panel) or after (right panel) said landmark. Only patients who gave informed consent until the landmark were included in this analysis. The landmark was defined as 17th May 2020, the date of general eligibility for COVID-19 vaccination for the entire adult population in the state of Baden-Württemberg, Germany. P values (two-sided) were calculated using logrank tests (before landmark: test statistic = 0.5 n = 22 unvaccinated, n = 62 vaccinated, after landmark: test statistic = 7.1 n = 25 unvaccinated, n = 57 vaccinated). Source data

References

    1. Russell B, et al. Risk of COVID-19 death in cancer patients: an analysis from Guy’s Cancer Centre and King’s College Hospital in London. Br. J. Cancer. 2021;125:939–947. doi: 10.1038/s41416-021-01500-z. - DOI - PMC - PubMed
    1. Trapani D, Curigliano G. COVID-19 vaccines in patients with cancer. Lancet Oncol. 2021;22:738–739. doi: 10.1016/S1470-2045(21)00250-3. - DOI - PMC - PubMed
    1. Ribas A, et al. Priority COVID-19 Vaccination for Patients with Cancer while Vaccine Supply Is Limited. Cancer Discov. 2021;11:233–236. doi: 10.1158/2159-8290.CD-20-1817. - DOI - PMC - PubMed
    1. Sahin U, Karikó K, Türeci Ö. mRNA-based therapeutics — developing a new class of drugs. Nat. Rev. Drug Discov. 2014;13:759–780. doi: 10.1038/nrd4278. - DOI - PubMed
    1. Frenck, R.W. et al. Safety, immunogenicity, and efficacy of the BNT162b2 Covid-19 vaccine in adolescents. New Engl. J. Med.10.1056/NEJMoa2107456 (2021). - PMC - PubMed

Publication types