. 2022 Jun 17;12(1):10217.
doi: 10.1038/s41598-022-14493-3.

Leveraging a national biorepository in Zambia to assess measles and rubella immunity gaps across age and space

Affiliations

Leveraging a national biorepository in Zambia to assess measles and rubella immunity gaps across age and space

Andrea C Carcelen et al. Sci Rep. .

Abstract

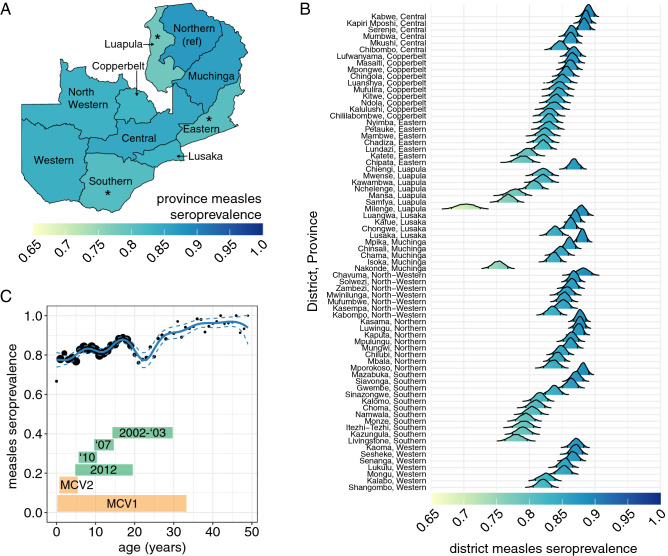
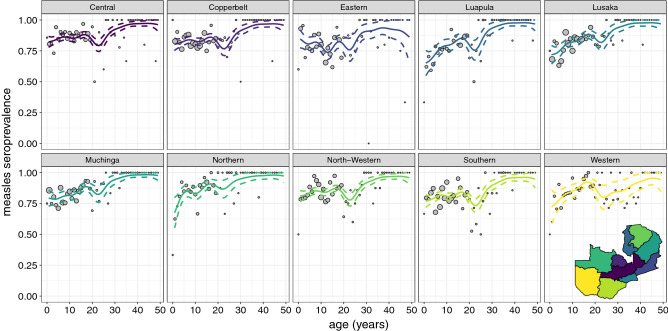
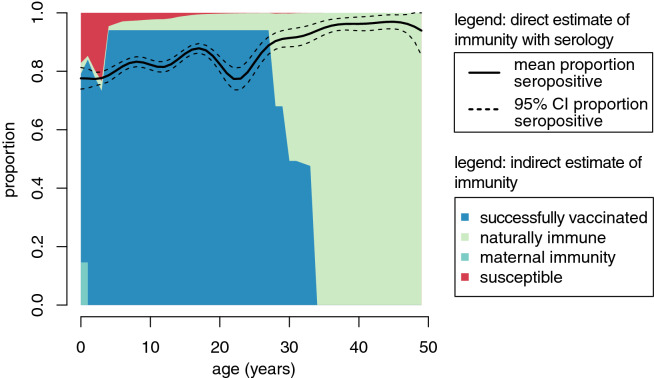
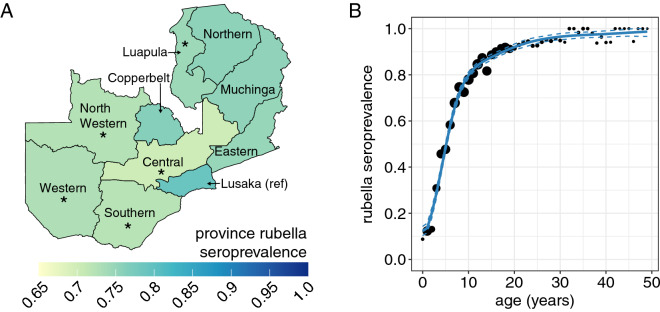
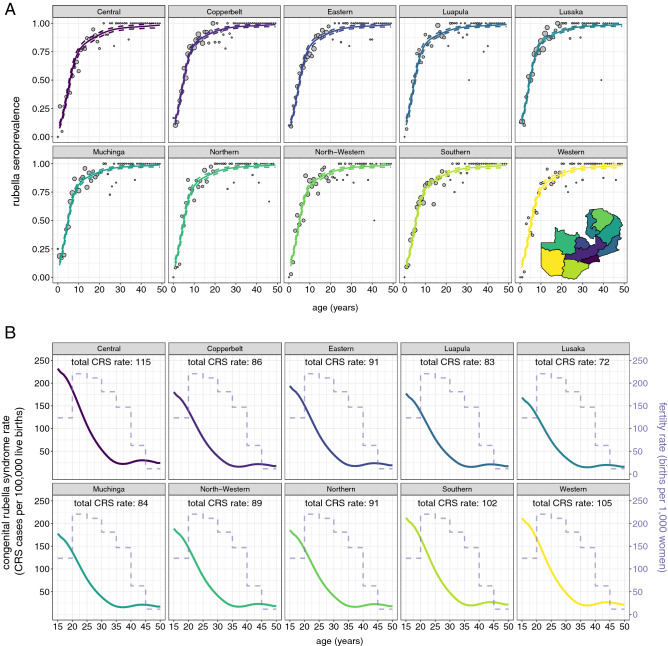
High-quality, representative serological surveys allow direct estimates of immunity profiles to inform vaccination strategies but can be costly and logistically challenging. Leveraging residual serum samples is one way to increase their feasibility. We subsampled 9854 residual sera from a 2016 national HIV survey in Zambia and tested these specimens for anti-measles and anti-rubella virus IgG antibodies using indirect enzyme immunoassays. We demonstrate innovative methods for sampling residual sera and analyzing seroprevalence data, as well as the value of seroprevalence estimates to understand and control measles and rubella. National measles and rubella seroprevalence for individuals younger than 50 years was 82.8% (95% CI 81.6, 83.9%) and 74.9% (95% CI 73.7, 76.0%), respectively. Despite a successful childhood vaccination program, measles immunity gaps persisted across age groups and districts, indicating the need for additional activities to complement routine immunization. Prior to vaccine introduction, we estimated a rubella burden of 96 congenital rubella syndrome cases per 100,000 live births. Residual samples from large-scale surveys can reduce the cost and challenges of conducting serosurveys, and multiple pathogens can be tested. Procedures to access quality specimens, ensure ethical approvals, and link sociodemographic data can improve the timeliness and value of results.


Conflict of interest statement

The authors declare no competing interests.

Figures

Figure 1
Figure 1
Measles seroprevalence. (A) Province seroprevalence. The asterisks represent provinces that had significantly different seroprevalence than the reference province, Northern Province (0.05 alpha level). (B) District seroprevalence. The distribution of district-specific seroprevalence estimates based on a hierarchical spatial model. The left and right vertical lines within each distribution represent the 5th and 95th percentiles. (C) National age-specific seroprevalence. The points represent the data grouped by age in years with the exception of year 0 which includes only individuals 10 and 11 months old and the size of the point is proportional to the number of observations in each age group (seroprevalence estimates for individuals younger than 10 months were collected and are show in Fig. S8). The blue lines represent fitted generalized additive model mean (solid line) and 95% confidence intervals (dashed lines). The age cohorts eligible for vaccination campaigns by campaign year (green boxes) and routine doses of measles-containing vaccine dose 1 (MCV1) and dose 2 (MCV2) (orange boxes) are shown.
Figure 2
Figure 2
Measles age-specific seroprevalence by province. The points represent the data grouped by age in years with the exception of year 0 which includes only individuals 10 and 11 months old and are proportional to the number of individuals in each age in years. The lines represent the generalized additive model mean (solid line) and 95% confidence intervals (dashed lines).
Figure 3
Figure 3
Comparison of two estimates of national age-specific measles immunity profiles. The direct estimate, based on generalized additive models fit to the seroprevalence data, is represented as the solid (mean) and dashed (95% CI) lines. The indirect estimate is based on a birth-cohort method that estimates immunity per birth cohort. Each birth cohort has a unique probability of being successfully vaccinated (dark blue), a probability of being infected (light green), and among infants a probability of being immune through maternally-acquired antibodies (teal). The proportion of the population each age that remains susceptible is shown in red.
Figure 4
Figure 4
Rubella seroprevalence. (A) Province seroprevalence. The asterisks represent provinces that had significantly different seroprevalence than the reference province, Lusaka Province (0.05 alpha level). (B) National age-specific seroprevalence. The points represent the data grouped by age in years with the exception of year 0 which includes only individuals 10 and 11 months old and the size of the point is proportional to the number of observations in each age group (seroprevalence estimates for individuals younger than 10 months was collected and is show in Fig. S8). The blue lines represent fitted generalized additive model mean (solid line) and 95% confidence intervals (dashed lines). Rubella vaccine was not available in the public sector prior to the serosurvey.
Figure 5
Figure 5
Age-specific rubella seroprevalence and CRS rate by province. (A) Rubella age-specific seroprevalence by province. The points represent the data grouped by age in years with the exception of year 0 which includes only individuals 10 and 11 months old and are proportional to the number of individuals in each age in years. The lines represent fitted generalized additive model mean (solid line) and 95% confidence intervals (dashed lines). (B) Provincial age-specific CRS rate (solid line), and national age-specific fertility rate (dashed line). The total provincial CRS rates (labeled in text at the top of each plot) is the weighted average of the age-specific CRS rate by age-specific fertility rate.

Similar articles

Cited by

References

    1. Patel MK. Progress toward regional measles elimination: Worldwide, 2000–2019. MMWR Morb. Mortal. Wkly. Rep. 2020;69:1700. doi: 10.15585/mmwr.mm6945a6. - DOI - PMC - PubMed
    1. Causey K, et al. Estimating global and regional disruptions to routine childhood vaccine coverage during the COVID-19 pandemic in 2020: A modelling study. The Lancet. 2021;398:522–534. doi: 10.1016/S0140-6736(21)01337-4. - DOI - PMC - PubMed
    1. World Health Organization. At Least 80 Million Children Under One at Risk of Diseases Such as Diphtheria, Measles and Polio as COVID-19 Disrupts Routine Vaccination Efforts, Warn Gavi, WHO and UNICEF. https://www.who.int/news/item/22-05-2020-at-least-80-million-children-un... (2020).
    1. World Health Organization . Measles and Rubella Strategic Framework: 2021–2030. World Health Organization; 2020.
    1. Cutts FT, Izurieta HS, Rhoda DA. Measuring coverage in MNCH: Design, implementation, and interpretation challenges associated with tracking vaccination coverage using household surveys. PLoS Med. 2013;10:123. doi: 10.1371/journal.pmed.1001404. - DOI - PMC - PubMed

Publication types