. 2022 Jun 17;13(1):254.
doi: 10.1186/s13287-022-02925-w.

Endothelial and hematopoietic hPSCs differentiation via a hematoendothelial progenitor

Affiliations

Endothelial and hematopoietic hPSCs differentiation via a hematoendothelial progenitor

Alejandra Vargas-Valderrama et al. Stem Cell Res Ther. .

Abstract

Background: hPSC-derived endothelial and hematopoietic cells (ECs and HCs) are an interesting source of cells for tissue engineering. Despite their close spatial and temporal embryonic development, current hPSC differentiation protocols are specialized in only one of these lineages. In this study, we generated a hematoendothelial population that could be further differentiated in vitro to both lineages.

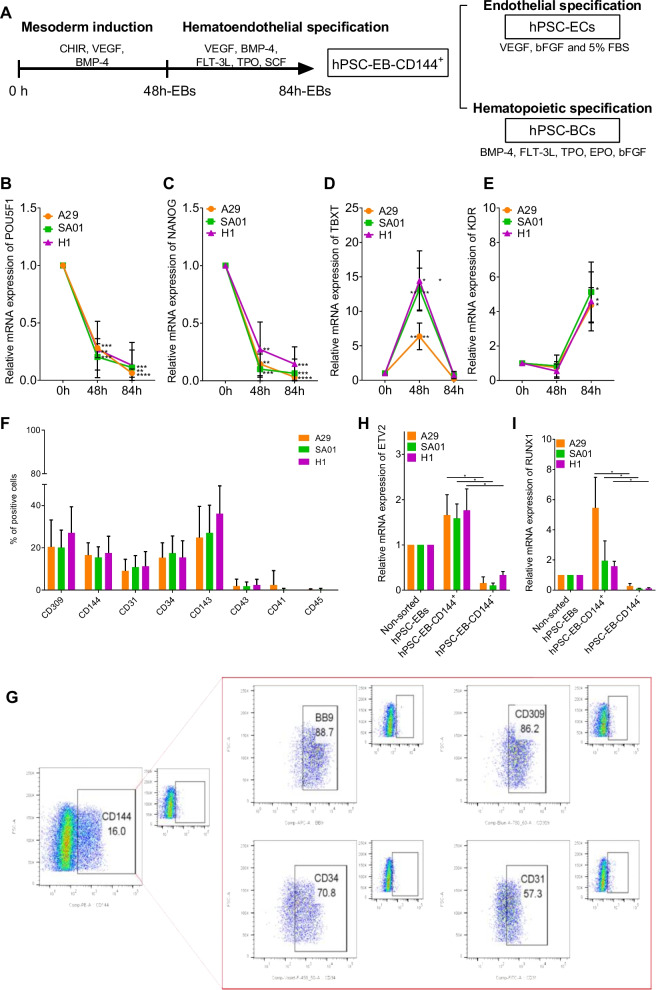
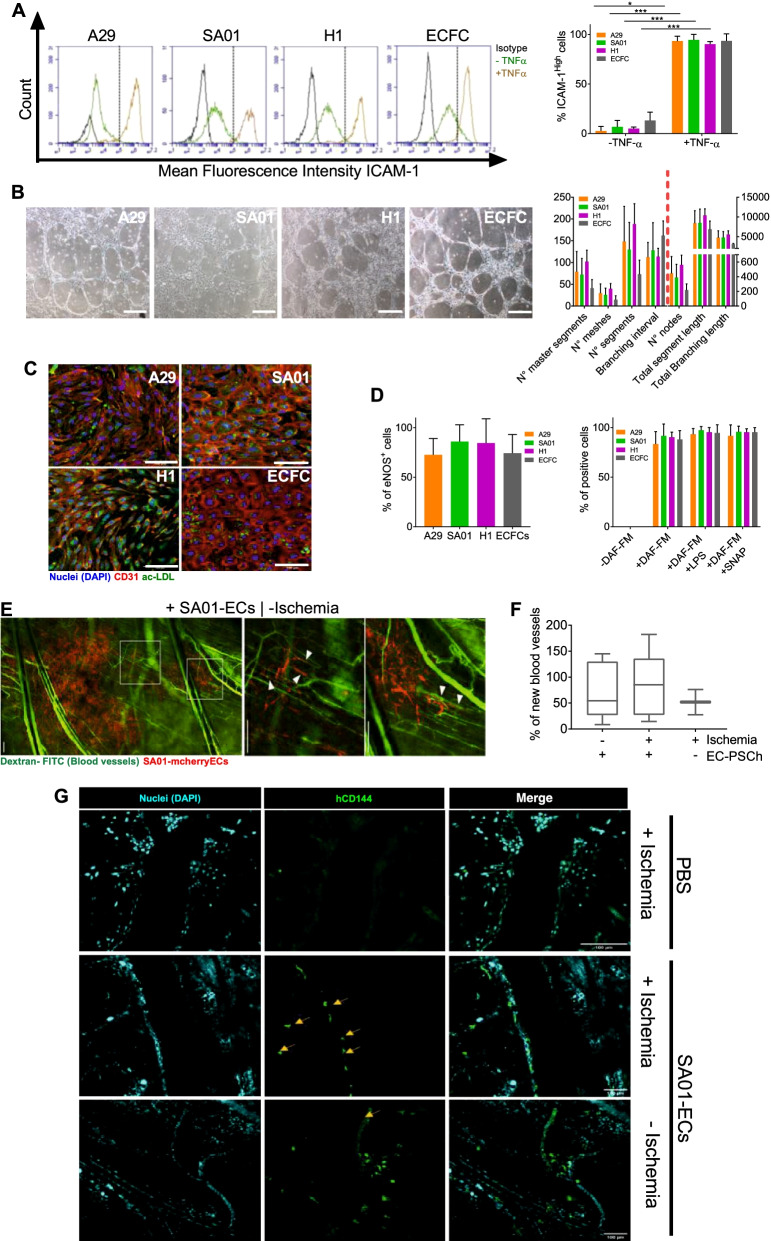
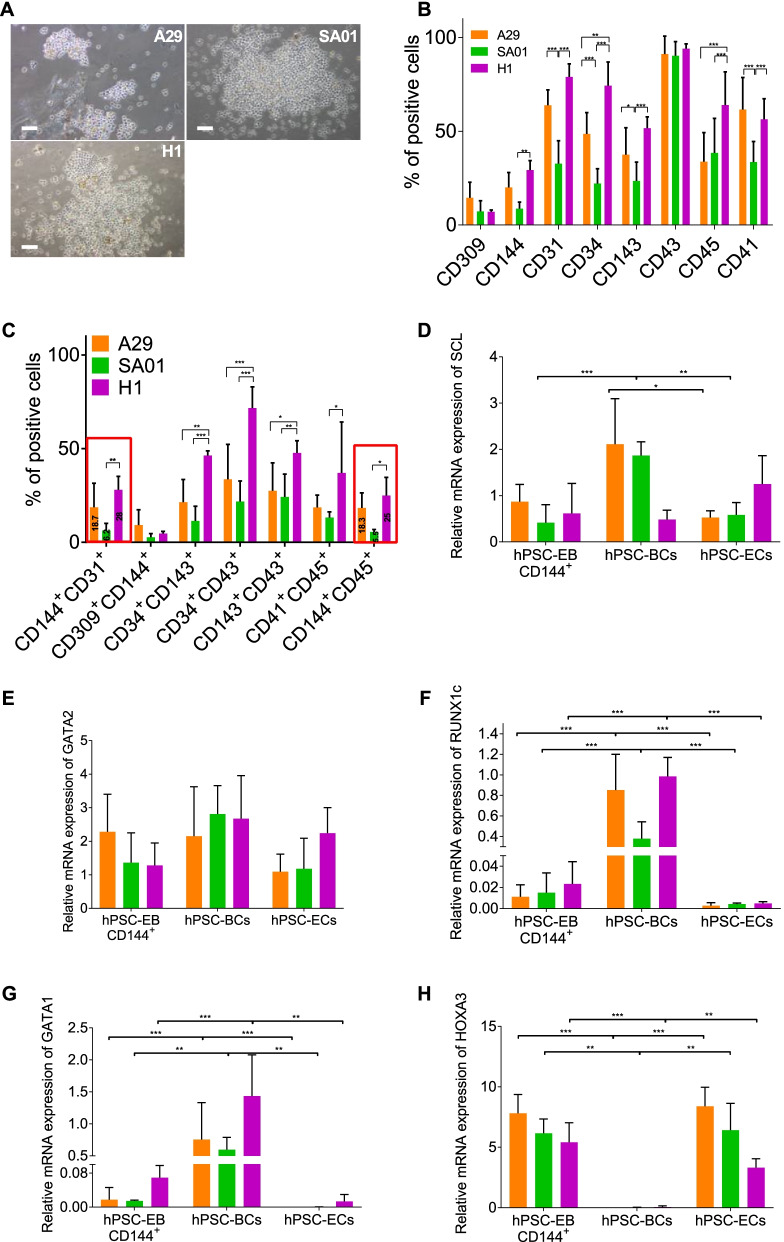
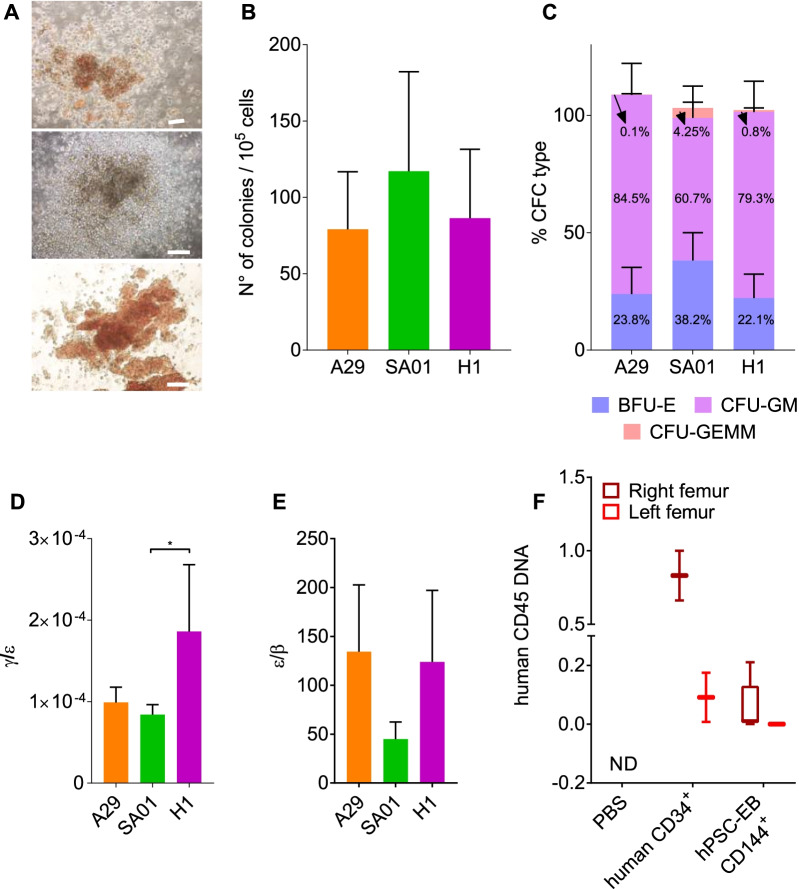
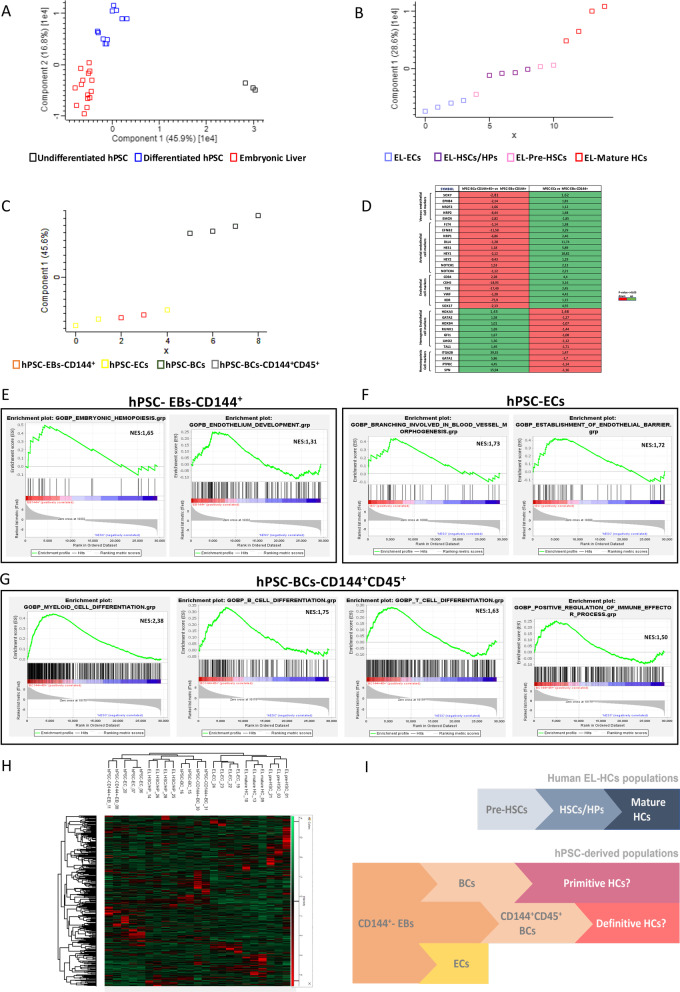
Methods: Two hESCs and one hiPSC lines were differentiated into a hematoendothelial population, hPSC-ECs and blast colonies (hPSC-BCs) via CD144+-embryoid bodies (hPSC-EBs). hPSC-ECs were characterized by endothelial colony-forming assay, LDL uptake assay, endothelial activation by TNF-α, nitric oxide detection and Matrigel-based tube formation. Hematopoietic colony-forming cell assay was performed from hPSC-BCs. Interestingly, we identified a hPSC-BC population characterized by the expression of both CD144 and CD45. hPSC-ECs and hPSC-BCs were analyzed by flow cytometry and RT-qPCR; in vivo experiments have been realized by ischemic tissue injury model on a mouse dorsal skinfold chamber and hematopoietic reconstitution in irradiated immunosuppressed mouse from hPSC-ECs and hPSC-EB-CD144+, respectively. Transcriptomic analyses were performed to confirm the endothelial and hematopoietic identity of hESC-derived cell populations by comparing them against undifferentiated hESC, among each other's (e.g. hPSC-ECs vs. hPSC-EB-CD144+) and against human embryonic liver (EL) endothelial, hematoendothelial and hematopoietic cell subpopulations.

Results: A hematoendothelial population was obtained after 84 h of hPSC-EBs formation under serum-free conditions and isolated based on CD144 expression. Intrafemorally injection of hPSC-EB-CD144+ contributed to the generation of CD45+ human cells in immunodeficient mice suggesting the existence of hemogenic ECs within hPSC-EB-CD144+. Endothelial differentiation of hPSC-EB-CD144+ yields a population of > 95% functional ECs in vitro. hPSC-ECs derived through this protocol participated at the formation of new vessels in vivo in a mouse ischemia model. In vitro, hematopoietic differentiation of hPSC-EB-CD144+ generated an intermediate population of > 90% CD43+ hPSC-BCs capable to generate myeloid and erythroid colonies. Finally, the transcriptomic analyses confirmed the hematoendothelial, endothelial and hematopoietic identity of hPSC-EB-CD144+, hPSC-ECs and hPSC-BCs, respectively, and the similarities between hPSC-BC-CD144+CD45+, a subpopulation of hPSC-BCs, and human EL hematopoietic stem cells/hematopoietic progenitors.

Conclusion: The present work reports a hPSC differentiation protocol into functional hematopoietic and endothelial cells through a hematoendothelial population. Both lineages were proven to display characteristics of physiological human cells, and therefore, they represent an interesting rapid source of cells for future cell therapy and tissue engineering.

Keywords: Endothelial differentiation; Endothelium; Hematopoietic cells; Hematopoietic differentiation; Hemogenic endothelium; hESCs; hPSC; hiPSC.


Conflict of interest statement

The authors declare no competing interests in relation to this study.

Figures

Fig. 1
Fig. 1
hPSC differentiation into a hematoendothelial population. A One hiPSC cell line (A29) and two hESC cell lines (SA01 and H1) were differentiated following embryoid body (EB) formation for 84 h supplied with growth factors inducing mesoderm and hematoendothelial specification. CD144+-sorted cells were differentiated into endothelial and hematopoietic lineage in the presence of specific growth factors. BE EBs were analyzed at 48 h and 84 h by RTqPCR and compared to the hPSCs preceding EB formation (0 h) for the stem cell genes POU5F1 (B) and NANOG (C), the mesoderm gene TBXT (D) and the hematoendothelial gene KDR (E). F At 84 h, EBs were dissociated enzymatically and analyzed by flow cytometry for the expression of hematoendothelial (CD309, CD34 and CD143), endothelial (CD144 and CD31) and hematopoietic markers (CD43, CD41 and CD45), n = 30 for every hPSC cell line and marker. G Representative flow cytometry analysis of CD143, CD309, CD34 and CD31 within the CD144+ population from 84 h-EBs. HI 84 h-EBs were sorted based on the expression of CD144 and analyzed for the expression of the hematoendothelial transcription factors ETV2 (h) and RUNX1 (I) by RTqPCR, n = 5 independent experiments for each cell line. *P value < 0.05; **P value < 0.005, ***P value < 0.0005. Data are represented as mean ± SEM
Fig. 2
Fig. 2
Endothelial differentiation of hPSC-EB-CD144+. A Representative phase-contrast images of endothelial colonies formed from single CD144+ cells at day 0 (left), day 7 (middle) and at day 15 (right). Scale bar 100 µm. B Confocal microscope images of endothelial colonies from the colony-forming assay. hPSC-ECs were labeled against CD31 (green), CD144 (red) and with DAPI for the nuclei (blue). Scale bar 500 µm. C Representative phase-contrast images of endothelial colony-forming cells (ECFC) and hPSC-derived endothelial cells (hPSC-ECs) from CD144+-EBs. Scale bar 500 µm. D Cumulative population doubling (CPD) of hPSC-ECs along passages. E Endothelial phenotype was analyzed along the passages by flow cytometry for hPSC-EC from A29 (left), SA01 (center) and H1 (right) cell lines. hPSC-ECs derived from the three cell lines kept a stable phenotype characterized by the expression of CD309, CD144, CD31, CD34 and CD143 (see also Additional file 2: Fig. S2). The expression of hematopoietic markers was negligible at every passage. F Confocal microscope images of hPSC-ECs and ECFC labeled with antibodies against von Willebrand Factor (vWF, red) and CD31 (green). Nuclei stained with DAPI (blue). Scale bar 500 µm. GI RTqPCR analysis of arterial (NRP1 and EFNB2), venous genes (NRP2, EPHB4 and COUPTFII) and the pan-endothelial gene CDH5 (CD144) in hPSC-ECs after treatment with an antagonist of Notch (DAPT) during the EC differentiation, n = 5 independent experiments for every cell line. *P value < 0.05; **P value < 0.005 and ***P value < 0.0005. Data are represented as mean ± SEM
Fig. 3
Fig. 3
hPSC-EB-CD144+-derived endothelial cells are functional in vitro and in vivo. A Endothelial activation by TNF-α assay. Representative histograms of flow cytometry analysis for ICAM-1 expression in hPSC-ECs and ECFCs (left panel) and quantification of ICAM-1High cells (right panel) in the absence and presence of TNF-α. B Matrigel-based tube formation assay 8 h after seeding. Phase contrast images with scale bar 1000 µm (left panel) and cell network characterization based on the number of segments, meshes, branches and nodes (right panel). C Confocal microscopy images of hPSC-ECs and ECFCs after 4 h of incubation with acLDL-AlexaFluor-488. CD31 in red and nuclei in blue (DAPI). Scale bar 100 µm. D hPSC-ECs nitric oxide (NO) production was analyzed based on the expression of the endothelial nitric oxide synthase (eNOS) measured by flow cytometry (left histogram) and indirectly, by using the probe DAF-FM diacetate to detect NO in hPSC-ECs and ECFCs. DAF-FM fluorescence was measured by flow cytometry in cells that were not incubated with the probe (-DAF-FM) as a negative control, in cells incubated with the probe alone (+ DAF-FM) and in the presence of a S-nitrosothiol molecule (+ DAF-FM + SNAP) or in cells previously stimulated with lipopolysaccharides (+ DAF-FM + LPS), the two latter as positive controls, n = 5 independent experiments for every cell line. E Representative confocal image at day 19 post-injection of a mouse dorsal skinfold chamber without ischemia, injected with mcherry-hPSC-ECs. Vessel perfusion was observed thanks to the injection of dextran 70 kDa-FITC (green). Scale bar: 200 µm. F Percentage of new blood vessels formed at day 19 post-injection. n = 6 independent experiments. G Confocal images of the dorsal chambers analyzed post-mortem by immunofluorescence. Yellow arrows indicate human CD144+ ECs (green) localized at the wall of blood vessels. Scale bar: 100 µm. *P value < 0.05; **P value < 0.005 and ***P value < 0.0005. Data are represented as mean ± SEM
Fig. 4
Fig. 4
Differentiation of hPSC-EB-CD144+ into hPSC-BCs. A Phase-contrast microscopy images of three hPSC-derived blast colonies (hPSC-BCs) A29, SA01 and H1 cell lines. Scale bar 100 µm. B, C Flow cytometry analysis of day 6 hPSC-BCs for hematoendothelial (CD309, CD143 and CD34), endothelial (CD144 and CD31) and hematopoietic markers (CD43, CD45 and CD41) as simple (B) and double labelling (C), n = 15 for every hPSC line and marker. DH Expression of hematopoietic and endothelial transcription factors in CD144+-EBs, hPSC-ECs and hPSC-BCs: SCL (D), GATA2 (E), RUNX1c (F), GATA1 (G) and HOXA3 (H). Data are represented as mean ± SEM, n = 5 independent experiment for each cell line. *P value < 0.05; **P value < 0.005 and ***P value < 0.0005
Fig. 5
Fig. 5
Functional characterization of hematopoiesis. A Phase-contrast microscopy images of myeloid, CFU-GEMM (top image) and CFU-GM (middle image) (image above right), and erythroid colonies, BFU-E (bottom image), derived from hPSC-BCs. Scale bar: 100 µm. B Number of hematopoietic colonies per 105 hPSC-BCs seeded cells in methylcellulose (A29 n = 7, SA01 n = 6 and H1 n = 10). C Percentage of every type of myeloid and erythroid colony per hPSC line. D Ratio of gamma/epsilon and E epsilon/beta hemoglobin expression of the BFU-E and CFU-GEMM derived from hPSCs. F Presence of human DNA in the mouse BM was assessed by qPCR with primers amplifying specifically the human gene CD45. Data are represented as mean ± SEM. For the in vivo experiment: ND: non-detected, n = 2 for CD34+ and PBS and n = 5 for CD144+-EBs. For all the other histograms: n = 5 independent experiments for each cell line. *P value < 0.05; **P value < 0.005 and ***P value < 0.0005
Fig. 6
Fig. 6
Transcriptomic analyses. AC PCA loading plot of the first two principal components distribution of EL (red), differentiated hPSC (blue) and undifferentiated hPSC (black) (A). Distribution of EL-ECs (mauve), EL-HSCs/HPs (purple), EL-Pre-HSCs (pink) and EL-mature HCs (red) (B). Distribution of hPSC-derived populations, hPSC-BCs (blue), hPSC-BC-CD144+ CD45+ (grey), hPSC-EB-CD144+ (orange) and hPSC-ECs (yellow) (C), each square represents one sorted cell population. D Visualizing significant differential level expression of selected genes of hPSC-BC-CD144+CD45+ and hPSC-ECs between hPSC-EB-CD144+ revealing distinct endothelial, hemogenic endothelial and hematopoietic signatures. All fold-changes were calculated with respect to the mean value of hPSC-EB-CD144+. P value ≤ 0.05. EG GSEA curves for the most significantly enriched hematopoietic and endothelial GO biological process in hPSC-EB-CD144+ (E), hPSC-ECs (F) and hPSC-BC-CD144+ CD45+ (G) compared to undifferentiated hPSCs. Enrichment analysis was performed using Gene Set Enrichment Analysis software v4.1.0 and probing the c5.go.bp.v7.4 collection of the Molecular Signatures Database (MSigDB). GO = Gene Ontology; NES = normalized enrichment score. P value ≤ 0.05. H Non-supervised hierarchical clustering of transcript (rows) and samples (columns) based on their distance using Pearson correlation. Color intensity indicates expression levels scaled to the column mean. The heatmap is coded red for increasing and green for decreasing. The colored bar on top indicates how the heat map colors are related to the standard score (z-score), i.e., the deviation from row mean in units of standard deviations above or below the mean. I Model summarizing transcriptomic results where hPSC-EB-CD144+ give rise to hPSC-ECs, hPSC-BCs and hPSC-BC-CD144+CD45+, these two latter containing primitive and definitive hematopoietic progenitors, respectively

References

    1. Thomson JA, Itskovitz-Eldor J, Shapiro SS, Waknitz MA, Swiergiel JJ, Marshall VS, et al. Embryonic stem cell lines derived from human blastocysts. Science. 1998;282(5391):1145–7. Available from http://www.ncbi.nlm.nih.gov/pubmed/9804556. - PubMed
    1. Takahashi K, Tanabe K, Ohnuki M, Narita M, Ichisaka T, Tomoda K, et al. Induction of pluripotent stem cells from adult human fibroblasts by defined factors. Cell. 2007;131(5):861–872. doi: 10.1016/j.cell.2007.11.019. - DOI - PubMed
    1. Yu J, Vodyanik MA, Smuga-Otto K, Antosiewicz-Bourget J, Frane JL, Tian S, et al. Induced pluripotent stem cell lines derived from human somatic cells. Science (80-). 2007 Dec 21;318(5858):1917 LP—1920. Available from http://science.sciencemag.org/content/318/5858/1917.abstract. - PubMed
    1. Weijts B, Yvernogeau L, Robin C. Recent advances in developmental hematopoiesis: diving deeper with new technologies. Front Immunol. 2021;12:4820. doi: 10.3389/fimmu.2021.790379. - DOI - PMC - PubMed
    1. Garcia-Alegria E, Menegatti S, Fadlullah MZH, Menendez P, Lacaud G, Kouskoff V. Early human hemogenic endothelium generates primitive and definitive hematopoiesis in vitro. Stem Cell Rep. 2018 Nov 13 [cited 2022 Mar 9];11(5):1061–74. Available from /pmc/articles/PMC6234921/. - PMC - PubMed

Publication types