

An electrochemical aptasensor with N protein binding aptamer-complementary oligonucleotide as probe for ultra-sensitive detection of COVID-19
- PMID: 35716641
- PMCID: PMC9176179
- DOI: 10.1016/j.bios.2022.114436
An electrochemical aptasensor with N protein binding aptamer-complementary oligonucleotide as probe for ultra-sensitive detection of COVID-19
Abstract
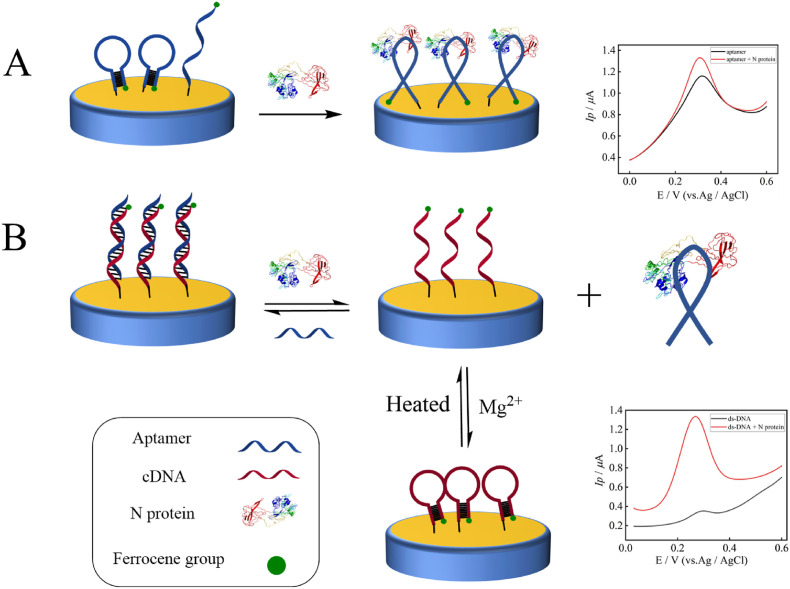
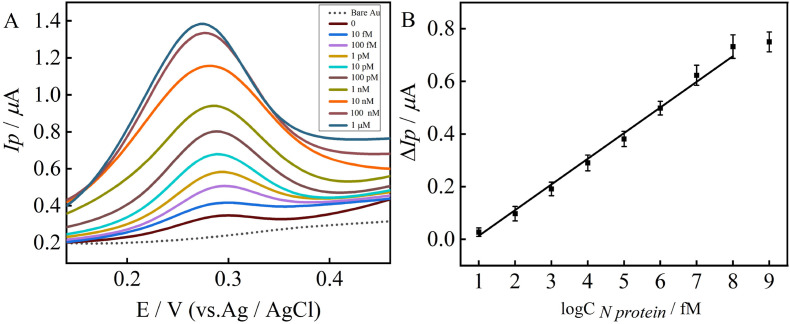
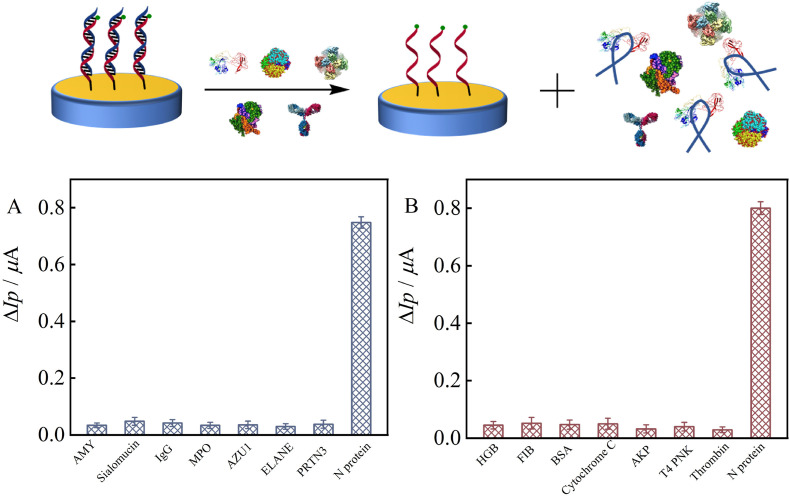
The emergence of the COVID-19 epidemic has affected the lives of hundreds of millions of people globally. There is no doubt that the development of fast and sensitive detection methods is crucial while the worldwide effective vaccination programs are miles away from actualization. In this study, we have reported an electrochemical N protein aptamer sensor with complementary oligonucleotide as probe for the specific detection of COVID-19. The electrochemical aptasensor was prepared by fixing the double-stranded DNA hybrid obtained by the hybridization of N protein aptamer and its Fc-labeled complementary strand on the surface of a gold electrode. After incubation with the target, the aptamer dissociated from the labeled complementary DNA oligonucleotide hybrid to preferentially bind with N protein in the solution. The concentration of N protein was measured by detecting the changes in electrochemical current signals induced by the conformational transformation of the complementary DNA oligonucleotide left on the electrode surface. The sensor had a linear relationship between the logarithm of the N protein concentration from 10 fM to 100 nM (ΔIp = 0.098 log CN protein/fM - 0.08433, R2 = 0.99), and the detection limitation was 1 fM (S/N = 3). The electrochemical aptamer sensor was applied to test the spiked concentrations of throat swabs and blood samples from three volunteers, and the obtained results proved that the sensor has great potentials for the early detection of COVID-19 in patients.
Keywords: Electrochemical aptasensor; N protein detection; Rapid COVID-19 diagnosis; Regenerable aptamer sensor.
Copyright © 2022 Elsevier B.V. All rights reserved.
Conflict of interest statement
The authors declare that they have no known competing financial interests or personal relationships that could have appeared to influence the work reported in this paper.
Figures
Similar articles
-
An electrochemical aptasensor based on PEI-C3N4/AuNWs for determination of chloramphenicol via exonuclease-assisted signal amplification.Mikrochim Acta. 2021 Jan 6;188(1):22. doi: 10.1007/s00604-020-04688-8. Mikrochim Acta. 2021. PMID: 33404928
-
CRISPR/Cas12a-Derived electrochemical aptasensor for ultrasensitive detection of COVID-19 nucleocapsid protein.Biosens Bioelectron. 2022 Mar 15;200:113922. doi: 10.1016/j.bios.2021.113922. Epub 2021 Dec 31. Biosens Bioelectron. 2022. PMID: 34990959
-
Sensitive label-free electrochemical analysis of human IgE using an aptasensor with cDNA amplification.Biosens Bioelectron. 2013 Jan 15;39(1):133-8. doi: 10.1016/j.bios.2012.07.009. Epub 2012 Jul 24. Biosens Bioelectron. 2013. PMID: 22883750
-
Electrochemical aptasensor for sulfadimethoxine detection based on the triggered cleavage activity of nuclease P1 by aptamer-target complex.Talanta. 2019 Nov 1;204:409-414. doi: 10.1016/j.talanta.2019.06.035. Epub 2019 Jun 10. Talanta. 2019. PMID: 31357313
-
Competitive electrochemical aptasensor based on a cDNA-ferrocene/MXene probe for detection of breast cancer marker Mucin1.Anal Chim Acta. 2020 Jan 15;1094:18-25. doi: 10.1016/j.aca.2019.10.003. Epub 2019 Oct 9. Anal Chim Acta. 2020. PMID: 31761044
Cited by
-
Aptamer-Mediated Electrochemical Detection of SARS-CoV-2 Nucleocapsid Protein in Saliva.Biosensors (Basel). 2024 Sep 30;14(10):471. doi: 10.3390/bios14100471. Biosensors (Basel). 2024. PMID: 39451684 Free PMC article.
-
Integration of Power-Free and Self-Contained Microfluidic Chip with Fiber Optic Particle Plasmon Resonance Aptasensor for Rapid Detection of SARS-CoV-2 Nucleocapsid Protein.Biosensors (Basel). 2022 Sep 23;12(10):785. doi: 10.3390/bios12100785. Biosensors (Basel). 2022. PMID: 36290923 Free PMC article.
-
β-Cyclodextrin Polymer-Based Fluorescence Enhancement Strategy via Host-Guest Interaction for Sensitive Assay of SARS-CoV-2.Int J Mol Sci. 2023 Apr 12;24(8):7174. doi: 10.3390/ijms24087174. Int J Mol Sci. 2023. PMID: 37108336 Free PMC article.
-
Aptamer-Gated Mesoporous Silica Nanoparticles for N Protein Triggered Release of Remdesivir and Treatment of Novel Coronavirus (2019-nCoV).Biosensors (Basel). 2022 Nov 1;12(11):950. doi: 10.3390/bios12110950. Biosensors (Basel). 2022. PMID: 36354459 Free PMC article.
-
Aptamer-decorated nanocarriers for viral adsorption: A special look at COVID-19.Mol Ther Nucleic Acids. 2024 Aug 15;35(3):102310. doi: 10.1016/j.omtn.2024.102310. eCollection 2024 Sep 10. Mol Ther Nucleic Acids. 2024. PMID: 39281706 Free PMC article. Review.
References
-
- Dong H., Zhou Q., Zhang L., Tian Y. Angew. Chem. Int. Ed. 2019;58:13948–13953. - PubMed
MeSH terms
Substances
LinkOut - more resources
Full Text Sources
Medical
