. 2022 Jul 5;34(7):1054-1063.e7.
doi: 10.1016/j.cmet.2022.06.002. Epub 2022 Jun 17.

Tanycytes control hypothalamic liraglutide uptake and its anti-obesity actions

Affiliations

Tanycytes control hypothalamic liraglutide uptake and its anti-obesity actions

Monica Imbernon et al. Cell Metab. .

Abstract

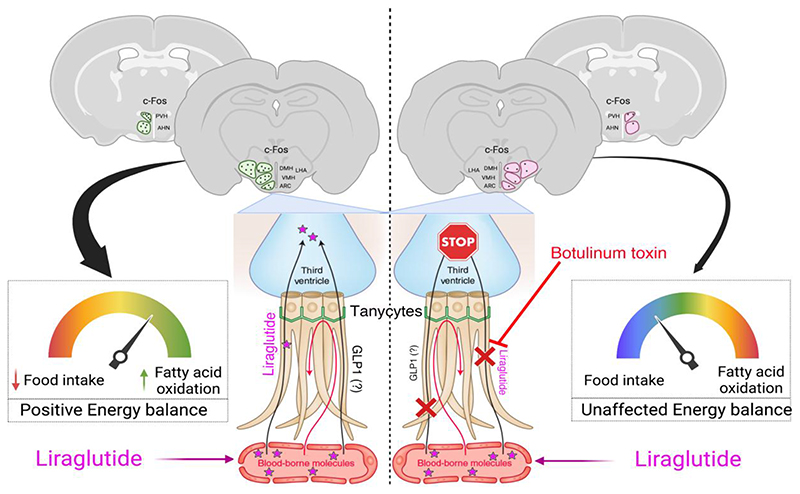
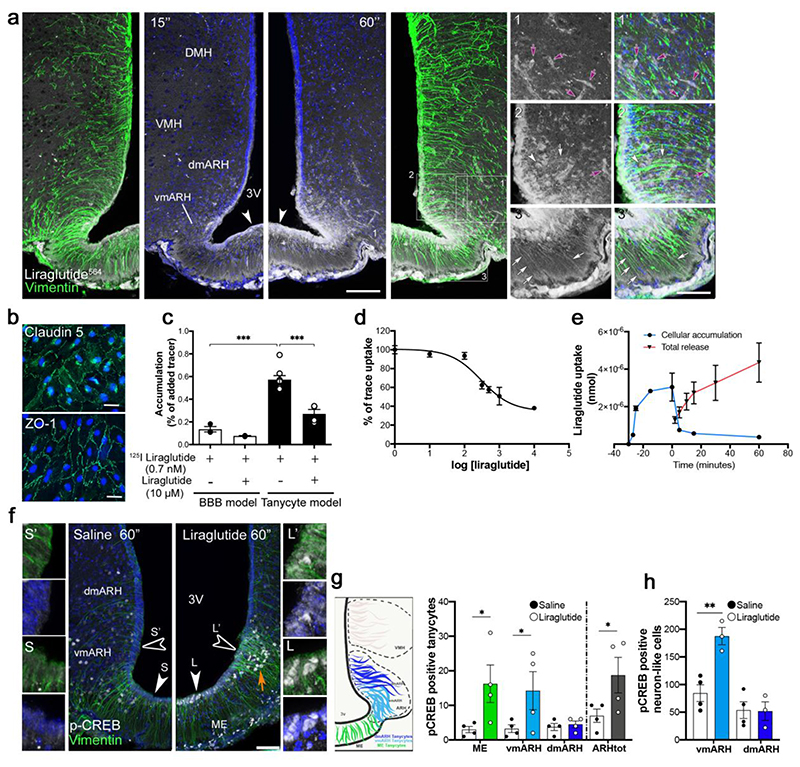
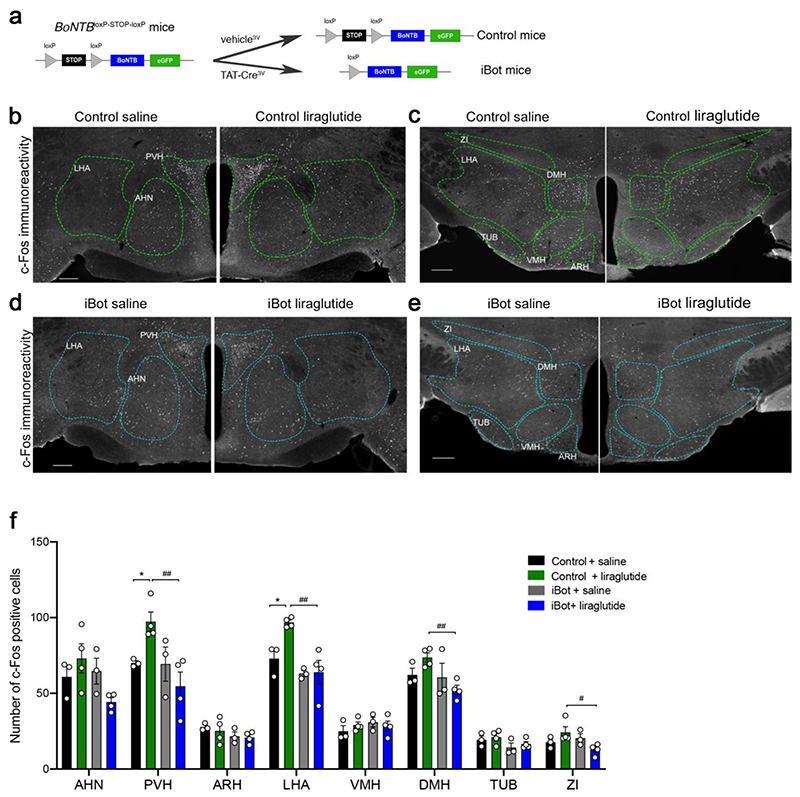
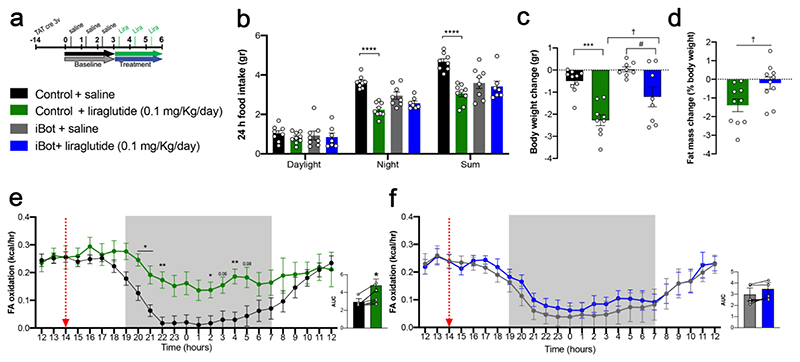
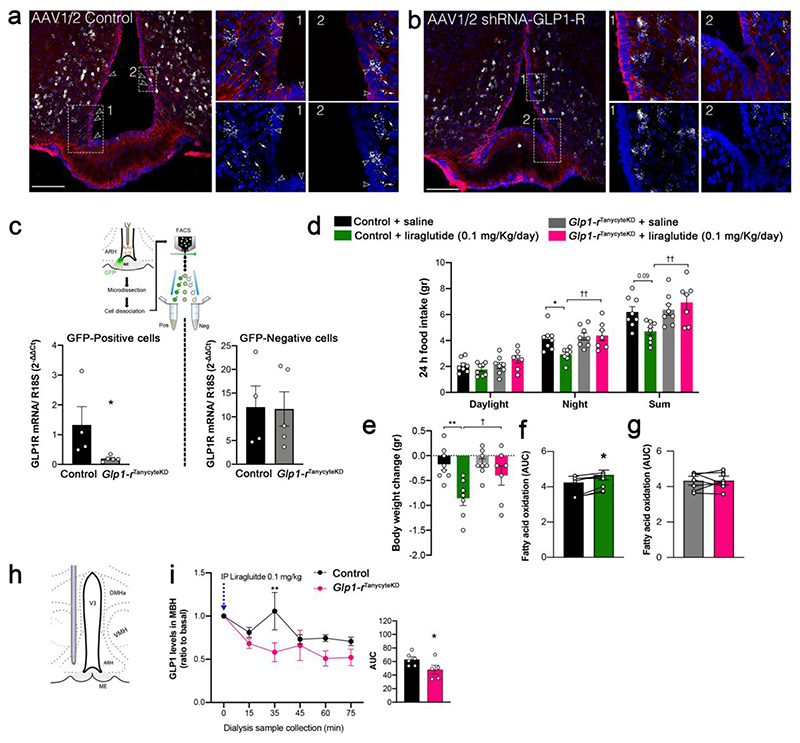
Liraglutide, an anti-diabetic drug and agonist of the glucagon-like peptide one receptor (GLP1R), has recently been approved to treat obesity in individuals with or without type 2 diabetes. Despite its extensive metabolic benefits, the mechanism and site of action of liraglutide remain unclear. Here, we demonstrate that liraglutide is shuttled to target cells in the mouse hypothalamus by specialized ependymoglial cells called tanycytes, bypassing the blood-brain barrier. Selectively silencing GLP1R in tanycytes or inhibiting tanycytic transcytosis by botulinum neurotoxin expression not only hampers liraglutide transport into the brain and its activation of target hypothalamic neurons, but also blocks its anti-obesity effects on food intake, body weight and fat mass, and fatty acid oxidation. Collectively, these striking data indicate that the liraglutide-induced activation of hypothalamic neurons and its downstream metabolic effects are mediated by its tanycytic transport into the mediobasal hypothalamus, strengthening the notion of tanycytes as key regulators of metabolic homeostasis.

Keywords: AAV; GLP1 analog; GLP1R agonist; arcuate nucleus of the hypothalamus; botulinum toxin; brain; fatty acid oxidation; median eminence; tanycyte; weight loss.


Conflict of interest statement

Declaration of interests The authors declare no competing interests.

Figures

None
Graphical abstract
Figure 1
Figure 1. Blood-borne liraglutide does not cross the brain-blood barrier (BBB) at endothelial cells, but is transcytosed by tanycytes and has direct access to putative neurons lying outside the BBB in the ME.
(a) Representative photomicrographs of the tuberal region of the hypothalamus showing tanycytic processes (arrows) and cell bodies (arrowheads) labelled by vimentin (green) and fluorescent liraglutide564 (white), 15 and 60 seconds after intravenous injection (90 nmol/Kg). Note that some neuron-like cell bodies also appear to internalize liraglutide564 (red arrowheads) and that liraglutide564 does not extravasate from BBB vessels (yellow arrows). Scale bar 200 μm. (b) Representative images of immunohistochemical staining for the tight junction markers Claudin-5 (green) and ZO-1 in primary tanycytes. Scale bar 30 μm. (c) Accumulation of 125I liraglutide with or without unlabeled liraglutide, in endothelial cells of the traditional BBB model (white bars) and in tanycytes (black bars). Data were analyzed using one-way ANOVA (F(6, 19) = 8.85; p = 0.0001) followed by Tukey’s multiple comparison test (125I-liraglutide BBB vs. tanycytic model, p < 0.0001; 125I-liraglutide BBB without liraglutide vs. with liraglutide; p < 0.0001) (n = 3, 3, 8, 8 wells from 2 independent experiments). (d) Competition curve of 125I-liraglutide and increasing concentrations (in nM) of unlabeled liraglutide (n = 6, 3, 3, 3, 4, 4, 3 wells from 2 independent experiments). (e) Time-dependent accumulation (blue line) and release (red line) of 125I-liraglutide (cellular accumulation n = 4, 3, 3, 3, 6, 3,3 wells from 2 independent experiments; total release n = 3). (f) Representative photomicrographs showing pCREB in tanycytes and neuron-like cells in the vmARH of mice after treatment with saline (left panel) vs. liraglutide (right panel). Scale bar 150 μm (insets, 50 μm). (g, h) Quantification of pCREB-positive tanycytes (g) and neuron-like cells (h) in the ME, vmARH, dmARH and ARHtot. (n = 4 animals per group; 3 to 4 sections per animal). (g) Data were analyzed using an unpaired t-test (ME saline vs. liraglutide t(6) = 2.40, p=0.0265; vmARH saline vs. liraglutide t(6) = 1.96, p = 0.0491; ARHtot (vmARH + dmARH) saline vs. liraglutide t(6) = 2.15, p = 0.0376). (h) Data were analyzed using an unpaired one-tailed t-test (vmARH saline vs. liraglutide t(5) = 4.66, p = 0.0028). ME, median eminence; ARH, arcuate nucleus of the hypothalamus; vm, ventromedial; dm, dorsomedial; tot, total; VMH, ventromedial nucleus of the hypothalamus; DMH, dorsomedial nucleus; 3V, third ventricle. Data are represented as means ± SEM. *p < 0.05, ** p < 0.01, *** p < 0.001.
Figure 2
Figure 2. Liraglutide-induced c-Fos activation is abolished in the hypothalamus of iBot mice selectively expressing botulinum toxin in tanycytes.
(a) Protocol for Cre-dependent induction of BoNT/B in tanycytes followed by the injection of recombinant TAT-Cre or vehicle into the third ventricle of BoNTB-EGFPloxP-STOP-loxP mice. (b-e) Representative photomicrographs of c-Fos immunohistochemistry in the hypothalamus of control (b, c) and iBot (d, e) mice 1h after intraperitoneal injection of saline (left panels) or liraglutide (90 nmol/Kg, right panels). AHN: anterior hypothalamic nucleus; ARH: arcuate nucleus of the hypothalamus; DMH: dorsomedial hypothalamic nucleus; LHA: lateral hypothalamic nucleus; PVH: paraventricular nucleus of the hypothalamus; TUB: tuberal nucleus; ZI: zona incerta. Scale bar 200 μm. (f) Quantification of the number of c-Fos positive cells in mouse hypothalamic sections 1 hour after intraperitoneal injection of either saline (black, grey) or liraglutide (0,1 mg/kg) (green, blue) in control (black and green) and iBot mice (grey and blue). (n = 3, 4, 3, 4 animals per group; 6 to 7 sections per animal). PVH: two-way ANOVA, genotype: F(1, 10)= 6.96, p = 0.024; treatment: F(1, 10)= 0.586, p = 0.024; interaction: F(1, 10)= 6.502, p = 0.0289. Fisher’s LSD post hoc test, control saline vs. control liraglutide, p = 0.0410 and control liraglutide vs. iBot liraglutide, p = 0.0027. LHA: two-way ANOVA, genotype: F(1, 10)= 15.54, p = 0.0028; treatment: F(1, 10)= 5.19, p = 0.045; interaction: F(1, 10)= 4.468, p = 0.0607. Fisher’s LSD post hoc test, control saline vs. control liraglutide, p = 0.011 and control liraglutide vs. iBot liraglutide, p = 0.0009. DMH: two-way ANOVA, genotype: F(1, 10)= 5.21, p = 0.0456; treatment: F(1, 10)= 0.1, p = 0.756; interaction: F(1, 10)= 3.827, p = 0.078. Fisher’s LSD post hoc test, control liraglutide vs. iBot liraglutide, p = 0.0089. ZI: two-way ANOVA, genotype: F(1, 10)= 2.25, p = 0.164; treatment: F(1, 10)= 0.03, p = 0.871; interaction: F(1, 10)= 6.15, p = 0.032. Fisher’s LSD post hoc test, control liraglutide vs. iBot liraglutide, p = 0.0124. Data are expressed as means ± SEM. *p < 0.05; ** p < 0.01, control saline vs. control liraglutide; # p < 0.05; ## p < 0.01, control liraglutide vs. iBot liraglutide.
Figure 3
Figure 3. The anti-obesity effects of liraglutide are abolished by using Botulinum toxin expression to block vesicular transport in tanycytes.
(a) Experimental setup to measure the metabolic effects of liraglutide (panels b-f). (b) Cumulative food intake in the different light/dark phases 3 days after liraglutide treatment, compared to baseline (Night phase: two-way ANOVA, genotype: F(1, 28)= 1.64, p = 0.210; treatment: F(1, 28)= 42.36, p < 0.0001 interaction: F(1, 28)= 13.69, p = 0.0009. Tukey’s post hoc test, control saline vs. control liraglutide, p <0.0001and iBot saline vs. iBot liraglutide, p = 0.240; sum: two-way ANOVA, genotype: F(1, 28)= 2.63, p = 0.116; treatment: F(1, 28)= 16.59, p = 0.0003 interaction: F(1, 28)= 10.69, p = 0.0029. Tukey’s post hoc test, control saline vs. control liraglutide, p <0.0001and iBot saline vs. iBot liraglutide, p = 0.945) (n = 8, 9, 8, 7 mice). (c) Body weight change after the experiment shown in (a) (two-way ANOVA, genotype: F(1, 31)= 8.98, p = 0.53; treatment: F(1, 31)= 32.85 , p < 0.0001; interaction: F(1, 31)= 1.01, p = 0.324. Tukey’s post hoc test, control saline vs. control liraglutide, p = 0.0001and iBot saline vs. iBot liraglutide, p = 0.0154; control liraglutide vs. iBot liraglutide, p = 0.042) (n = 10, 9, 8, 8 mice). (d) Fat mass change after the experiment shown in (a). Data were analyzed using an unpaired one-tailed t-test (fat mass, t(18) = 2.53, p = 0.0104; body weight change, p = 0.0495) (n = 10, 10 mice). (e, f) Fatty acid oxidation and area under the curve (AUC) in control (e) and iBot (f) animals 3 days after liraglutide injection, compared to saline (n = 8 mice per group). Two-way ANOVA with Tukey’s post hoc test (control saline vs. control liraglutide: 20.00, p = 0.0191; 21.00, p = 0.0311; 22.00, p = 0.0061; 2.00, p = 0.0408; 4.00, p = 0.0066) (n = 9, 8 mice). Red dotted lines indicate liraglutide or vehicle administration. AUC, paired two-tailed t-test t(5) = 3.62 p = 0.0152, n = 6 mice in (e) and t(5) = 2.39, p = 0.0624, n = 6 mice in (f). iBot saline vs. iBot liraglutide, # p < 0.05; † p < 0.05 control liraglutide vs. iBot liraglutide, * p < 0.05, ** p < 0.01, *** p < 0.001, **** p < 0.0001.
Figure 4
Figure 4. Knocking down GLP1R in tanycytes abolishes both the shuttling of blood-borne liraglutide into the hypothalamus and its anti-obesity effects.
(a, b) Representative photomicrographs of the tuberal region of the hypothalamus showing vimentin-immunoreactive tanycytic processes and cell bodies (red) and GLP1R mRNA expression (white dots) after transduction of tanycytes with a control AAV1/2 (a) or an AAV1/2 expressing GLP1R shRNA (b). Empty arrowheads indicate tanycytic cell bodies expressing GLP1R in the vmARH and white arrows point to tanycytic processes where vimentin and Glp1-r transcripts are colocalized. Scale bar: 200 μm. (c) Schematic diagram: sorting of GFP-positive putative tanycytes following AAV1/2 control or AAV1/2 shRNA-GLP1R infusion into the lateral ventricle. Bar graph: expression of GLP1R mRNA in GFP-positive and -negative FACS-sorted cells. Unpaired one-tailed t-test (positive cells; control vs. GLP1RtanycteKD, t(7) = 2.08, p = 0.0377, n = 4, 5 mice). (d) Cumulative food intake during the different light/dark phases 3 days after liraglutide treatment, compared to baseline (Night: two-way ANOVA, genotype: F(1, 27)= 7.88, p = 0.009; treatment: F(1, 27) = 3.59, p = 0.069; interaction: F(1, 27)= 4.72, p = 0.039. Tukey’s post hoc test, control saline vs. control liraglutide, p = 0.033 and Glp1-rTanycyteKD saline vs. Glp1-rTanycyteKD liraglutide, p = 0.99; control liraglutide vs. Glp1-rTanycyteKD liraglutide, p = 0.042. Sum: two-way ANOVA, genotype: F(1, 27)= 7.64, p = 0.010; treatment: F(1, 27)= 1.12 , p = 0.299; interaction: F(1, 27)= 5.48, p = 0.027. Tukey’s post hoc test, control saline vs. control liraglutide, p = 0.09 and Glp1-rTanycyteKD saline vs. Glp1-rTanycyteKD liraglutide, p = 0.809; control liraglutide vs. Glp1-rTanycyteKD liraglutide, p = 0.007; n = 8, 8, 8, 7 mice). (e) Body weight change after the experiment (two-way ANOVA, genotype: F(1, 26)= 3.07, p = 0.091; treatment: F(1, 26)= 11.48 , p = 0.0022 interaction: F(1, 26)= 2.47, p = 0.128. Tukey’s post hoc test, control saline vs. control liraglutide, p = 0.0017and Glp1-rTanycyteKD saline vs. Glp1-rTanycyteKD liraglutide, p = 0.210; control liraglutide vs. Glp1-rTanycyteKD liraglutide, p = 0.031, n = 8, 7, 8, 7 mice). (f, g) AUC of 24h fatty acid oxidation in control (f) and Glp1rtanycyteKD (g) animals 3 days after liraglutide injection, compared to saline (n = 8 mice per group). Paired two-tailed t-test t(6) = 3.62, p=0.011 in f (n = 7 mice) and t(6) = 0.02, p = 0.972 in g (n = 8 mice). (h) Schematic diagram illustrating the implantation of the microdialysis probe in the mediobasal hypothalamus. (i) GLP1 concentrations in the ARH interstitial liquid collected by microdialysis every 15 minutes following i.p. liraglutide (t0 min) injection (0.1 mg/kg) in control (n = 6) and GLP1RtanKO mice (n = 5). Two-way ANOVA followed by a Bonferroni post hoc test, p=0.0088. AUC, one-tailed t-test, t(9) = 2.10, p = 0.0323. Data are expressed as means ± SEM. *p < 0.05; ** p < 0.01, control saline vs. control liraglutide and control vs. Glp1rtanycyteKD;; † p < 0.05 control liraglutide vs. Glp1rtanycyteKD liraglutide.

References

    1. Adams JM, Pei H, Sandoval DA, Seeley RJ, Chang RB, Liberles SD, Olson DP. Liraglutide Modulates Appetite and Body Weight Through Glucagon-Like Peptide 1 Receptor-Expressing Glutamatergic Neurons. Diabetes. 2018;67:1538–1548. - PMC - PubMed
    1. Athauda D, Foltynie T. The glucagon-like peptide 1 (GLP) receptor as a therapeutic target in Parkinson’s disease: mechanisms of action. Drug Discovery Today. 2016;21:802–818. - PubMed
    1. Balland E, Dam J, Langlet F, Caron E, Steculorum S, Messina A, Rasika S, Falluel-Morel A, Anouar Y, Dehouck B, et al. Hypothalamic tanycytes are an ERK-gated conduit for leptin into the brain. Cell Metab. 2014;19:293–301. - PMC - PubMed
    1. Banks WA. The blood-brain barrier as an endocrine tissue. Nature reviews Endocrinology. 2019;15:444–455. - PubMed
    1. Beiroa D, Imbernon M, Gallego R, Senra A, Herranz D, Villarroya F, Serrano M, Fernø J, Salvador J, Escalada J, et al. GLP-1 agonism stimulates brown adipose tissue thermogenesis and browning through hypothalamic AMPK. Diabetes. 2014;63:3346–3358. - PubMed

Publication types