

Low bone mass and impaired fracture healing in mouse models of Trisomy21 (Down syndrome)
- PMID: 35716916
- PMCID: PMC9356441
- DOI: 10.1016/j.bone.2022.116471
Low bone mass and impaired fracture healing in mouse models of Trisomy21 (Down syndrome)
Abstract
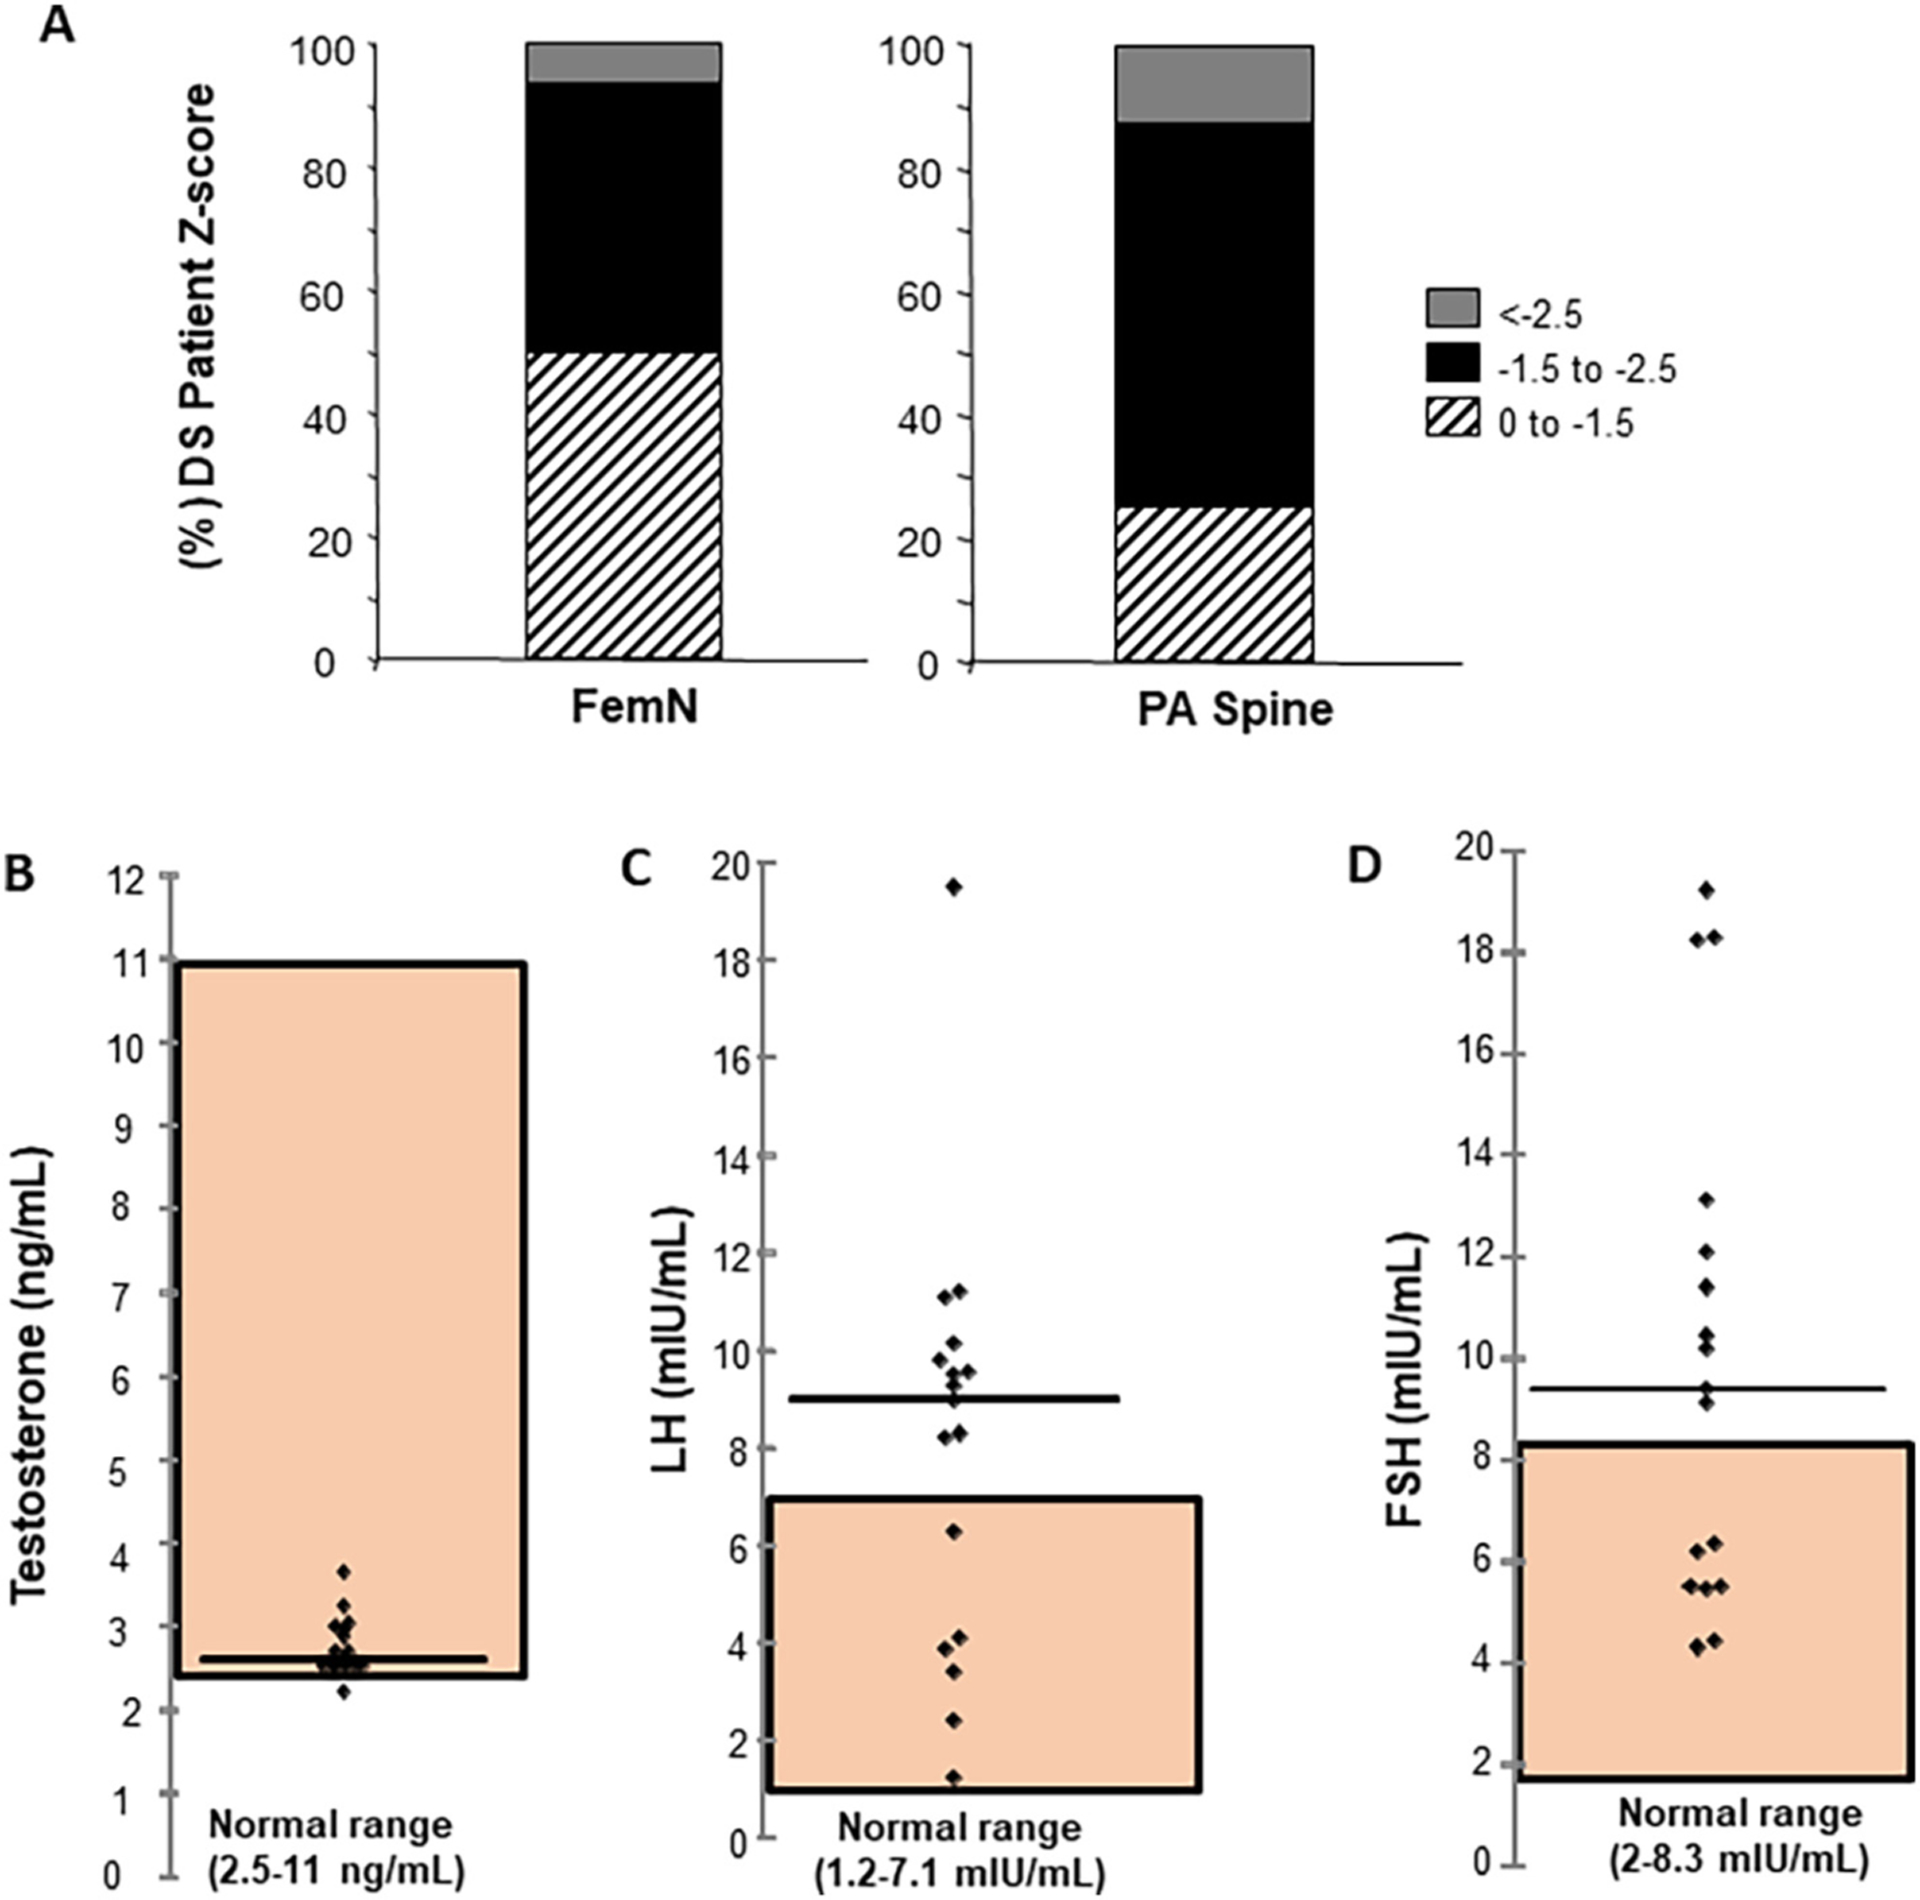
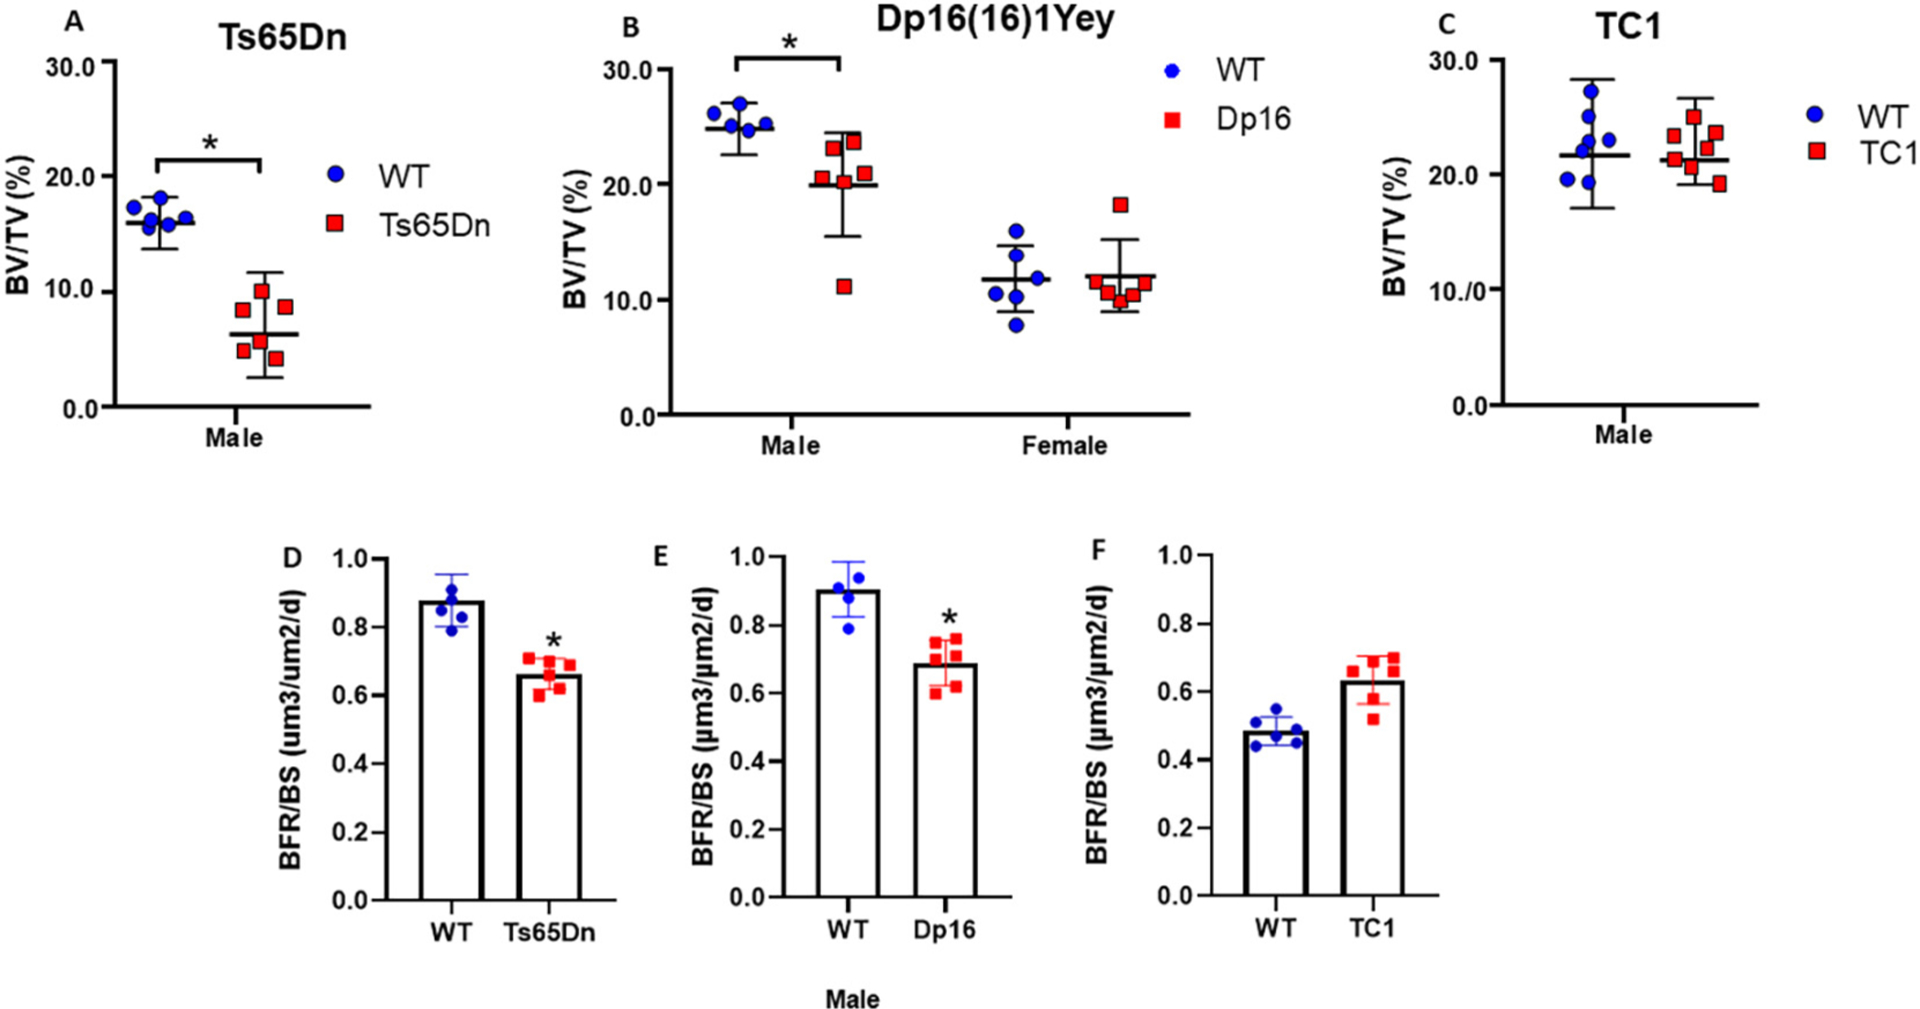
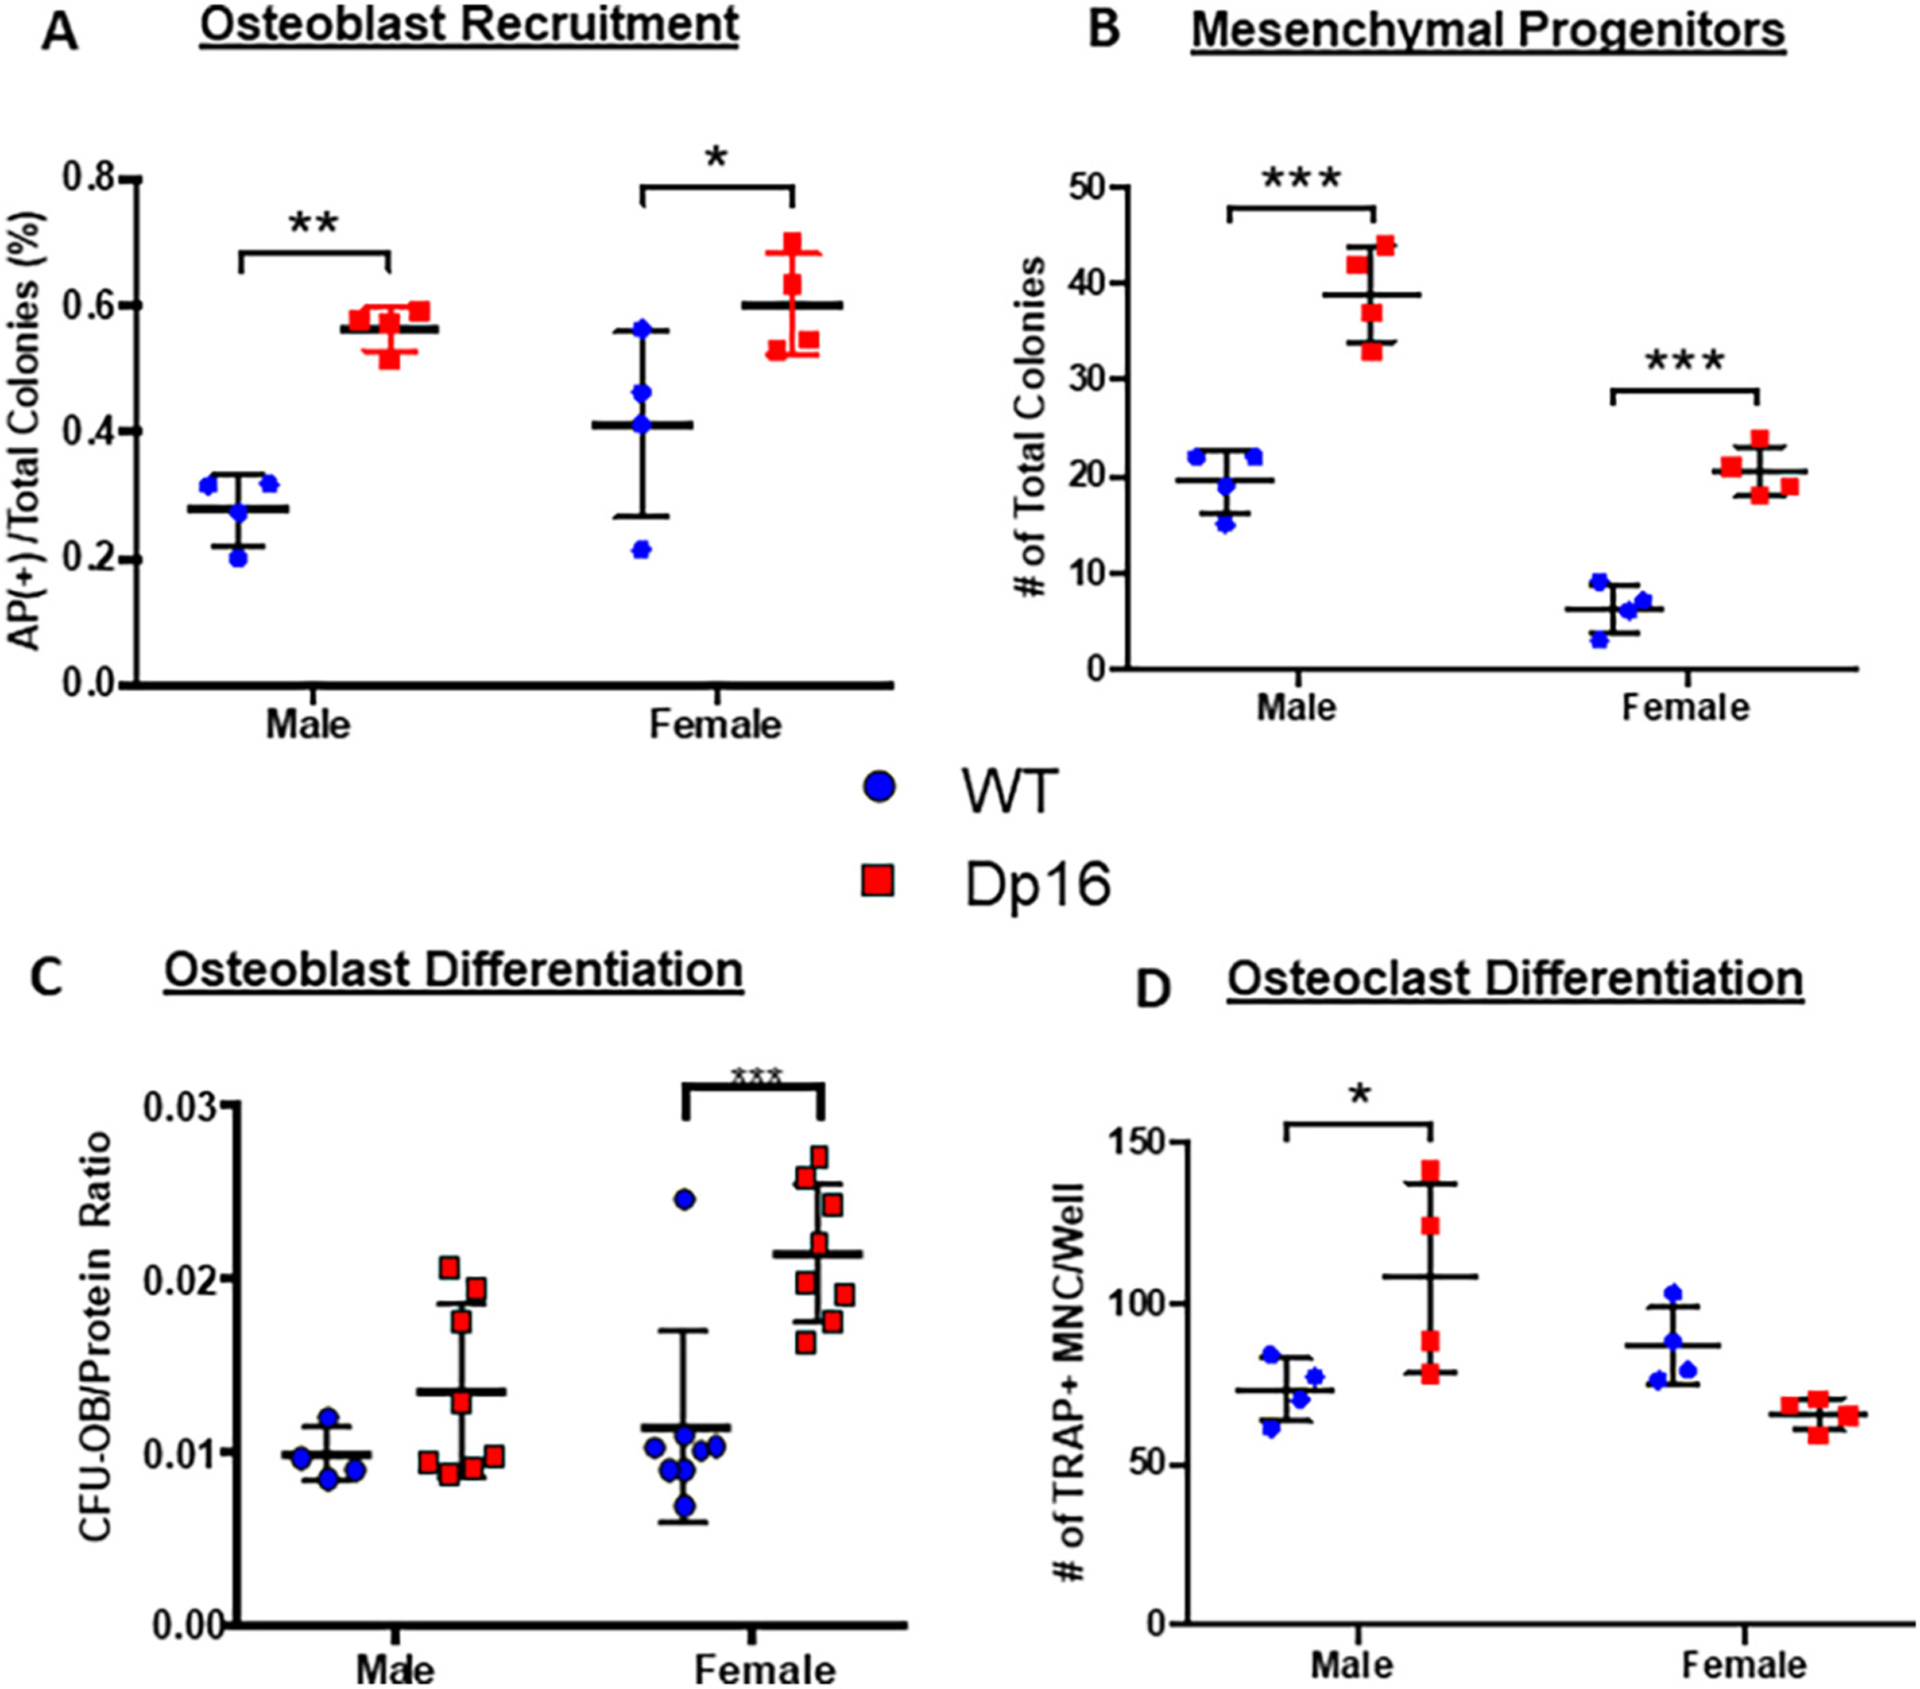
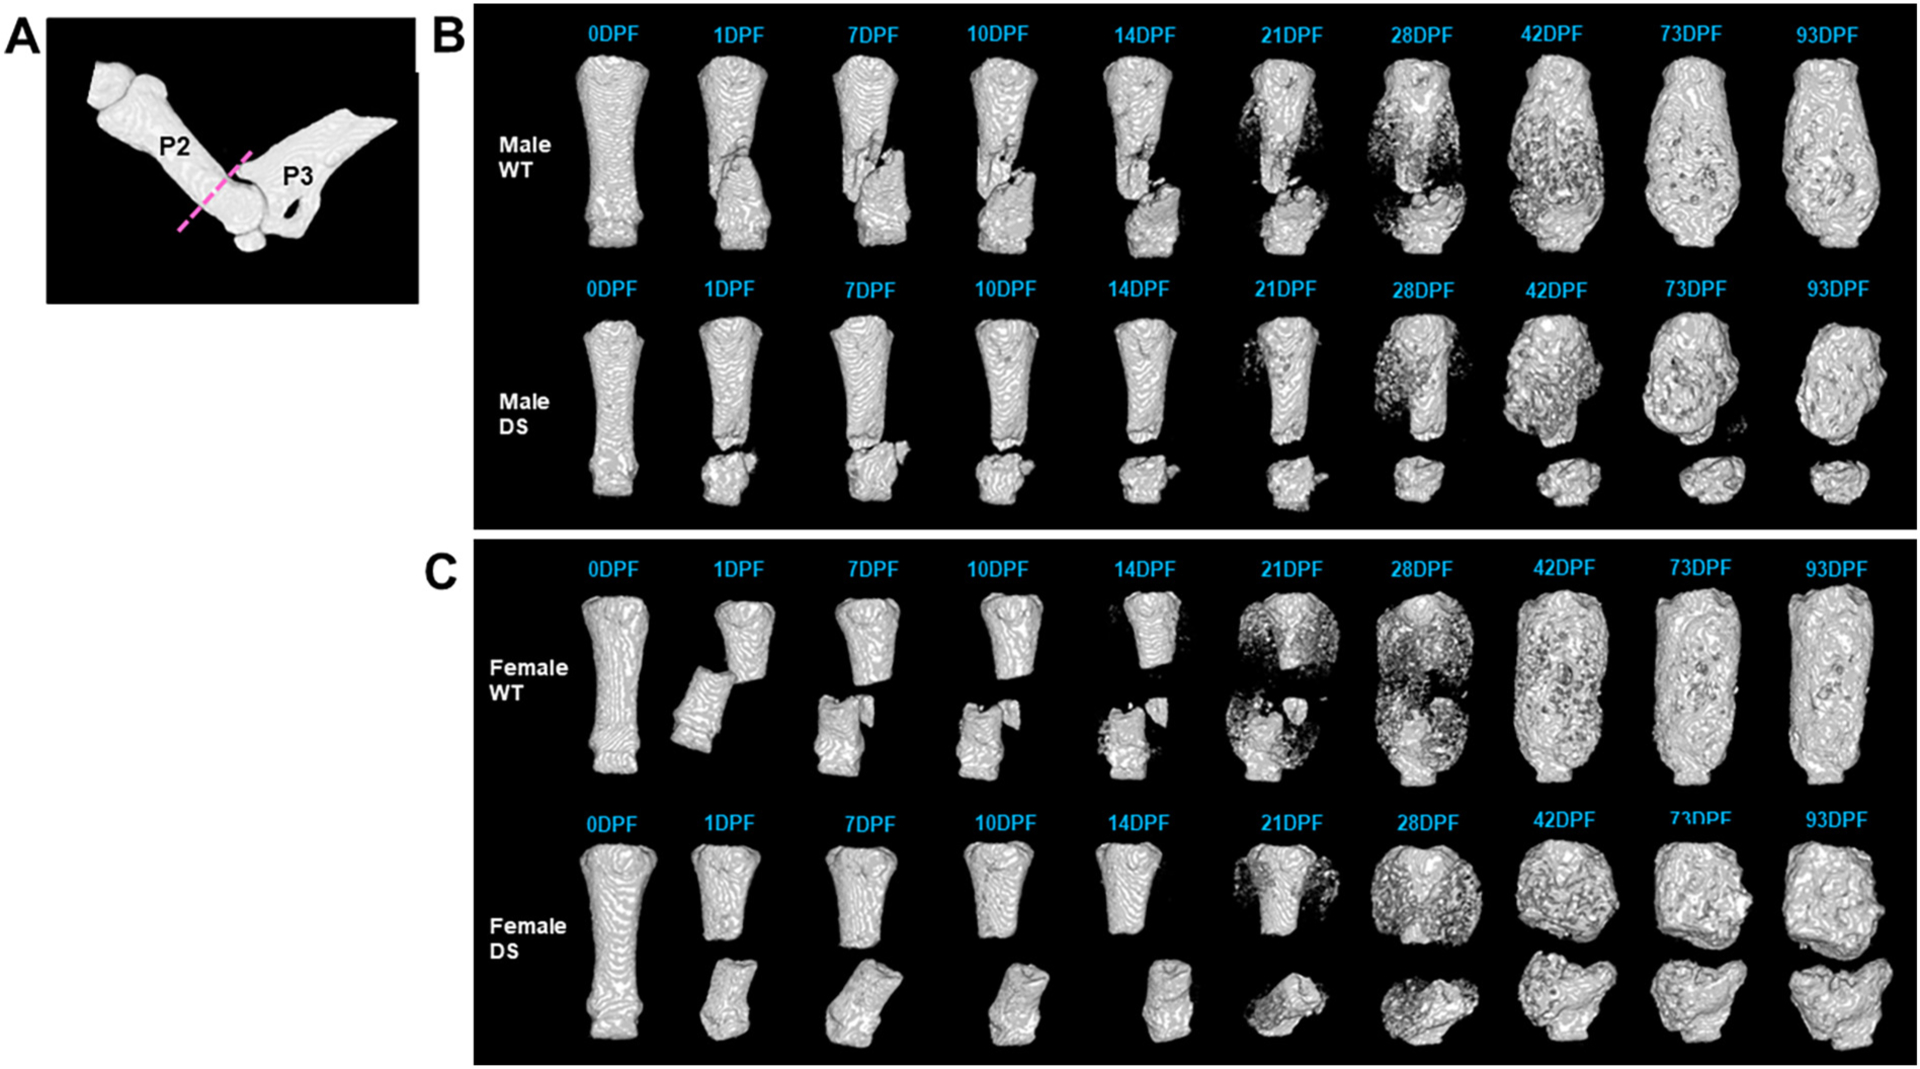
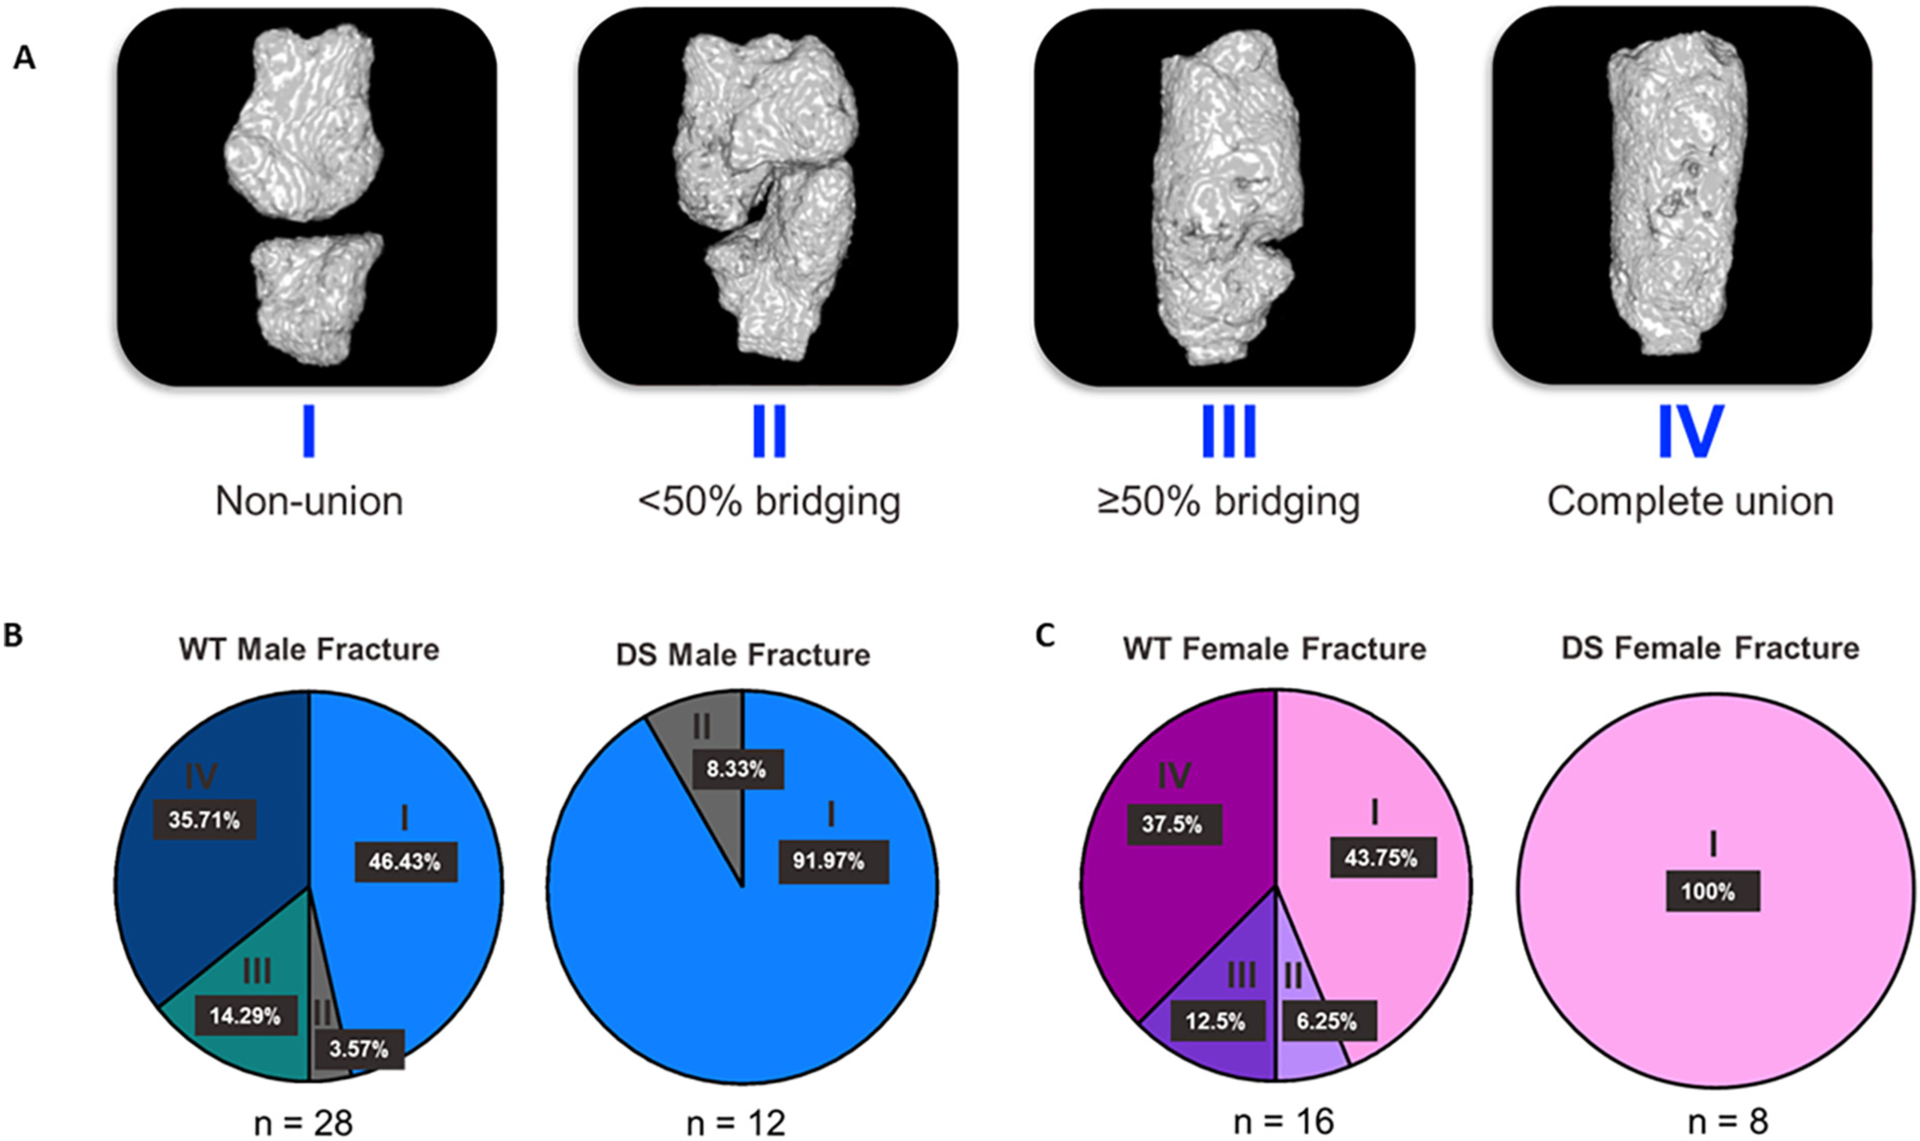
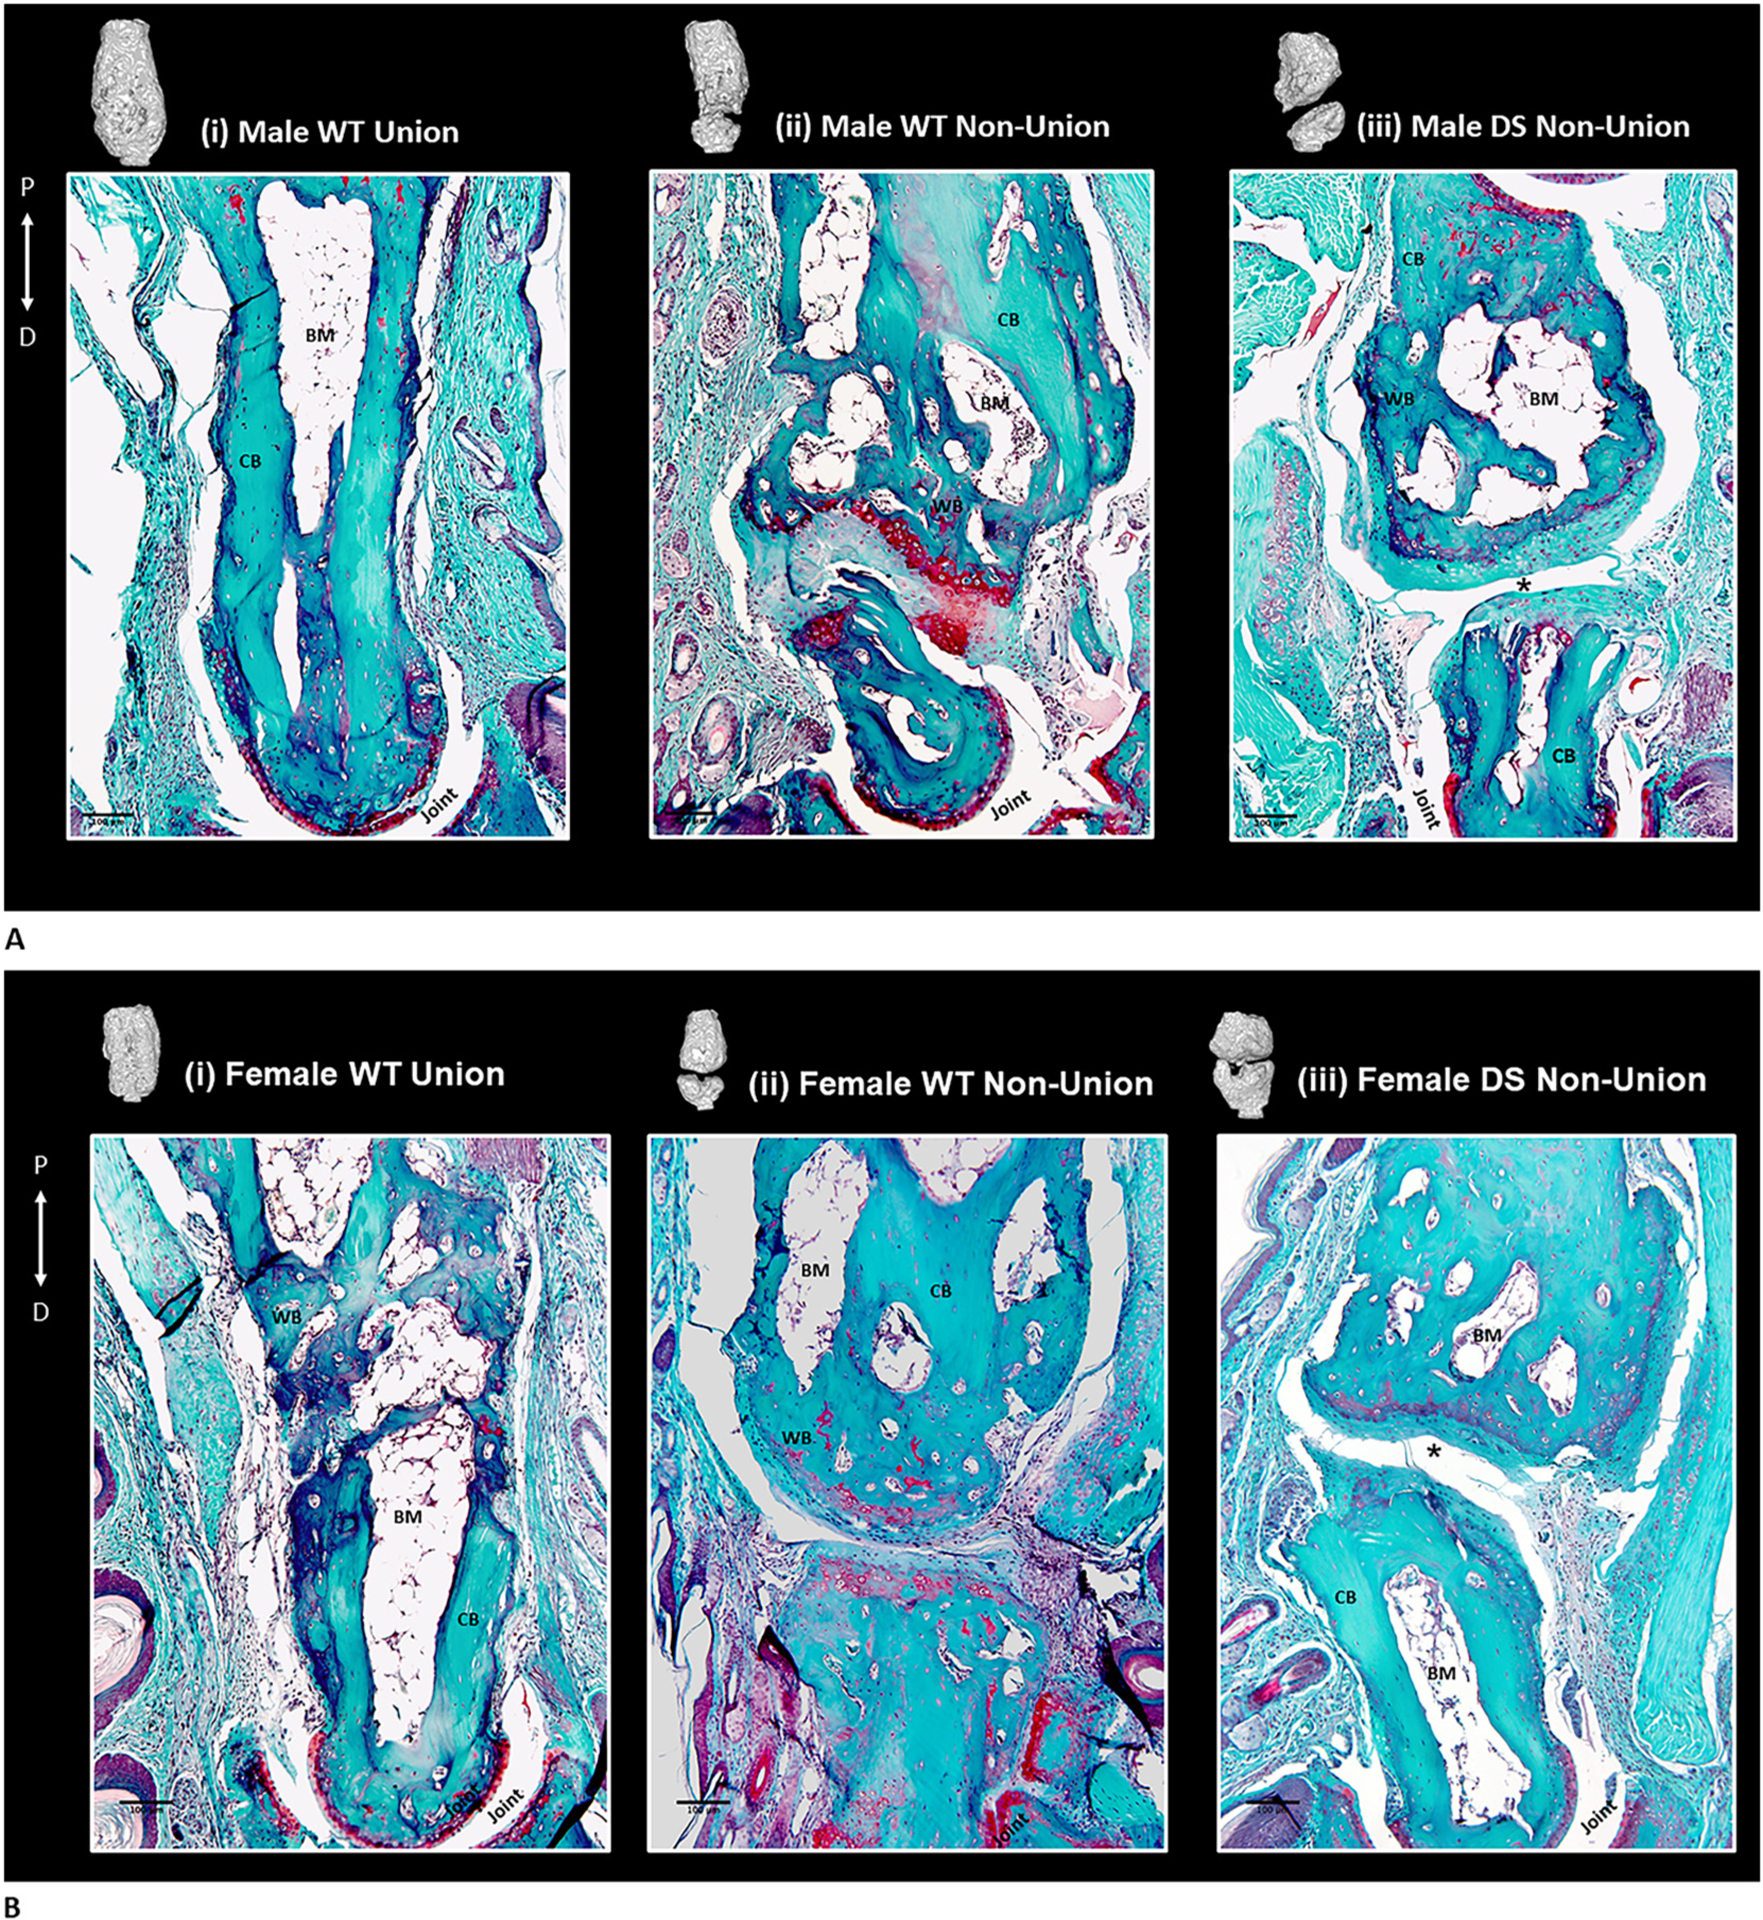
Individuals with Down syndrome (DS), the result of trisomy of human chromosome Hsa21 (Ts21), present with an array of skeletal abnormalities typified by altered craniofacial features, short stature and low bone mineral density (BMD). While bone deficits progress with age in both sexes, low bone mass is more pronounced in DS men than women and osteopenia appears earlier. In the current study, the reproductive hormone status (FSH, LH, testosterone) of 17 DS patients (males, ages range 19-52 years) was measured. Although testosterone was consistently low, the hypothalamic-pituitary-gonadal axis was intact with corresponding rises in FSH and LH. To provide further insight into the heterogeneity of the bone mass in DS, the skeletal phenotypes of three of the most used murine DS models, Ts65Dn (Ts65), TC1, and Dp16(Yey1) (Dp16) were characterized and contrasted. Evaluation of the bone phenotype of both male and female 3-month-old Dp16 mice demonstrated sexual dimorphism, with low bone mass apparent in males, as it is in Ts65, but not in female Dp16. In contrast, male TC1 mice had no apparent bone phenotype. To determine whether low bone mass in DS impacted fracture healing, fractures of the middle phalanx (P2) digits were generated in both male and female Dp16 mice at 15 weeks of age, an age where the sexually dimorphic low BMD persisted. Fracture healing was assessed via in vivo microCT over (13 weeks) 93 days post fracture (DPF). At 93 DPF, 0 % of DS male (n = 12) or female (n = 8) fractures healed, compared to 50 % of the male (n = 28) or female (n = 8) WT littermate fractures. MicroCT revealed periosteal unbridged mineralized callus formation across the fracture gap in Dp16 mice, which was confirmed by subsequent histology. These studies provide the first direct evidence of significantly impaired fracture healing in the setting of DS.
Keywords: Down syndrome; Fracture healing; Genetic mouse models; Osteopenia; Skeletal abnormalities.
Copyright © 2022 Elsevier Inc. All rights reserved.
Conflict of interest statement
Declaration of competing interest
The authors have declared that no conflict of interest exists.
Figures
Similar articles
-
Male Down syndrome Ts65Dn mice have impaired bone regeneration.Bone. 2025 Mar;192:117374. doi: 10.1016/j.bone.2024.117374. Epub 2024 Dec 13. Bone. 2025. PMID: 39675408 Free PMC article.
-
Skeletal Deficits in Male and Female down Syndrome Model Mice Arise Independent of Normalized Dyrk1a Expression in Osteoblasts.Genes (Basel). 2021 Oct 28;12(11):1729. doi: 10.3390/genes12111729. Genes (Basel). 2021. PMID: 34828335 Free PMC article.
-
Interaction of sexual dimorphism and gene dosage imbalance in skeletal deficits associated with Down syndrome.Bone. 2020 Jul;136:115367. doi: 10.1016/j.bone.2020.115367. Epub 2020 Apr 17. Bone. 2020. PMID: 32305495 Free PMC article.
-
Current Analysis of Skeletal Phenotypes in Down Syndrome.Curr Osteoporos Rep. 2021 Jun;19(3):338-346. doi: 10.1007/s11914-021-00674-y. Epub 2021 Apr 8. Curr Osteoporos Rep. 2021. PMID: 33830429 Free PMC article. Review.
-
Skeletal dynamics of Down syndrome: A developing perspective.Bone. 2020 Apr;133:115215. doi: 10.1016/j.bone.2019.115215. Epub 2019 Dec 27. Bone. 2020. PMID: 31887437 Free PMC article. Review.
Cited by
-
Sex-specific trisomic Dyrk1a-related skeletal phenotypes during development in a Down syndrome model.Dis Model Mech. 2024 Sep 1;17(9):dmm050914. doi: 10.1242/dmm.050914. Epub 2024 Sep 23. Dis Model Mech. 2024. PMID: 39136051 Free PMC article.
-
The aetiology of atypical bone health in individuals with Down syndrome.Arch Osteoporos. 2023 Nov 24;18(1):140. doi: 10.1007/s11657-023-01348-1. Arch Osteoporos. 2023. PMID: 37996656 Review.
-
Male Down syndrome Ts65Dn mice have impaired bone regeneration.Bone. 2025 Mar;192:117374. doi: 10.1016/j.bone.2024.117374. Epub 2024 Dec 13. Bone. 2025. PMID: 39675408 Free PMC article.
-
Dissection of a Down syndrome-associated trisomy to separate the gene dosage-dependent and -independent effects of an extra chromosome.Hum Mol Genet. 2023 Jun 19;32(13):2205-2218. doi: 10.1093/hmg/ddad056. Hum Mol Genet. 2023. PMID: 37014740 Free PMC article.
-
Oxidation of Hydrogen Sulfide to Polysulfide and Thiosulfate by a Carbon Nanozyme: Therapeutic Implications with an Emphasis on Down Syndrome.Adv Mater. 2024 Mar;36(10):e2211241. doi: 10.1002/adma.202211241. Epub 2023 Jul 23. Adv Mater. 2024. PMID: 37272655 Free PMC article.
References
-
- Hawli Y, Nasrallah M, El-hajj fuleihan G, endocrine and musculoskeletal abnormalities in patients with down syndrome, Nat. Rev 5 (6) (2009) 327–334. - PubMed
-
- Bull MJ, Down syndrome N. Engl. J. Med 382 (24) (2020) 2344–2352. - PubMed
-
- Glasson EJ, Sullivan SG, Hussain R, Petterson BA, Montgomery PD, Bittles AH, The changing survival profile of people with Down’s syndrome: implications for genetic counselling, Clin. Genet 62 (5) (2002) 390–393. - PubMed
-
- Coppus AM, Evenhuis HM, Verberne GJ, Visser FE, Oostra BA, Eikelenboom P, van Gool WA, Janssens AC, van Duijn CM, Survival in elderly persons with down syndrome, J. Am. Geriatr. Soc 56 (12) (2008) 2311–2316. - PubMed
Publication types
MeSH terms
Substances
Grants and funding
LinkOut - more resources
Full Text Sources
Medical
Molecular Biology Databases
Miscellaneous
