. 2022 Jun 18;22(1):556.
doi: 10.1186/s12879-022-07490-4.

The contribution of hospital-acquired infections to the COVID-19 epidemic in England in the first half of 2020

Collaborators, Affiliations

The contribution of hospital-acquired infections to the COVID-19 epidemic in England in the first half of 2020

Gwenan M Knight et al. BMC Infect Dis. .

Abstract

Background: SARS-CoV-2 is known to transmit in hospital settings, but the contribution of infections acquired in hospitals to the epidemic at a national scale is unknown.

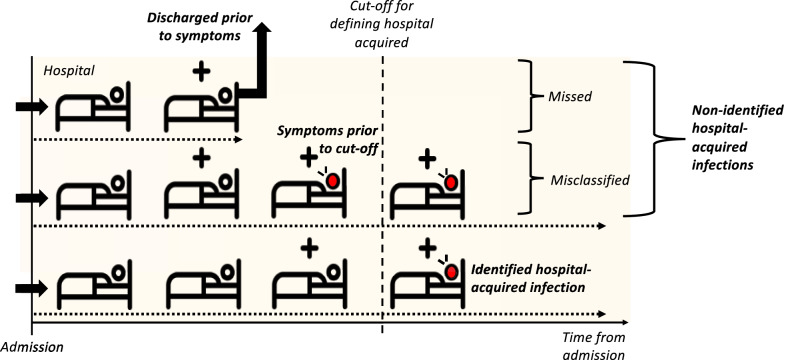
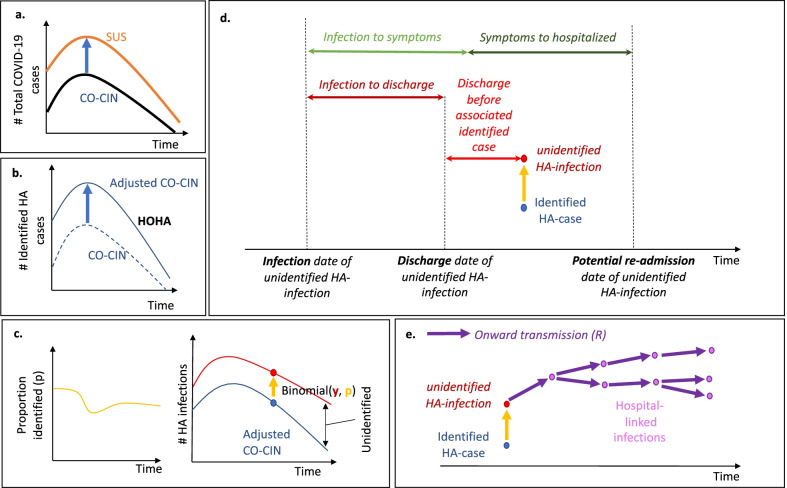
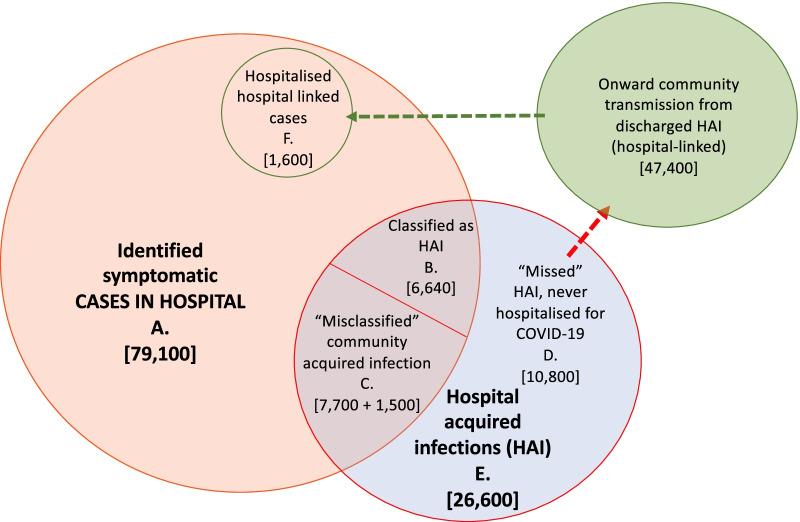
Methods: We used comprehensive national English datasets to determine the number of COVID-19 patients with identified hospital-acquired infections (with symptom onset > 7 days after admission and before discharge) in acute English hospitals up to August 2020. As patients may leave the hospital prior to detection of infection or have rapid symptom onset, we combined measures of the length of stay and the incubation period distribution to estimate how many hospital-acquired infections may have been missed. We used simulations to estimate the total number (identified and unidentified) of symptomatic hospital-acquired infections, as well as infections due to onward community transmission from missed hospital-acquired infections, to 31st July 2020.

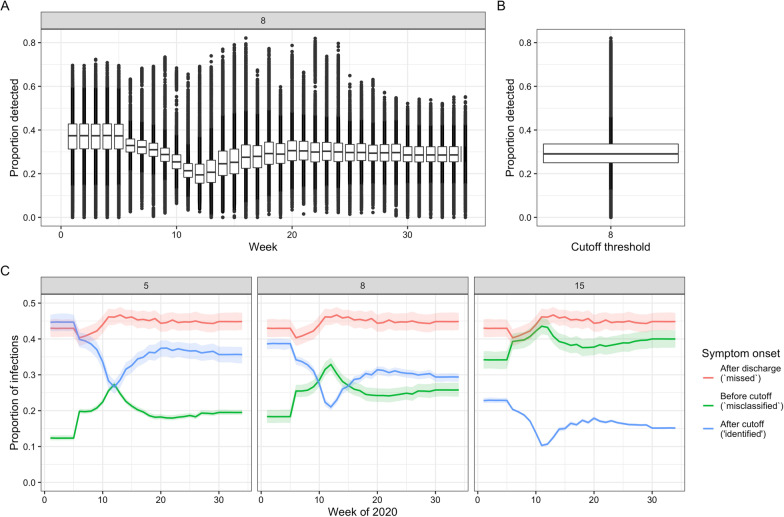
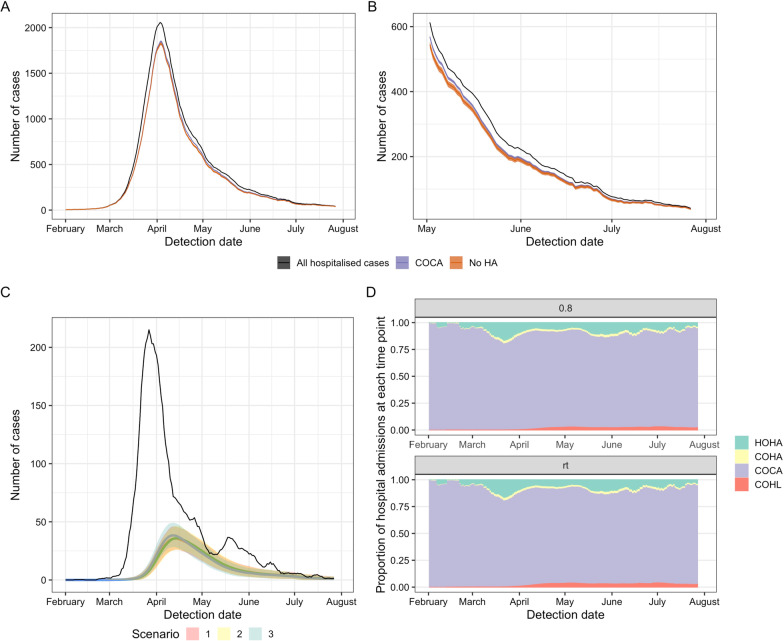
Results: In our dataset of hospitalised COVID-19 patients in acute English hospitals with a recorded symptom onset date (n = 65,028), 7% were classified as hospital-acquired. We estimated that only 30% (range across weeks and 200 simulations: 20-41%) of symptomatic hospital-acquired infections would be identified, with up to 15% (mean, 95% range over 200 simulations: 14.1-15.8%) of cases currently classified as community-acquired COVID-19 potentially linked to hospital transmission. We estimated that 26,600 (25,900 to 27,700) individuals acquired a symptomatic SARS-CoV-2 infection in an acute Trust in England before 31st July 2020, resulting in 15,900 (15,200-16,400) or 20.1% (19.2-20.7%) of all identified hospitalised COVID-19 cases.

Conclusions: Transmission of SARS-CoV-2 to hospitalised patients likely caused approximately a fifth of identified cases of hospitalised COVID-19 in the "first wave" in England, but less than 1% of all infections in England. Using time to symptom onset from admission for inpatients as a detection method likely misses a substantial proportion (> 60%) of hospital-acquired infections.

Keywords: COVID-19; Mathematical modelling; Nosocomial transmission; SARS-CoV-2.


Conflict of interest statement

The authors declare that they have no competing interests.

Figures

Fig. 1
Fig. 1
How might we underestimate hospital-acquired (HA) infections? With no asymptomatic screening in hospitals, detection of a hospital-acquired case relies on symptom onset prior to patient discharge. In the schematic a “+” above the bed denotes a hospital-acquired infection, and a red patient denotes one with symptoms. A patient with COVID-19 identified as being due to a hospital-acquired infection is one with symptom onset after a defined cut-off (e.g. > 7 days from admission to symptom onset but prior to discharge, bottom row patient). Patients with unidentified hospital-acquired infections are those with a symptom onset after discharge (top row patient, “missed”) or those with symptom onset prior to the defined cut-off (middle row patient, “misclassified”). We focus on symptomatic infection: there will also be unidentified asymptomatic hospital-acquired infection which we do not include. We estimate that fewer than 1% of individuals with symptom onset > 7 days from admission will have been infected in the community
Fig. 2
Fig. 2
The analysis steps: a CO-CIN is inflated to match total COVID-19 hospitalised cases in SUS. b The same weekly adjustment is used to estimate the number of identified hospital-onset, hospital-acquired (HOHA) cases. c The length of stay for non-COVID-19 hospital patients and incubation period distribution is used to generate estimates of the proportion of hospital-acquired infections that would be identified (Fig. 1). This proportion (p) is used to estimate how many unidentified hospital-acquired infections there would be for each identified hospital-onset hospital-acquired infection by assuming a Binomial distribution and calculating the number of “trials” or “unidentified” hospital-acquired infections there were. d The unidentified hospital-acquired infections with symptom onset after discharge (“missed”) may return to hospital as a COVID-19 case: the trajectory of their disease is calculated to determine their contribution to hospitalised cases. e These “missed” unidentified hospital-acquired infections are assumed to contribute to onward transmission in the community: here we capture four generations of transmission to estimate the number of hospital-linked infections and subsequent hospitalised cases under different R estimates
Fig. 3
Fig. 3
Proportion of symptomatic hospital-acquired infections identified, given by week (A) and over all weeks (B) at a 7 day cut-off, for all acute English Trusts. Each datapoint is the value from a single Trust for each of 200 samples. The boxplot highlights the median and 25th–75th quantile. C For England (the aggregate setting) the proportion of patients with hospital acquired infections split by those that are identified (blue) due to a symptom onset starting at a set number of days from admission (grey box) and before discharge, and those unidentified with symptom onset after discharge (“missed”, red) or before the cut-off (“misclassified”, green). The coloured lines represent the mean, and the shaded areas the 95% percentiles over the 200 samples
Fig. 4
Fig. 4
A Total COVID-19 admissions with model adjusted definitions from “community-onset, community-acquired” (COCA) for Scenario 1 for the whole study period (January–31st July 2020) and B for the end of the study period (May–31st July 2020). The counterfactual of no hospital transmission (“No HA”, orange) is compared to the adjusted model estimate of COCA (purple) and total admissions (black) for a time-varying R estimate. C The number of hospital-onset, hospital-acquired (HOHA) cases (black) is similar in magnitude to the number of community-onset hospital-linked (coloured lines, COHL) under the three scenarios for hospital admission after symptom onset. D The proportion of all hospital admissions in England that were estimated to be HOHA (green), community-onset, hospital-acquired (COHA, yellow), COCA (purple) and COHL (red) under two example R values (constant: 0.8 and time-varying “rt”) and Scenario 1. All outputs take a threshold cut-off value for defining hospital-acquired as a symptom onset more than 7 days from admission. All outputs are the rolling 7-day mean for the mean over 200 simulations with 5–95% ranges in shaded areas in C
Fig. 5
Fig. 5
Summary figure of estimated values for patients with hospital-acquired symptomatic infections and onward community transmission with a 7 day cut-off for symptom onset after admission and prior to discharge for defining a patient with hospital-acquired infection. Note here that the “misclassified” (C) includes those “missed” unidentified infections that return to hospital later as a hospitalised COVID-19 case (1500 “community-onset, hospital-acquired” cases)

Update of

References

    1. Timeline: WHO’s COVID-19 response. 2021. https://www.who.int/emergencies/diseases/novel-coronavirus-2019/interact.... Accessed 30 Mar 2021.
    1. Chowell G, Abdirizak F, Lee S, Lee J, Jung E, Nishiura H, et al. Transmission characteristics of MERS and SARS in the healthcare setting: a comparative study. BMC Med. 2015;13(1):210. doi: 10.1186/s12916-015-0450-0. - DOI - PMC - PubMed
    1. Rickman HM, Rampling T, Shaw K, Martinez-Garcia G, Hail L, Coen P, et al. Nosocomial transmission of coronavirus disease 2019: a retrospective study of 66 hospital-acquired cases in a London teaching hospital. Clin Infect Dis. 2020 doi: 10.1093/cid/ciaa816/5860253. - DOI - PMC - PubMed
    1. Wang D, Hu B, Hu C, Zhu F, Liu X, Zhang J, et al. Clinical characteristics of 138 hospitalized patients with 2019 novel coronavirus-infected pneumonia in Wuhan, China. JAMA. 2020;323(11):1061–1069. doi: 10.1001/jama.2020.1585. - DOI - PMC - PubMed
    1. Zhou Q, Gao Y, Wang X, Liu R, Du P, Wang X, et al. Nosocomial infections among patients with COVID-19, SARS and MERS: a rapid review and meta-analysis. Ann Transl Med. 2020;8(10):629. doi: 10.21037/atm-20-3324. - DOI - PMC - PubMed