. 2022 Jun 18;21(1):132.
doi: 10.1186/s12943-022-01597-7.

Comprehensive characterization of the prostate tumor microenvironment identifies CXCR4/CXCL12 crosstalk as a novel antiangiogenic therapeutic target in prostate cancer

Affiliations

Comprehensive characterization of the prostate tumor microenvironment identifies CXCR4/CXCL12 crosstalk as a novel antiangiogenic therapeutic target in prostate cancer

Isabel Heidegger et al. Mol Cancer. .

Abstract

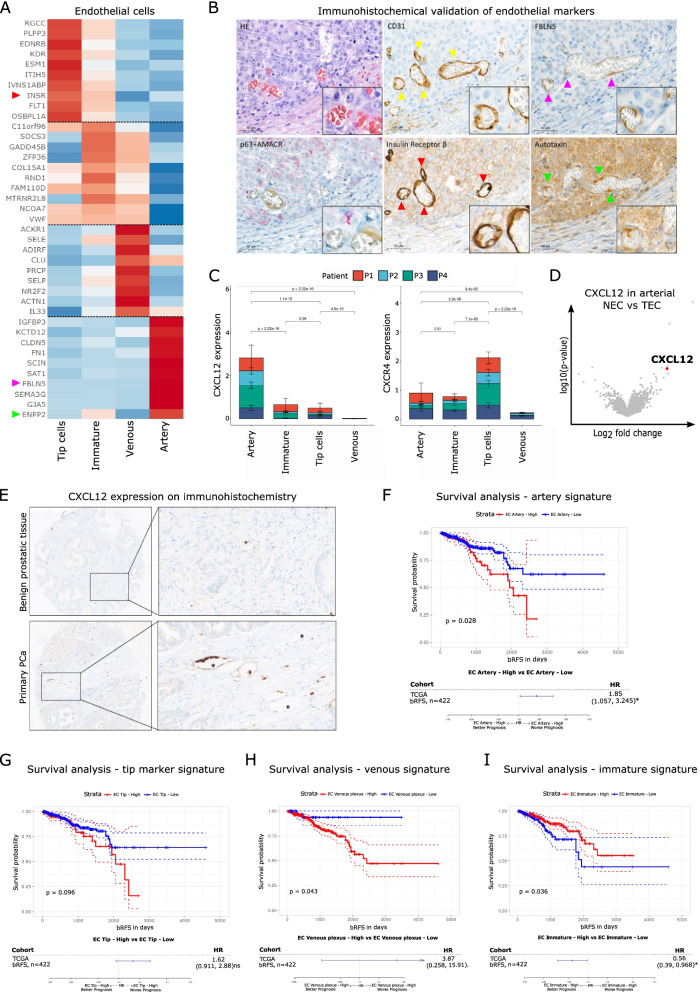
Background: Crosstalk between neoplastic and stromal cells fosters prostate cancer (PCa) progression and dissemination. Insight in cell-to-cell communication networks provides new therapeutic avenues to mold processes that contribute to PCa tumor microenvironment (TME) alterations. Here we performed a detailed characterization of PCa tumor endothelial cells (TEC) to delineate intercellular crosstalk between TEC and the PCa TME.

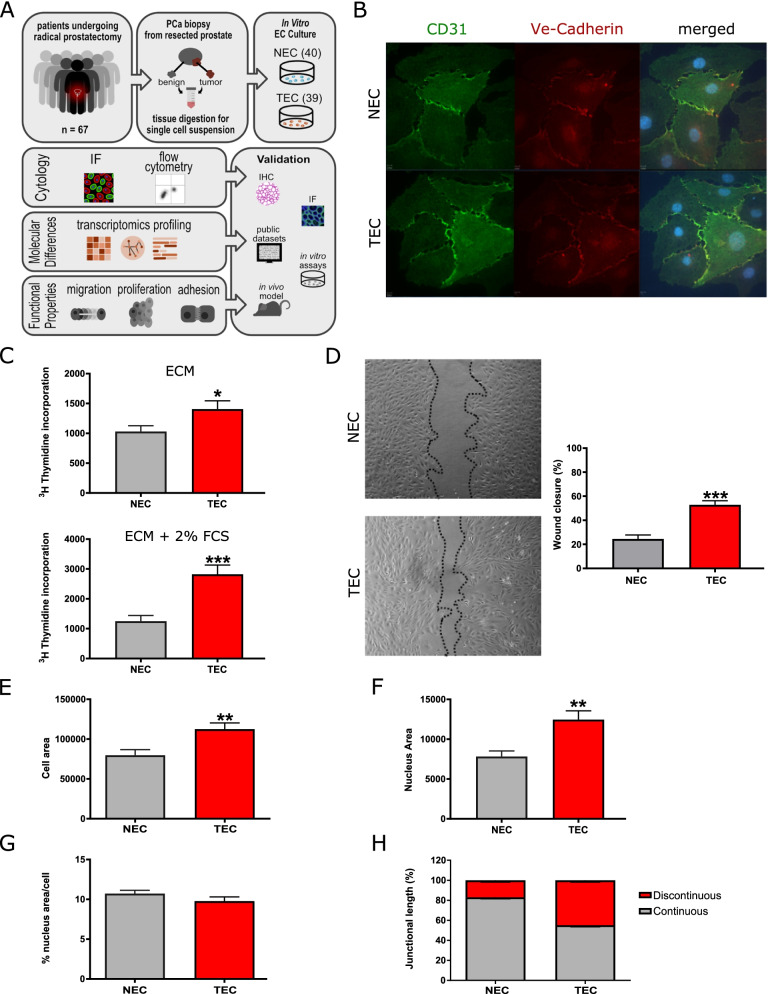
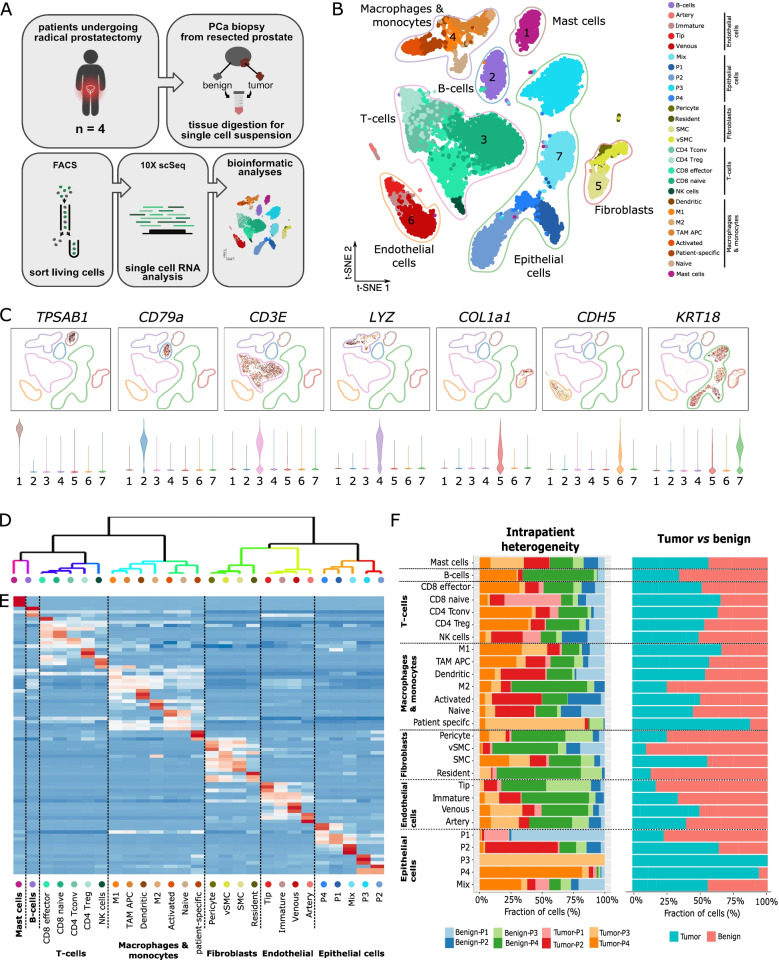
Methods: TEC isolated from 67 fresh radical prostatectomy (RP) specimens underwent multi-omic ex vivo characterization as well as orthogonal validation of both TEC functions and key markers by immunohistochemistry (IHC) and immunofluorescence (IF). To identify cell-cell interaction targets in TEC, we performed single-cell RNA sequencing (scRNA-seq) in four PCa patients who underwent a RP to catalogue cellular TME composition. Targets were cross-validated using IHC, publicly available datasets, cell culture expriments as well as a PCa xenograft mouse model.

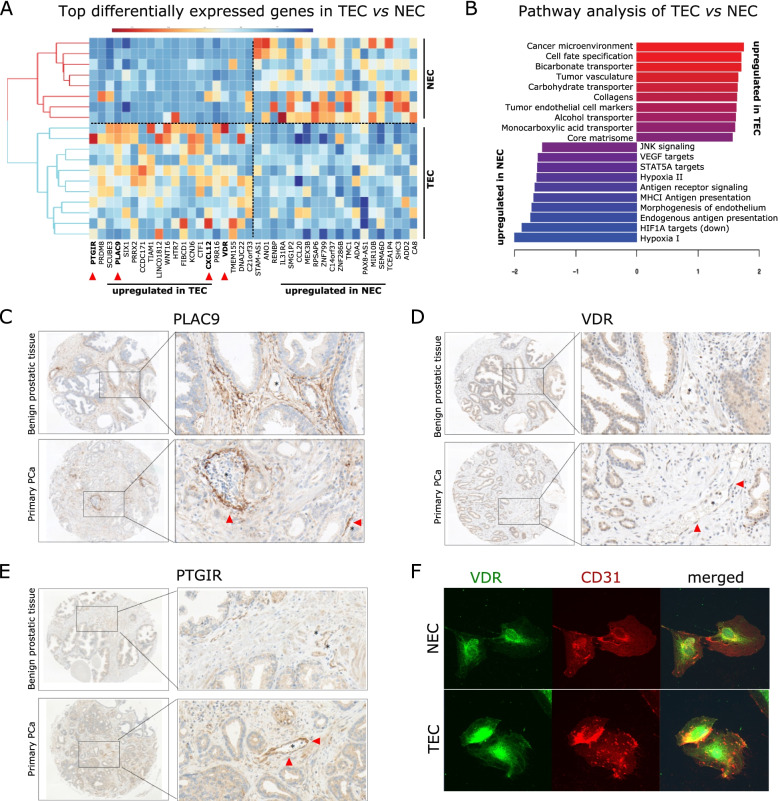
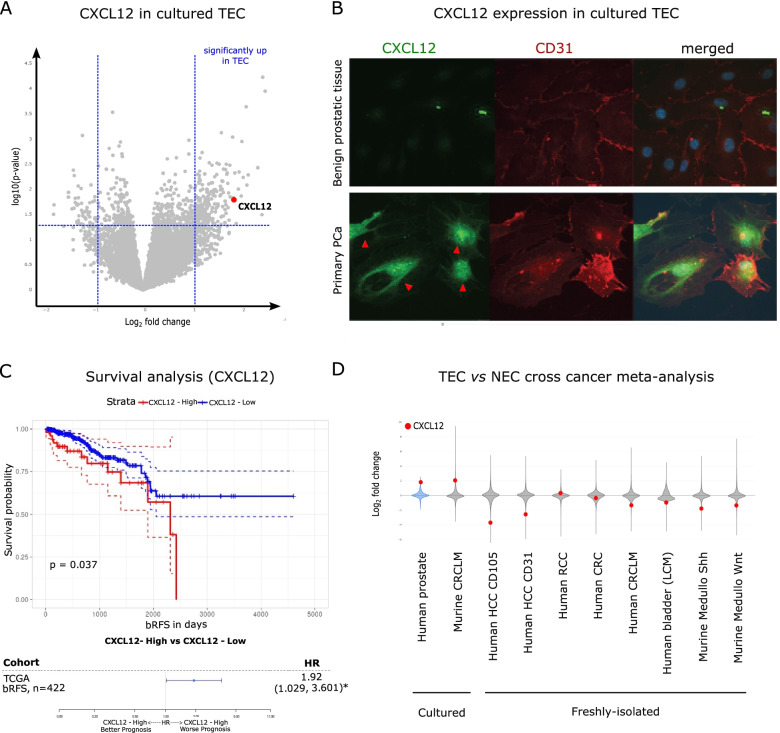
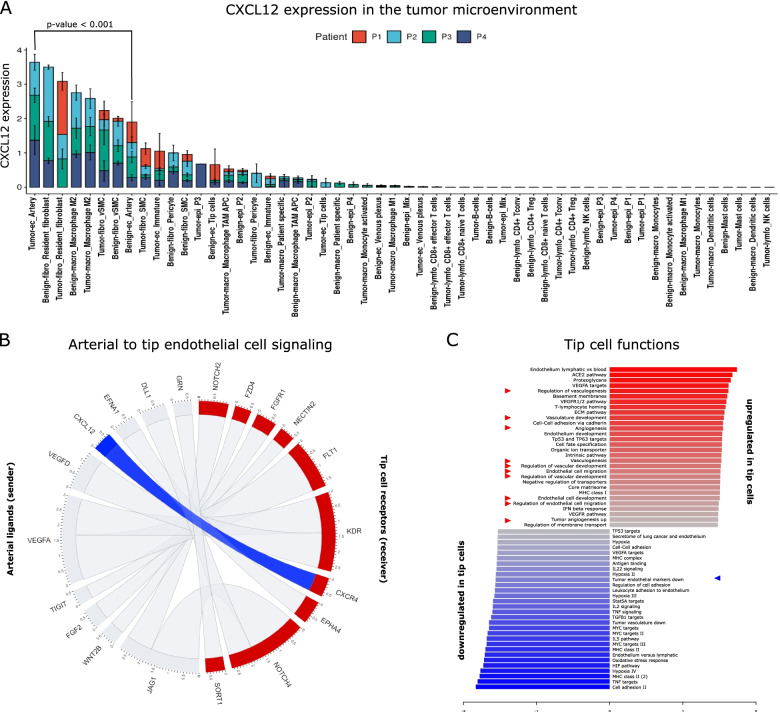
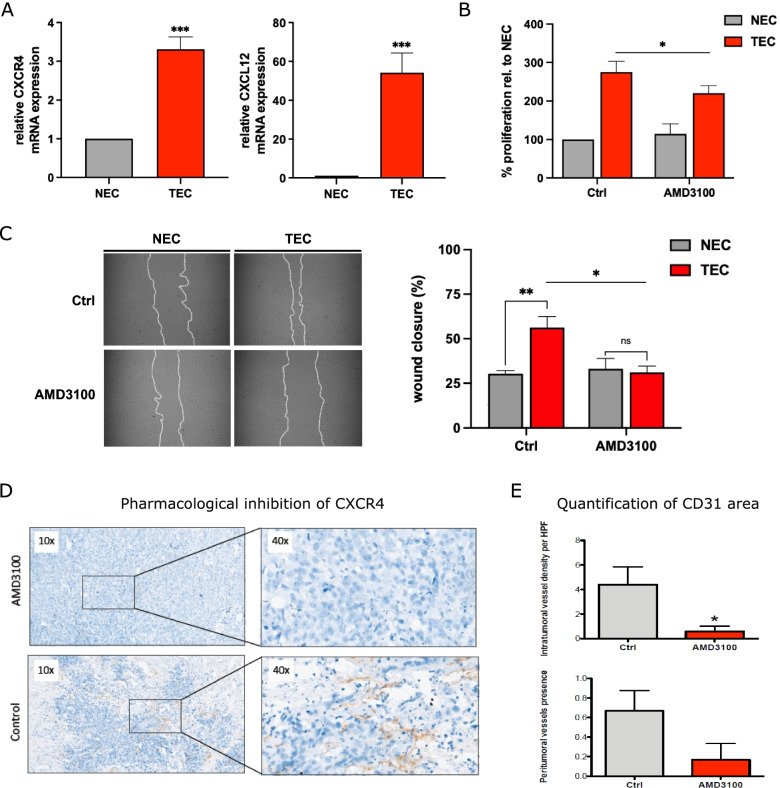
Results: Compared to adjacent normal endothelial cells (NEC) bulk RNA-seq analysis revealed upregulation of genes associated with tumor vasculature, collagen modification and extracellular matrix remodeling in TEC. PTGIR, PLAC9, CXCL12 and VDR were identified as TEC markers and confirmed by IF and IHC in an independent patient cohort. By scRNA-seq we identified 27 cell (sub)types, including endothelial cells (EC) with arterial, venous and immature signatures, as well as angiogenic tip EC. A focused molecular analysis revealed that arterial TEC displayed highest CXCL12 mRNA expression levels when compared to all other TME cell (sub)populations and showed a negative prognostic role. Receptor-ligand interaction analysis predicted interactions between arterial TEC derived CXCL12 and its cognate receptor CXCR4 on angiogenic tip EC. CXCL12 was in vitro and in vivo validated as actionable TEC target by highlighting the vessel number- and density- reducing activity of the CXCR4-inhibitor AMD3100 in murine PCa as well as by inhibition of TEC proliferation and migration in vitro.

Conclusions: Overall, our comprehensive analysis identified novel PCa TEC targets and highlights CXCR4/CXCL12 interaction as a potential novel target to interfere with tumor angiogenesis in PCa.

Keywords: Bulk RNA-seq; CXCR4/CXCL12; Prostate cancer; Single-cell RNA-seq; Target identification; Tip cell; Tumor endothelial cell.


Conflict of interest statement

The authors declare that they have no competing interests.

Figures

Fig. 1
Fig. 1
Functional characteristics of cultured TEC. A Study design. PCa, prostate cancer; NEC, normal endothelial cells; TEC, tumor endothelial cells. B Representative immunofluorescence staining (CD31 and VE-Cadherin) of NEC and TEC. C 3H-thymidine incorporation assay with NEC and TEC cultivated in ECM or ECM + 2% FCS (mean +—SEM; n = 4, p < 0.001). D Micrographs (left) and quantification (right) of NEC and TEC migration in scratch wound assay (mean +—SEM; n = 4, p < 0.001). E Quantification of cell area in TEC and NEC (mean +—SEM; n = 4, p < 0.01) F Quantification of nucleus area in TEC and NEC (mean +—SEM; n = 4, p < 0.01). 1G. % nucleus area/cell in TEC and NEC (n = 4). H Quantification of continuous versus discontinuous junctions (junctional length, % of total junctional length) in TEC and NEC (n = 4)
Fig. 2
Fig. 2
Bulk RNA-sequencing identified novel TEC markers. A Heatmap analysis and hierarchical clustering of the top 20 most up-and downregulated genes. Color-scale: red is higher expressed, blue is lower expressed. B Horizontal bar graphs representing the top 10 differentially expressed pathways as assessed by gene set enrichment analysis. C Micrographs of immunohistochemistry probing PLAC9. Note the high expression levels of PLAC9 in the tumor vasculature. D Micrographs of immunohistochemistry probing VDR. Note the high expression levels of VDR in the tumor vasculature. E Micrographs of immunohistochemistry probing PTGIR. Note the high expression levels of PTGIR in the tumor vasculature. F Representative immunofluorescence staining (CD31 and VDR) of NEC and TEC
Fig. 3
Fig. 3
CXCL12 is a clinically relevant TEC marker. A Volcano plot representing a differential analysis of NEC versus TEC. B Representative immunofluorescence staining (CD31 and CXCL12) of NEC and TEC. Note the high expression levels of CXCL12 in the tumor vasculature. C Kaplan–Meier curves where patients are stratified based on the high or low expression of CXCL12. n = 422, source TCGA dataset. The CXCL12 expression cutoff was determined using the R package “maxstat”. The cut-off point for CXCL12 expression was calculated as a log2 expression value of 17.626. D Violin plots visualizing the log2 fold-change distribution in gene expression (gray area) in murine and human tumor EC versus their counterpart normal healthy EC. The red dot indicates where CXCL12 is located in the distribution. Data are based on a meta-analysis of publicly available transcriptome datasets
Fig. 4
Fig. 4
Single-cell catalogue of the prostate tumor microenvironment. A Graphical representation of the experimental design. B t-SNE analysis of 16,529 freshly-isolated PCa TME cells. C Top panel: t-SNE plots color-coded for the indicated marker genes. Bottom panel: violin plots quantifying the expression of the indicated gene. Note, the numbers on the x-axis correspond to the cluster numbers shown in Fig. 4B. D Dendrogram visualization of hierarchical clustering analysis on gene signature correlations of highly variable genes. Note, the dots on the x-axis are color-coded, as in Fig. 4B. The order is the same as in Fig. 4E. E Heatmap analysis of the top 5 marker genes of all subtypes in the PCa TME. F Left panel: horizontal bar graphs indicating the relative composition of the TME cells across patients. Right panel: horizontal bar graphs indicating the relative cell composition in tumor and benign samples
Fig. 5
Fig. 5
Detailed analysis of the TME stromal cell compartment. A Heatmap analysis of the expression of the PAM50 signature in epithelial cells. B Heatmap analysis of the expression of a curated list of previously published fibroblast and stromal cell markers and other highly upregulated genes. C Volcano plot of differential analysis of macrophages with an M1 vs M2 signature. Canonical M2 marker genes are indicated
Fig. 6
Fig. 6
Single-cell analysis of the endothelial compartment. A Heatmap analysis of the top 10 marker genes of the four EC clusters. Note, the colored arrowheads on the left indicate genes validated by immunohistochemistry (INSRß, FBLN5, Autotaxin (ENPP2)). B Micrographs of immunohistochemistry probing the indicated genes in the tumor vasculature. The left upper panel shows the H&E staining for reference. The left lower p63/AMACR double-staining for PCa validation. C Representation of CXCL12 and CXCR4 expression (y-axis) for each endothelial subtype (x-axis). The statistical significance of the CXCR4/CXCL12 expression difference between the groups was tested using Wilcoxon's test. D Volcano plot of differential analysis of normal vs tumor arterial EC. CXCL12 is indicated in red. E Micrographs of immunohistochemistry probing CXCL12. Note the high expression levels of CXCL12 in the tumor vasculature. F- I. Kaplan–Meier curves and hazard ratio analysis with patients stratified based on the high or low expression of the EC artery signature (F), EC tip marker gene signature (G), EC venous signature (H) and EC immature signature (I). Information from the EC gene expression profiles was condensed into a signature summary using Gene Set Variation Analysis (GSVA). The EC marker gene signature expression cutoff was determined using the results of the GSVA and the R package “maxstat”
Fig. 7
Fig. 7
Receptor-ligand interaction analysis reveals the CXCR4/CXCL12 axis as a therapeutic target. A. CXCL12 expression in individual cell subtypes in the TME. The statistical significance of the CXCL12 expression difference between the Tumor—Benign Artery subtypes was tested using Wilcoxon's test. B Circos plot showing the results of a receptor-ligand interaction analysis using the CellPhoneDB algorithm. C Waterfall plot shows the top up-and downregulated pathways in tip cells compared to other endothelial cell phenotypes
Fig. 8
Fig. 8
In vitro and in vivo validation of targeting the CXCR4/CXCL12 axis to inhibit angiogenesis. A Quantitative RT-PCR analyses of CXCR4 and CXCL12 mRNA expression in prostate NEC and TEC (mean +—SEM; n = 3, p < 0.001). B EZ4U cell prolifaration assay with NEC and TEC treated with 10 µM AMD3100 for 24 h (mean +—SEM; n = 3, p < 0.05). C Micrographs (left) and quantification of wound closure (right) of NEC and TEC migration in scratch wound assay. Cells were treated with 10 µM AMD3100 for 24 h (mean +—SEM; n = 3, *p < 0.05, **p < 0.01). D Micrographs showing immunohistochemistry results after probing for the endothelial marker CD31 in tissues treated, or not, with the CXCR4 inhibitor AMD3100. E Quantification of intratumoral and peritumoral microvessel density in control vs AMD3100 treated murine PCa tissue

References

    1. Horvath L, Thienpont B, Zhao L, Wolf D, Pircher A. Overcoming immunotherapy resistance in non-small cell lung cancer (NSCLC) - novel approaches and future outlook. Mol Cancer. 2020;19(1):141. doi: 10.1186/s12943-020-01260-z. - DOI - PMC - PubMed
    1. Lambrechts D, Wauters E, Boeckx B, Aibar S, Nittner D, Burton O, et al. Phenotype molding of stromal cells in the lung tumor microenvironment. Nat Med. 2018;24(8):1277–1289. doi: 10.1038/s41591-018-0096-5. - DOI - PubMed
    1. Heidegger I, Pircher A, Pichler R. Targeting the tumor microenvironment in renal cell cancer biology and therapy. Front Oncol. 2019;9:490. doi: 10.3389/fonc.2019.00490. - DOI - PMC - PubMed
    1. Pircher A, Hilbe W, Heidegger I, Drevs J, Tichelli A, Medinger M. Biomarkers in tumor angiogenesis and anti-angiogenic therapy. Int J Mol Sci. 2011;12(10):7077–7099. doi: 10.3390/ijms12107077. - DOI - PMC - PubMed
    1. Siegel RL, Miller KD, Jemal A. Cancer statistics, 2020. CA Cancer J Clin. 2020;70(1):7–30. doi: 10.3322/caac.21590. - DOI - PubMed

Publication types