. 2022 Jun 18;13(1):3507.
doi: 10.1038/s41467-022-31264-w.

Complex regulation of Gephyrin splicing is a determinant of inhibitory postsynaptic diversity

Affiliations

Complex regulation of Gephyrin splicing is a determinant of inhibitory postsynaptic diversity

Raphaël Dos Reis et al. Nat Commun. .

Abstract

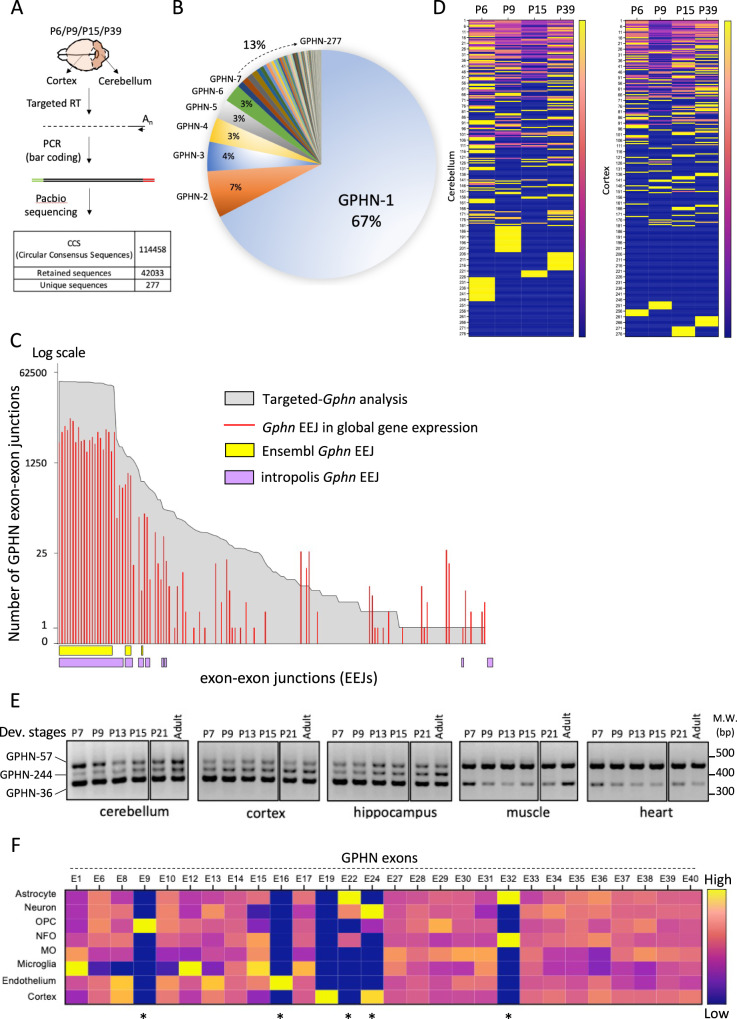
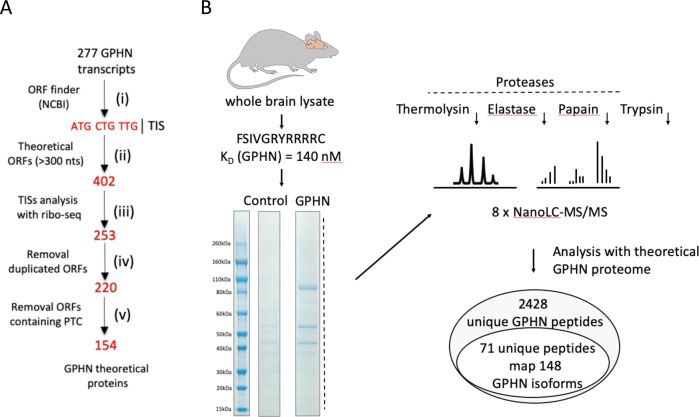
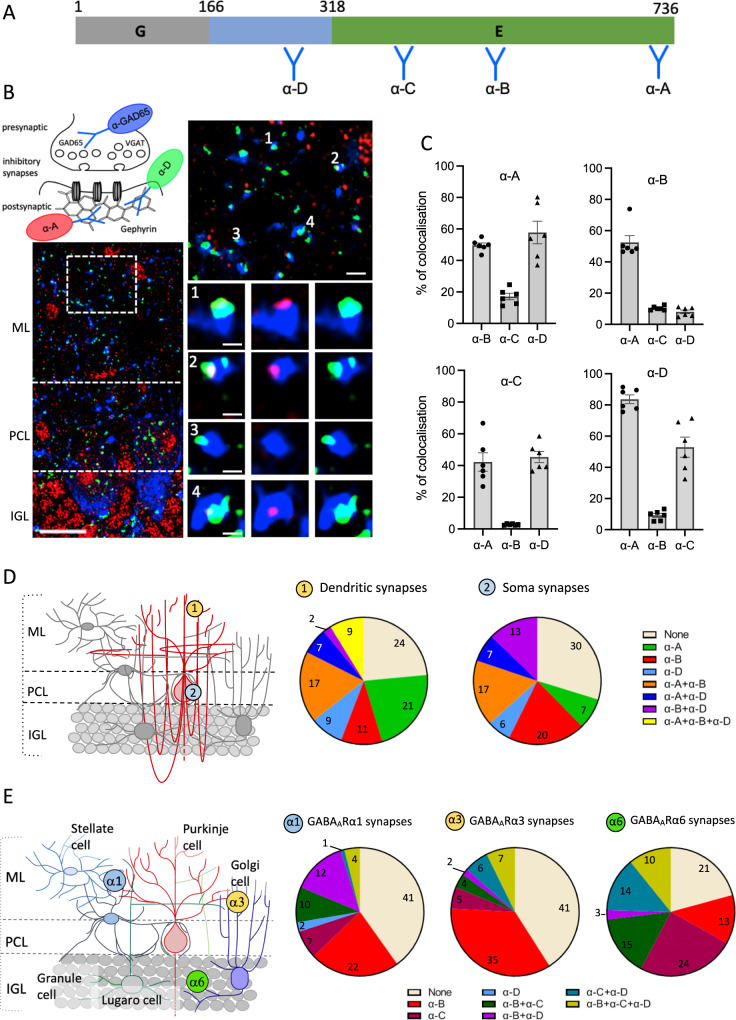
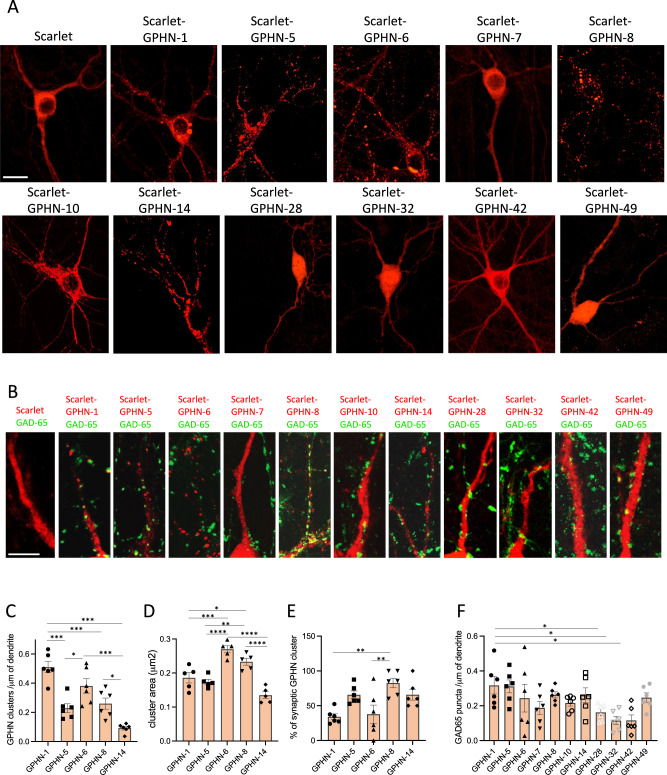
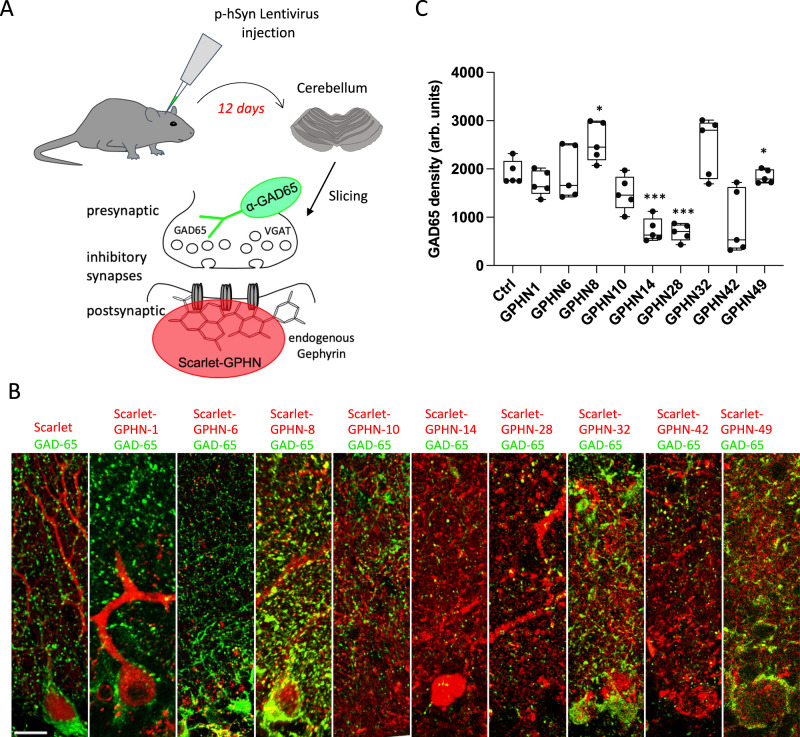
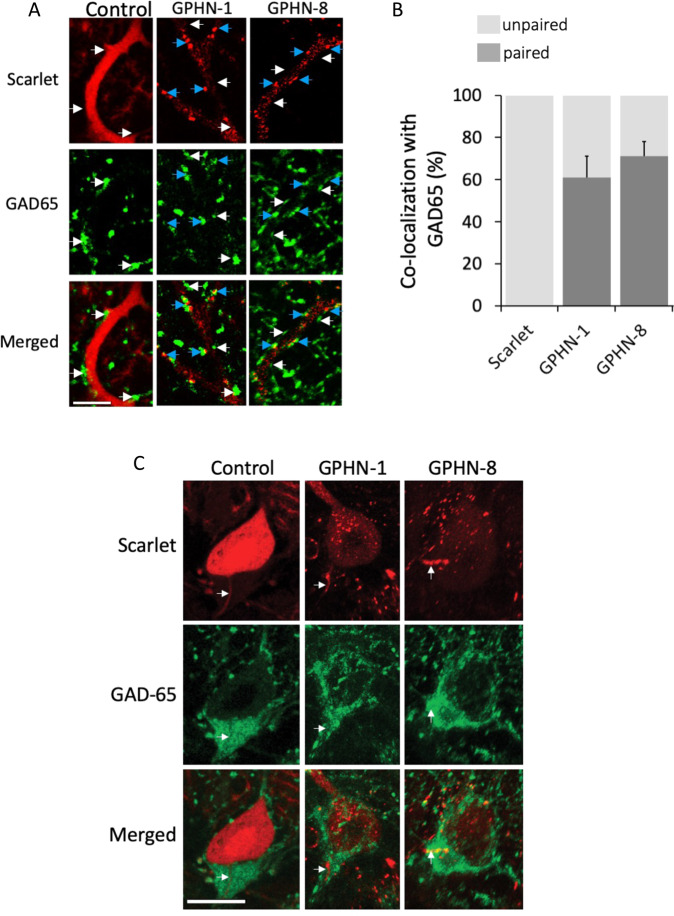
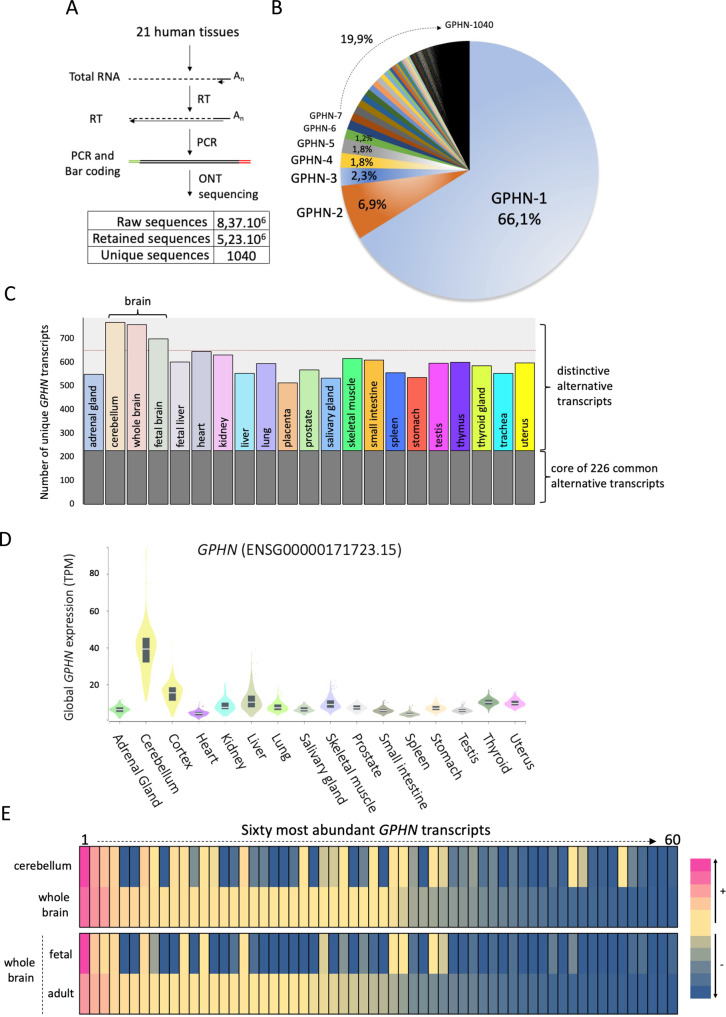
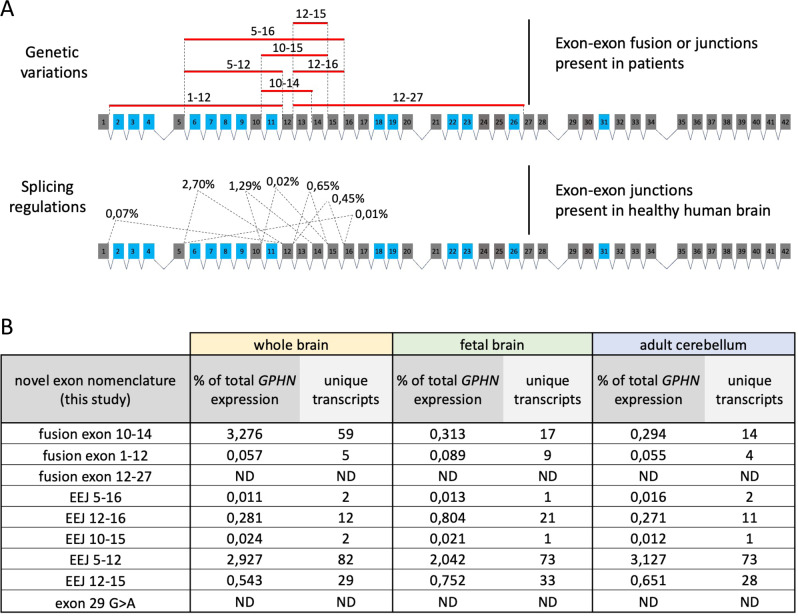
Gephyrin (GPHN) regulates the clustering of postsynaptic components at inhibitory synapses and is involved in pathophysiology of neuropsychiatric disorders. Here, we uncover an extensive diversity of GPHN transcripts that are tightly controlled by splicing during mouse and human brain development. Proteomic analysis reveals at least a hundred isoforms of GPHN incorporated at inhibitory Glycine and gamma-aminobutyric acid A receptors containing synapses. They exhibit different localization and postsynaptic clustering properties, and altering the expression level of one isoform is sufficient to affect the number, size, and density of inhibitory synapses in cerebellar Purkinje cells. Furthermore, we discovered that splicing defects reported in neuropsychiatric disorders are carried by multiple alternative GPHN transcripts, demonstrating the need for a thorough analysis of the GPHN transcriptome in patients. Overall, we show that alternative splicing of GPHN is an important genetic variation to consider in neurological diseases and a determinant of the diversity of postsynaptic inhibitory synapses.


Conflict of interest statement

The authors declare no competing interests.

Figures

Fig. 1
Fig. 1. Splicing regulation of Gphn expression in mouse brain.
A Procedure was developed to analyze Gphn expression by long-read sequencing. Gphn transcriptomes expressed at each developmental stage were prepared separately and combined in a multiplexed library sequenced with the PacBio technology. The number of retained Circular Consensus Sequences (CCS) and unique sequences are indicated at the bottom of the draw. B Distribution and percentages of alternative transcripts expressed by Gphn in Mouse brain. C Graph displaying the Gphn exon-exon junctions (EEJ) found in this study (gray), in 2,872.109 short read sequences obtained by global gene expression analysis (red), in the Ensembl database (yellow) and using Snaptron (purple). D Heat map graphical representation of the 277 Gphn transcripts expressed at P6, P9, P15, and P39 in cortex and cerebellum tissues. Blue is associated with the lowest expression, and yellow with highest expression. E Example of transcripts including the selection of an alternative 3’ splice site in exons 14 which are detected by RT-PCR. Amplicons corresponding to the Gphn−36, Gphn−57, and Gphn−244 transcripts are analyzed in 6 mouse developmental stages, 3 brain areas, skeletal muscles, and heart. F Quantification of Gphn exons expressed in various neuronal cell types of mouse brain using data from (19). Heat map graphical representation of each exon relative expression level in different cell types. Exon expression levels are displayed as the average value obtained from quadruplicate after normalization by global expression of Gphn in all cell types (blue for the lowest expression, and yellow for the highest expression). Stars indicated the unannotated and validated exons (Supplementary Fig. 4) and source data are provided as a Source Data file.
Fig. 2
Fig. 2. Gphn expresses a myriad of GPHN protein isoforms.
A Filtering pipeline used in this study to generate GPHN theoretical proteome, (i) Translation Initiation Start (TIS) identification, (ii) retained ORFs including at least 300 nucleotides, (iii) ORFs initiated with a TIS confirmed by biological evidences, (iv) removal of duplicated ORFs, (v) withdrawal of ORFs including PTC. B Workflow to isolate GPHN protein isoforms present at GABA-A and Glycine inhibitory synapses and MS processing to analyze them. GPHN was isolated from whole-brain lysate via affinity purification using a neurotransmitter receptor peptide (FSIVGRYRRRC; KD (GPHN) = 140 nM). Nano-LC MS/MS identified 2428 unique GPHN peptides, in which 71 corresponded to 148 novel GPHN protein isoforms. Source data are provided as a Source Data file.
Fig. 3
Fig. 3. Heterogeneous distribution of endogenous GPHN reveals diversity in the assembly of inhibitory synapses.
A Schematic of the GPHN-1 protein sequence in which are mapped the epitopes detected by four GPHN antibodies (α-A, α-B, α-C and α-D). B GAD-65/VGAT colocalization with GPHN epitopes α-A and α-D in cerebellar slices. Enlarged views of the white dashed box show the heterogeneous staining of synaptic GPHN epitopes. scale bars bottom-left: 15 µm, upper-right: 2 µm and 1 µm in panels 1, 2, 3, and 4. C Quantification of GAD-65/VGAT colocalization with multiple combinations of the GPHN antibodies was performed in n = 6 independent experiments. Bar graphs show means ± SEM (D, E). At the left, a schematic of cerebellar cortex cellular organization in which are displayed specific inhibitory synapses (numbered-circle) present at the molecular layer (ML), Purkinje cell layer (PCL), and internal granular layer (IGL). At the right, quantification of one or multiple GPHN epitopes at specific inhibitory synapses, for distinct neuronal sub-localization (D) (n = 3 mice), and specific subunits of GABAA-R (E) (n = 3 mice). Color matches to antibodies or antibodies combinations are shown to the right (D) or below (E) the graphs. Source data is provided as a Source Data file.
Fig. 4
Fig. 4. GPHN isoforms have distinct synaptic properties.
Eleven Scarlet-tagged GPHN isoforms were analyzed in hippocampal primary neuronal culture. Exogenous GPHN isoforms were selected from the pool of most expressed Gphn transcripts in cortex and cerebellum (Fig. 1D). A Representative images of global localization of GPHN isoforms (red) in neuronal cells. B Confocal analysis of proximal dendrites in neuronal cells expressing Scarlet or Scarlet-tagged GPHN isoforms (red), presynaptic side was stained with anti-GAD-65 (green). C Density of GPHN clusters along the dendrite. D Size of the GPHN clusters. E Percentage of GPHN clusters associated with a GAD-65 punctum. F Density of GAD-65 puncta along the dendrite. For experiments performed in C–F, at least 12 cells were analyzed in n = 6 independent experiments for C, E, and F, and n = 5 independent experiments for D. Bar graphs show means ± SEM. ****P < 0,0001, ***P < 0,0010, **P < 0,01, *P < 0,05. One-way analysis of variance (ANOVA) for CE. *P < 0,05. Kruskal–Wallis test for (F). Scale bar: 25 µm (A) and 15 µm (B). Source data is provided as a Source Data file.
Fig. 5
Fig. 5. Increase of GPHN isoform levels modulates the number of inhibitory synapses in mouse cerebellum.
Analysis of inhibitory synapses connected to Purkinje cells in mouse cerebellar slices after transduction of lentivirus expressing Scarlet-tagged GPHN isoforms. A Schematic displaying the experimental procedure. B Cerebellar cortex slices in which inhibitory synapses are stained at pre- and postsynaptic sides using anti-GAD65 antibody (green) and Scarlet fluorescence (red), respectively (n = 5 mice for each isoform). C Quantification of GAD-65 density detected in panel B (n = 5 independent experiments). Box boundaries in C are the 25th and 75th percentiles, the horizontal line across the box is the median, and the whiskers indicate the minimum and maximum values. ***P < 0,0010, *P = 0,0179 and *P = 0,0128 for GPHN8 and GPHN49, respectively. Two-sided Student's t-test. Scale bar: 15 µm. Source data is provided as a Source Data file.
Fig. 6
Fig. 6. Different recruitment efficiency of GPHN isoforms to inhibitory synapses in mouse cerebellum.
Comparative analysis of two GPHN isoforms having different clustering properties in mouse cerebellar Purkinje cells. An experimental procedure was performed like in Fig. 5A using three different viruses expressing respectively exogenous Scarlet and Scarlet-tagged GPHN-1 and −8 (red). A Representative confocal images that display the exogenous proteins in PC dendrites of cerebellar slices. White arrows point to GAD65 synapses (green) connecting PC dendrites lacking exogenous proteins, while blue arrows point to GAD65 synapses containing postsynaptic exogenous proteins. B Quantification of inhibitory synapse co-localization of GAD65 and exogenous proteins (n = 3 independent injected animals. Bar graphs show means ± SEM. C Different localization of Scarlet or Scarlet-GPHN isoforms (red) at the axon initial segment (AIS) of Purkinje cells in which GAD65 is immunostained (green). Note that only GPHN-1 and −8 are detected at the AIS, while other isoforms such as GPHN-28 are not. Scale bars: 15 µm.
Fig. 7
Fig. 7. Splicing regulation of GPHN expression in 21 human tissues.
A Procedure and number of sequences obtained by long-read sequencing with the Oxford Nanopore technology. Amplification of GPHN transcriptome from each 21 human tissues was processed independently and mixed in a multiplexed library. B Distribution and percentages of alternative transcripts expressed by GPHN in the human body. C Graphical representation showing the proportion of splice variants that were detected in all tissues (core of common 226 alternative transcripts) and those distinctly expressed in one or more tissue(s). D Graphical representation of global expression level of GPHN in 16 distinct human tissues using the data provided by the Genotype-Tissue Expression (GTEx) project (https://gtexportal.org/home/). E Heat map graphical representation of the 60 most expressed GPHN transcripts in adult and fetal human brain, as well as the whole brain versus the cerebellum. The yellow color indicates an identical expression level between samples, while the blue scale shows a decrease and the pink an increase. Source data is provided as a Source Data file.
Fig. 8
Fig. 8. Expression of pathological GPHN transcripts is repressed in the healthy human brain.
A Schematic representation of genetic variations found in patients (upper panel) and the corresponding spliced exon-exon junctions identified by this study in the healthy human brain samples (lower panel). Percentages of each splicing event indicated the average detection in the adult entire brain, fetal entire brain, and adult cerebellum. B Table summarizing the detection of each exon-exon junctions in brain samples, and the number of unique transcripts containing them.

Similar articles

Cited by

References

    1. Paul A, et al. Transcriptional architecture of synaptic communication delineates GABAergic neuron identity. Cell. 2017;171:522–539.e520. doi: 10.1016/j.cell.2017.08.032. - DOI - PMC - PubMed
    1. Wamsley B, Fishell G. Genetic and activity-dependent mechanisms underlying interneuron diversity. Nat. Rev. Neurosci. 2017;18:299–309. doi: 10.1038/nrn.2017.30. - DOI - PubMed
    1. Huang ZJ, Paul A. The diversity of GABAergic neurons and neural communication elements. Nat. Rev. Neurosci. 2019;20:563–572. doi: 10.1038/s41583-019-0195-4. - DOI - PMC - PubMed
    1. Essrich C, Lorez M, Benson JA, Fritschy JM, Luscher B. Postsynaptic clustering of major GABAA receptor subtypes requires the gamma 2 subunit and gephyrin. Nat. Neurosci. 1998;1:563–571. doi: 10.1038/2798. - DOI - PubMed
    1. Feng G, et al. Dual requirement for gephyrin in glycine receptor clustering and molybdoenzyme activity. Science. 1998;282:1321–1324. doi: 10.1126/science.282.5392.1321. - DOI - PubMed

Publication types